


And there is at least some danger that the silhouette flying across the face of the Full Moon is ... a black swan.
Last week, we had the second exact aspect of Uranus square Pluto; it's a long-range astrological event with a history of sending the world into a financial tailspin and reoccurs a number of times heading into 2015.
I've discussed the broad symbolism of it in these columns over the past year and detailed it at length in Forecast 2012. It's basically aggressive, radical reform challenges the status quo and the desire of the plutocrats to keep tight control.
According to a news report sent to me by my colleague Marlene, at www.astrologicalinvesting.com, George Soros is now so worried by the symbolism of the aspect, he has dumped stocks and turned to gold. I don't know if the eminent investor has been in the fortune teller's tent lately, but it sure sounds like it.
"Soros, who has written extensively of a coming global paradigm shift in his book, The Crash of 2008 and What It Means, calling the current economic and political model ”an end of an era,” has recently suggested that the financial and economic situation across the world is so serious that Europe could soon descend into chaos and conflict. He also notes that the world is entering “one of the most dangerous periods in modern history”, and foresees violent riots in America and a brutal clamp-down by the government that will dramatically curtail civil liberties."
There is a chance some of that will take centre stage over the next week or two, because the Full Moon sets off the energy ... with the Moon in Aries conjunct Uranus and square Pluto in Capricorn, while the Sun in Libra is opposed to Uranus and square Pluto.
The aspect involves three of the Cardinal signs - action signs; and with Venus squaring Mars, it's a lot of potentially negative energy.
Over the past few weeks, we've gone through long-range and weekly planetary targets for a range of indices to get an idea of what's possible for a final topping range.
Last weekend, I introduced the main part of that Eye edition with a couple of planetary charts which hit their targets fairly precisely. This week, we'll repeat the exercise, starting with India's Nifty 50.
 |
| click for larger image |
I updated this chart last weekend with the new upside target listed at 5690-ish. Mission accomplished.
Similarly, in the past few weeks, we've kept a close eye on the targets for Germany's DAX index.
 |
| click for larger image |
And with a high of 7478 hit on Friday, the DAX has also come very close. Now, there's something else about this chart I want to stress for any of you having trouble actually applying some of the techniques outlined in The Technical Section. As y'know, I've been discussing the lack of negative divergence apparent in the long-range Canary, particularly on the SP500.
This is another example of it, using the fast MACD. I've made the point in the book that negative divergence takes time to develop and there's a classic example of that marked with a yellow oval during the small Head&Shoulders pattern which formed the last time the DAX hit these planetary levels. The MACD peaks continued declining as price formed the topping pattern.
And, as I've been doing with the 50 CCI, I stress that sort of divergence just isn't there in any meaningful form during the current price moves.
What that means is this ... it is PROBABLE that we have NOT yet seen the final highs in most of these indices. Now, the only caveat to that is the arrival of a Black Swan. And, by their nature, Black Swans are difficult to predict. All I can say in terms of The Spooky Stuff is that the next couple of weeks sets up the conditions for the potential for one to occur. But, most of the time, we follow the rule that astrological expectations do not override technical conditions.

In discussing Pollyanna, the SP500, last weekend, I indicated the Neptune price level the index had hit was historically important and that we had probably touched at least a stalling point. Eh! There's no need to labor the point. If you need a reminder of the long-range levels, go back into the Archives.
We took a look at London's FTSE last weekend and I said its failure to close above a Venus/Uranus price crossing point indicated a correction was likely to begin. And ...
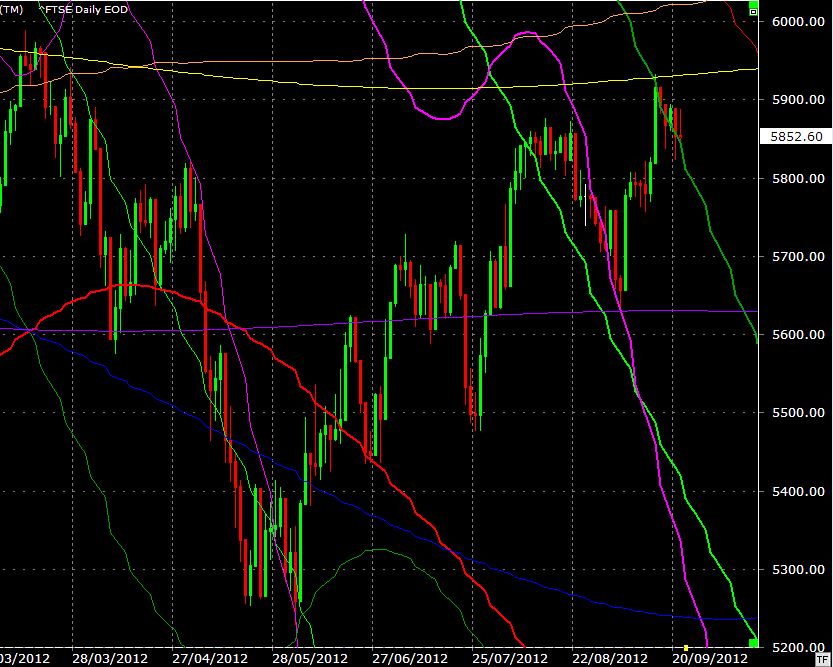
Again, check the Archives for the FTSE's Weekly Planets targets. And now we're going to do something I really should have done long ago for my Asian readers ... look at the state of the Singapore and Hong Kong markets.

The Hang Seng index has hit Weekly Planets targets capable of stalling its recent rise. There are no warning signs from the state of the oscillator, but further gains require the index to move above the grey Neptune line and also get on top of the primary Saturn line (thick cyan).
The Straits Times index, of Singapore, is showing a potential double top with significant negative divergence in the height of the current MACD histogram peaks - a potential warning sign the next couple of hundred points will be difficult to achieve immediately.

Recently, I've been showing one of my private charts I use for the ASX200 when it is between levels on its Weekly Planets chart ... and the template also works for the STI.

In the coming week, price on the Straits Times will have to overcome the negative influence of a downtrending Mars line ... or drop with it.
And our final chart for this weekend is my home index, the ASX200 ... and Auntie's Weekly Planets targets, whichever way things go.

Okay ... a brief recap. Those indices which have put on a spurt, like the Nifty and the DAX, are hitting important weekly levels ... as Pollyanna did the previous week.
If we were to take our cues from a purely technical point-of-view, there are no major alarm bells going off and therefore the probability is that most of these indices are still within a Bullish run.
The only thing which would normally throw us off an optimistic course would be the arrival of a Black Swan ... and there are Spooky Stuff conditions which allow such an event to occur in the near future.
However, even though the Harvest Moon does carry that potential, we also have to consider that we're not only coming into the end of the month, but also the end-of-quarter, when the bonus boys often cook the books to line their pockets.
In the past few weeks, we've been through a range of long-range and weekly planets charts to get an idea of price targets, upside and downside, and all of that information is in the Archives.
Safe trading - RA

Important reading: Randall Ashbourne's article, Jupiter's cycle and its effects on Wall Street and a posting of the weekly Eye of Ra report in this blog, titled A look at the Venus Retrograde effect
(Disclaimer: This article is not advice or a recommendation to trade stocks; it is merely educational material.)
Copyright: Randall Ashbourne - 2011-2012


0 comments:
Post a Comment
Note: Only a member of this blog may post a comment.