Sunday, December 30, 2012

Happy New Year ... and the Forecast

Randall Ashbourne, an associate of Astrological Investing, posts a weekly market report on his web site, theidiotandthemoon.com The following is this weekend's Eye of RA report: Week beginning December 31, 2012

Thank you for your company during 2012 and best wishes for a happy and prosperous New Year!

Forecast 2013 will be available next weekend, it will be priced at $20, and for those of you prefer hard copies, there'll be no restriction on printing the document.

And the format will be different from last year. 


While the major trend change dates for the year are listed, there is a month-by-month breakdown of the key astrological transits, New Moon and Full Moon dates, and a list of critical reversal dates for each month.

I have analysed Moon Trading performance across 12 of the world's major indices, including gold, and the results are stunning. They identify which indices should NOT be traded using lunar phases, as well as identifying those markets where the normal rules need to be tweaked to maximise profits.

And I will reveal, I think for the first time anywhere, stunning planetary price charts which set the upside and downside movements in the price of gold.

There will be individual long-range price target charts for 12 indices, including the SP500, NDX, FTSE, DAX, CAC, Nifty, Hong Kong, Singapore and Shanghai ... and the ASX200 and TSX60.

In the meantime ...

Well, Santa has been busy delivering bags of goodies to everyone who was nice during the year.

Except he apparently thinks some people who work in Washington are just a bit naughty. American markets waver at the edge of the fiscal cliff like lemmings in denial of their genetic imperative.

Still, the big picture is that the SP500 remains in an uptrend.

click for larger image

The chart above shows Pollyanna continuing to ride the internal Fibonacci lines of a rising pitchfork. And below we have a close-up.

click for larger image

There have been three breaks below the internal Fibonacci levels marked in red - and all of those breaks have been recovered quickly since the pitchfork was established following the May/October decline of 2011.

The 500 is approaching that layer once again, with traders unsure whether US politicians can compromise on the tax increases and spending cuts due to start taking effect in January.

While hope remains alive, there's a chance the lower red level will continue to provide support for the rally angle. If not, that job will fall to the lower tyne of the pitchfork, currently priced around 1340/1350.
click for larger image

The Weekly Planets chart for Pollyanna shows a couple of Saturn lines around that level to provide additional support. However, there is a stronger layer around 1378.

It will take another couple of weeks for these columns to return to a more normal mode. My mind is still tuned to looking at the broad picture for a whole range of indices over the course of the next year.

See you in 2013!

Safe trading - RA

Randall Ashbourne
Astrological Investing's associate, Randall Ashbourne, author of the eBook, The Idiot and The Moon, writes a free weekly column titled, The Eye of Ra on his web site in  which he explains the potential impact of astrological aspects and the current state of technical conditions. Ashbourne's charts are revealing illustrations of exactly what has occurred in the market and the probability of what to expect.
Important reading:  Randall Ashbourne's article, Jupiter's cycle and its effects on Wall Street and a posting of the weekly Eye of Ra report in this blog, titled A look at the Venus Retrograde effect
(Disclaimer: This article is not advice or a recommendation to trade stocks; it is merely educational material.)
Copyright: Randall Ashbourne - 2011-2012

Thursday, December 20, 2012

Just Another Winter Solstice - December 21, 2012

The Winter Solstice
Dec 21 2012, 6:11:37 AM EST, Washington D.C.

The predictions derived from the Solstice Chart apply to the next three months until the Spring Equinox.


We will look at this Winter Solstice from the point of view of the general economy.  

My analysis is set for Washington D.C.   If you live in another country, set the coordinates for your capital city.  

But first...
 
You have all heard the stories of the world coming to an end because December 21, 2012 is the end of the Mayan Calendar. 

Well, my question to anyone who says this is, "Does the world end when our calendar comes to end on December 31? Do you wake up on January 1 and celebrate a New Year?"

 The Mayan calendar moves in cycles with the last cycle ending in December 2012. And because it is a wheel, there is no end, only a continuation - just as Aries comes again after Pisces in the zodiac. (Read more at Time and Date.com and the article, "Beyond 2012: Why the World Won't End"at Nasa.org)

Upcoming Astrological Events...

Dec 21 - SUN into Capricorn
Dec 22 (Saturday) - VENUS Opposition JUPITER
Dec 25 (Christmas) - SUN Square URANUS, MARS into Aquarius
Dec 28 - Full Moon
Dec 30 (Sunday) - SUN conjunct PLUTO, SUN Sextile SATURN

Jan 04 - MARS Trine JUPITER
Jan 07 - MARS Square SATURN
Jan 11 - New Moon
Jan 16 - VENUS conjunct PLUTO
Jan 17 - VENUS Sextile SATURN
Jan 25 - MERCURY Square SATURN, SUN Trine JUPITER
Jan 26 (Saturday)- Full Moon
Jan 30 - SUN Square SATURN, JUPITER Direct

Click here for February and March astrological events.


Click to read my Chart Analysis for the Winter Solstice chart for Washington D.C., and notes regarding planets changing directions in February. 


TO ALL WHO CELEBRATE RELIGIOUS AND  HOLIDAY FESTIVITIES MERRY CHRISTMAS AND HAPPY HOLIDAYS

and HAPPY NEW YEAR TO ALL!


All the best ~ Marley
Marlene Pfeifle, CAP

Know what stocks to buy for 2013!
Grace Morris' latest book, How to Choose Stocks to Outperform the Market 2013, Click to purchase her Book
STOCK RECOMMENDATIONS, and IPO dates and Incorporation Dates on recommended stocks each month!
SUBSCRIBE FOR A THREE MONTH TRIAL ($55.00) or 1 yr subscription to the Astro Economic Newsletter

To receive articles and newsletters before they are posted on the web site or blog, please subscribe here.

Saturday, December 15, 2012

January 2013 Astrological Calendar - Transits for NY NY, The NYSE

Astrology calendar showing the day and times of planetary aspects for the NYSE, for the month of January 2013.

Astrology Calendar for the NYSE, January 2013

Click image to view full size calendar.

January 2013 Astrological Calendar - Transits for London, England, The FTSE

Astrological Calendar showing the day and times of planetary aspects for the FTSE, for the month of December, 2012.
Astrological Calendar for planetary aspects for the FTSE, January 2013
Click image to view full size calendar.

January 2013 Astrological Calendar - Transits for Sydney, Australia, The ASX

Astrology calendar showing the day and times of planetary aspects for the ASX, for the month of January 2013
Astrological Calendar for planetary aspects for the ASX, January 2013


Click image to view full size calendar

Friday, December 14, 2012

Markets diverging across the globe

Randall Ashbourne, an associate of Astrological Investing, posts a weekly market report on his web site, theidiotandthemoon.com The following is this weekend's Eye of RA report: Week beginning December 17, 2012


The Sagittarian Moon produced a brief spike in optimism last week, but north American markets couldn't hold the gains. 

We now have significant divergence building across world indices, with important markets in Europe and Asia topping their September/October peaks.
Wall Street remains captive to the "fiscal cliff" scenario, with big tax increases and spending cuts set to come into effect from the New Year unless a compromise deal is done ... and fast.

Pundits are betting there's only a 25% chance the deal will get done in time, but are still pinning hopes there'll be retrospective legislation in January. Since some of the tax increases affect capital gains, there's a danger of a panic-selling event as traders and investors scramble to unload gains to minimise the tax impact.

There are a couple of major astrological events this week ... Venus trines Uranus and the Sun makes its transition into Capricorn.

I mentioned a few weeks ago that a trine should not be read as either benign or difficult, but that it does imply "the rapid removal of obstacles". So, there is a chance we could see a sudden breakthrough in the talks between President Obama and House Speaker Boehner this week.

In any case, Venus trine Uranus is one of those major aspects with a habit of moving markets; which is understandable since Venus rules money and Uranus has rulership of stock markets.

It is, however, an aspect somewhat more inclined to producing a downturn in prices, rather than a near-term bottom.
click to view larger image

Above is a weekly chart of the SP500 with past instances of the aspect marked with red bars. The last three all produced slumps which lasted for several weeks.

Markets in Europe and Asia are putting in new Highs above the September/October peaks - including the FTSE, the DAX, the Nifty, the STI, Hang Seng, ASX and Japan.

The coming week may well decide if north America joins them - or provides the catalyst for a worldwide decline. We got the normal Sagittarian effect on Tuesday and Wednesday last week, producing a short-lived spike in indices like Pollyanna, the SP500.

Unlike the other markets mentioned, Wall Street and the Nasdaq couldn't hold the new ground - still well below the level of the 3Q peaks.

click to view larger image

Miss Polly pushed up into the twin Saturn zone a few dollars either side of 1440, but dropped back to finish the week still playing around the 1410ish zone marked on her long-range planetary charts. Above is the 500's Weekly Planets chart and the importance of that primary Neptune around 1410 is obvious.

Other indices are still playing within the bounds of the December range charts I published for a broad group of indices in the December 3 edition, available in the Archives.

Forecast 2013


There will be no update next weekend. I'll take this opportunity to thank you all for your interest during the year and wish each of you a happy holiday season.

I'm still researching material for next year's Forecast - but it will contain in-depth chapters on a couple of areas which will be of major interest to some traders.

One of those chapters will be on gold and I'll reveal, I think for the first time anywhere, precisely which planetary price lines set the long and medium term range targets for the price of gold.

I'll also be taking another look at The Moods of The Moon ... specifically which of the world's major stock indices produce the highest profits by trading the monthly lunar cycle. And that's going to be a real surprise!

In the meantime ...

Safe trading - RA

Randall Ashbourne
Astrological Investing's associate, Randall Ashbourne, author of the eBook, The Idiot and The Moon, writes a free weekly column titled, The Eye of Ra on his web site in  which he explains the potential impact of astrological aspects and the current state of technical conditions. Ashbourne's charts are revealing illustrations of exactly what has occurred in the market and the probability of what to expect.
Important reading:  Randall Ashbourne's article, Jupiter's cycle and its effects on Wall Street and a posting of the weekly Eye of Ra report in this blog, titled A look at the Venus Retrograde effect
(Disclaimer: This article is not advice or a recommendation to trade stocks; it is merely educational material.)
Copyright: Randall Ashbourne - 2011-2012

Thursday, December 13, 2012

New Moon in Sagittarius - Will the Grinch Steal Christmas?

Astrological Investing New Moon forecasts show general trends and financial outlook for the month. The New Moon in Sagittarius, December 13 - Chart from the point of view of Wall Street and the NYSE.
Click to read this article in full on the astrologicalinvesting.com web site.
(Click for larger image)
The American people went to the voting booths in November and elected a Democratic President and a Republican House - a demand from the people for compromise between what the two parties represent. They voted for President Obama to have a second chance and move the nation forward through their economic problems. However, they also voted for fiscally conservative representatives in Congress to work to hold in the reins on the spending and tax increases.

What it seems the people actually got is a stale-mate and a staring contest on who is going to blink first.

Wall Street isn't sure who will blink - or if anyone will blink. Uncertainty and fear of what the government may do is never good for the market.

With uncertainty of what will happen, investors are taking the opportunity to clean up their portfolios, and some are simply dumping their positions in equities. According to Economist Robert Wiedemer, billionaires Warren Buffet, John Paulson, and George Soros all have been selling millions and millions of shares.

So forget about blinking, is the President and Congress actually going to just close their eyes as they drive the US over the fiscal cliff Thelma & Louise style?

Is the President going to get his Christmas wish, or will the Republicans get their way? Will the Speaker of the House get a stocking full of coal?

Let's look at the New Moon chart to see what the planets have to say...
Note: New Moon periods often coincide with temporary highs relative to the direction the market is trending.  But there are times when it doesn't work out that way! (Read Randall Ashbourne's article, The Moods of the Moon - Trading the Mood Swings of the Monthly Lunar Cycle. Purchase his eBook, The Idiot and the Moon

An Astrological Trip Around the New Moon in Sagittarius Chart

The Grinch's opportunity to steal Christmas?
Depending upon what Christmas means - if what is valued is in our hearts, no. Christmas will come no matter what.

Materially, well yes, opportunity is on The Grinch's side to prevent a Santa Claus Rally, because for Wall Street, Christmas holds no spiritual meaning.

Bad Boys Rule - and we know what Bad Boys get for Christmas, right?

The "Bad Boys" ruling this horoscope are Mars, Saturn, and Pluto - though they each have positive sides to their nature, they often act harshly even when showing their good side. It's not easy being good.

Mars rules the Scorpio rising New Moon chart along with Pluto - Mars is exalted in Capricorn, and in mutual reception with Saturn residing in Scorpio. Instead of just rushing into action where fools would never dare, Mars in Capricorn can act forcefully with cold-blooded authority - less hot-headed and impulsive, Mars in Capricorn can be ruthless, yet responsible, and take action setting long term goals.

Saturn is sextile Pluto and they, too, are in mutual reception - because Scorpio is ruled by both Mars and Pluto. Planets in mutual reception reside in each other's ruling signs. They are like welcome VIP guests in each others houses. Via mutual reception they have the means and liberty to make themselves "at home", but because they are dignified guests in each others homes, they often display their better nature.

Saturn on the Ascendant of this chart elevates Saturn's power and authority. Saturn represents authority and the people in government in those positions, while Pluto wields incredible influence and power in the money house - both planets deal with control principles, though Pluto is more about using force to influence or gain control. These two planets together can use their energy to change things immeasurably - for Good or for Bad.

Saturn, on the Ascendant, in the 12th is read as if in the first house. - Though the real work between the Democratic president and the speaker of the Republican-led House is an on-going, 12th house behind- the- scenes venture, Saturn's influence in the first house is powerful. However, even a well positioned and well aspected Saturn makes it tough to get good results. In the best of all interpretations, this position can produce a steady progressive attitude among the people, supporting the President's position on the budget talks; but truthfully, it rarely is beneficial for Saturn to be placed here.

The New Moon in Sagittarius in the Second House. The New Moon in the second deals with "what is valued" and focuses on material possessions. It has special reference in this mundane chart to the financial condition of the stock exchange. Not only is the New Moon there, but Pluto is there.

Click to read this article in full on the astrologicalinvesting.com web site.  Read the interpretation of the planets in houses, the Moon phases section and get the "Head's Up" - upcoming astrological events list.

Trines,
Marley

Sunday, December 9, 2012

Warning signs in India's Nifty index

Randall Ashbourne, an associate of Astrological Investing, posts a weekly market report on his web site, theidiotandthemoon.com The following is this weekend's Eye of RA report: Week beginning December 10, 2012
We'll take a look this weekend at only a couple of indices, discussing the potential for an end to the range trading in the SP500 and a warning signal in the Nifty 50.

For over a week, Wall Street's Pollyanna index has been trapped in a narrow range from 1400 to 1420.

On Friday, the Dow Industrials made a break northwards, while the Nasdaq 100 declined and the 500 held its ground.

We're likely to see the action pick up in the coming week as the mood turns increasingly Sagittarian. Mercury makes the sign change on Monday, the Moon goes into Sagittarius on Tuesday, and Venus also shifts into the sign next weekend.

Sagittarius symbolises adventure and optimism. In personal astrology, any planet you have in Sadge indicates the area of life where you really stretch yourself. And, as a general rule of thumb, it's that adventure and optimism which normally brings on the Santa Claus rally at this time of year.

However, the rules change a little when interpreting the astrological symbolism for financial markets. What becomes important is the nature of Jupiter's symbolism; above all, the FatBoy's ability to exaggerate.

Because what sometimes happens is that instead of a boundless, happy-go-lucky attitude, what gets exaggerated is the fear factor.

There are a couple of other significant moves this coming week - a New Moon on Thursday (USA time) and Uranus going Direct. There's some conflict between those two ... since New Moons tend to occur near short-term market highs, while Uranus changing from Retrograde motion to Direct most often suggests a multi-week rally.

Let's take a quick look at the historical performance.

click to view larger image

In the chart above, the Uranus Direct moves are marked with red bars. Of the past 7 instances, only one coincided with a drop ... and that was short-lived. Even during the 2007/2009 market freefall, the Uranus Direct stations marked the start of multi-week rallies.

From a big picture perspective, the 500 remains in a multi-year uptrend - currently finding Support at the central tyne of a pitchfork anchored at the multi-year highs and lows.

click to view larger image

The long-term uptrend continues to weaken - and it is possible the final high of this Bull run was put in place 4 months ago. We've discussed in the past what appears to be an Ending Diagonal topping structure.

However, it's still possible the last rally has not yet been seen ... the one that gives us a new high, but with a distinctly lower high in the long-range oscillator (the blue line in the lower panel).

click to view larger image

There is no clear-cut negative divergence yet in that line - divergence which was very obvious at the 2007 top. However, the green (fast) and red (medium) oscillators have been signalling trouble for some time, maintaining their position below the blue line, which is the opposite of what one wants to see for continuing price rally mode.

And it may be that a head-and-shoulders topping pattern is now in the process of forming its right shoulder.

click to view larger image

The importance of the trend channel and the three black horizontal Support/Resistance levels in the chart above are obvious. Also obvious is Pollyanna's need to break above the highest of the horizontal barriers if the market is to negate the H&S pattern.

Last weekend, I published planetary charts for major world indices in a bid to set the probable target levels for the rest of the year and you can consult those charts in the Archives if you missed it.

India's Nifty, which broke out strongly the previous week, is now bumping against overhead resistance. First, let's look at the daily version.

click to view larger image

That negative divergence is also showing up in the Nifty's Weekly Planets chart, where the warning signs are amplified by the weakness of the MACD histogram.
click to view larger image


Safe trading - RA

Randall Ashbourne
Astrological Investing's associate, Randall Ashbourne, author of the eBook, The Idiot and The Moon, writes a free weekly column titled, The Eye of Ra on his web site in  which he explains the potential impact of astrological aspects and the current state of technical conditions. Ashbourne's charts are revealing illustrations of exactly what has occurred in the market and the probability of what to expect.
Important reading:  Randall Ashbourne's article, Jupiter's cycle and its effects on Wall Street and a posting of the weekly Eye of Ra report in this blog, titled A look at the Venus Retrograde effect
(Disclaimer: This article is not advice or a recommendation to trade stocks; it is merely educational material.)
Copyright: Randall Ashbourne - 2011-2012

Saturday, December 1, 2012

December ranges for world indices

Randall Ashbourne, an associate of Astrological Investing, posts a weekly market report on his web site, theidiotandthemoon.com The following is this weekend's Eye of RA report: Week beginning December 3, 2012
We'll spend our time this weekend looking at the price targets likely to turn major stock indices during the final month of the year.

It was an exercise we went through at the beginning of November and I think it was probably worthwhile.

Astrologically, there are only a couple of significant aspects over the next couple of weeks - beginning with a Sun opposition to Jupiter at the start of this week.

We'll take a look at the historical impact of that aspect - a once-a-year event - in a few moments. The only other major aspect is next week, when Uranus reverses and moves to Direct motion again. For the remainder of the month, these weekly reports will be brief while I do some overhauling of the website and produce a Forecast 2013 report likely to be available in early January.

For the moment, a personal digression. Those of you with a working knowledge of astrology will understand when I say my November 2011 Solar Return chart had the Sun in the 4th house ... so, naturally, I've spent most of my energy in the past year building myself a new home.

This year's SR chart puts the Sun conjunct the Ascendant ... which indicates I'll concentrate in the coming year on putting more of myself "Out There".

As it happens, the shift of the Solar Return Sun into angular - action - houses, coincides with the end of a very l-o-n-g transit of Saturn through the first quadrant of my natal chart; what Grant Lewi called "the obscure sector" and which represents a timespan during which it can be difficult for an individual to make outward progress.

I won't dwell on this, since I know most of you have only a passing interest in the Spooky Stuff. In a nutshell, there are a couple of longish periods in life where one tends to withdraw from the outer world ... for rebuilding the base of the personality, personal finances, one's thought patterns and education ... and one's home base.

When it's over, one becomes revitalised and ready to venture forth again. So, over the course of the next year, I'll have more time and energy to devote to these pages and to start making changes. I hope you stick around!

Now, enough of the personal stuff ... let's get down to business.

The week kicks off with the Sun making at opposition from Sagittarius to Jupiter in its Detriment sign of Gemini. Sun in Sadge is usually the time of year when optimism reigns and we get the annual Santa Claus rally. This year, though, it begins with Jupiter in Gemini, the sign in which there's usually more talk than action.

Our first chart this week looks at the historical behaviour of Pollyanna, the SP500, following Sun-Jupiter oppositions.
click to view larger image

These aspects have a general tendency to occur nearby an intermediate trend change. Of the 12 previous aspects marked on the chart with red bars, 7 or 8 of them happened very near temporary tops, 3 of them very near temporary bottoms, and only a couple of them midway through a move.

In the last Bull run from 2002 to 2007, three of the four Sun-Jupiter oppositions marked out a temporary topping zone. That happened only once during the current Bull recovery.

However, we can see from an eyeball view that Sun-Jupiter aspects have a more reliable tendency to change market direction than the much-vaunted, but ultimately misleading, Mars-Uranus aspects. And that when there is a change, it tends to be in effect for several weeks.

Now, there's a chance this week's aspect will do not much of anything. However, since it's the only significant astrological aspect in play for the next couple of weeks, we need to consider that it's an historically strong aspect playing in an otherwise unaspected field.

So, we'll now go through the planetary price charts for a broad range of indices to get some idea of the probable upside and downside targets for the remainder of the year.

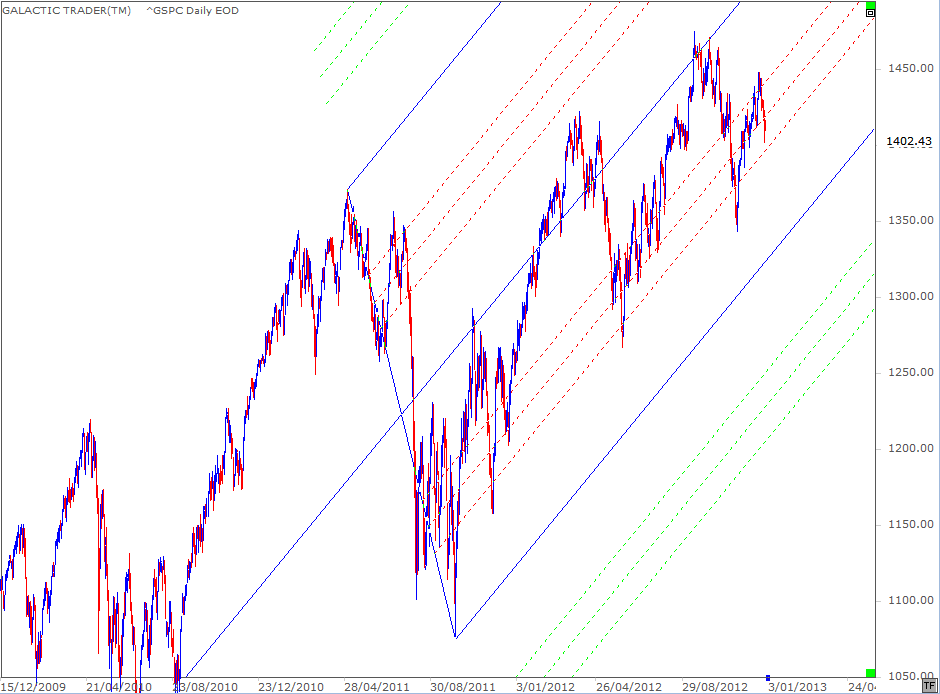
We'll begin with Miss Polly, Wall Street's broad-based 500 index.
click to view larger image

We went through this exercise at the beginning of November, a month affected by the gyrations of a Mercury Rx phase. Ultimately, though, the long-range planetary price lines contained most of the month's action and it would have been highly profitable to Enter and Exit positions at the 1410ish Neptune level and the 1358 Pluto line.

There seems to be two ways to play December. If 1412 holds and we get a Santa rally, the obvious targets are the previous Highs ... or a fast run into the 1500s.

If the Sun-Jupiter aspect represents a peak of optimism and a downturn develops, the downside targets are equally obvious.

Next, we'll look at the Nasdaq 100.
click to view larger image

What is significant with this chart is the degree of negative divergence in the fast MACD. I don't rule out the possibility of a new High. I think The Technical Section of The Idiot & The Moon points out that three instances of divergence are often necessary in the MACD before a major trend change in price actually takes place.

What is obvious above is that the last price high came with a lower peak in both the MACD signal lines and histogram ... and that the higher low was recorded with a deeper trough in the MACD signal. In brief, the internal momentum within the tech stocks is getting weaker.

Turning to Europe, we'll start with Germany's DAX, the strongest of the main indices.
click to view larger image

Prices on the DAX remain contained within the same planetary price zone which capped the 2011 Highs. Uranus lines are marked in orange and a close study of the history of the weekly bars makes their impact rather obvious. It would need a very decisive weekly close above 7500 to set up the DAX for a merry Christmas.

Next we go to London's FTSE.

It, too, has been rangebound for many weeks, broadly within the range which marked out the 2011 topping pattern. Again, the prices at which one could consider initiating or exiting a trade, in either direction, are obvious.

Moving to Mumbai ...
click to view larger image

India's Nifty 50 has been playing sideways shuffle in the 5600s for the past few months ... and the strong breakout northwards comes with a very indifferent attitude from the MACD.

Singapore is next ...
click to view larger image

Make note of the grey lines on the STI's chart - Neptune - and notice the clustering which took place at the 2010 tops and at both sets of 2012 sideways shuffles. It means the final target for any sustained rally is about 10% higher than last week's close ... with a stalling process likely in the early 3200s.

On the downside, the strongest Support doesn't come into play until the 2700s.

Honkers ...
click to view larger image

Obviously, the most important current line for the Hang Seng is the primary Saturn line, whose price is around the level of last week's Low. Again, the MACD signal is weakening, though not yet to the point where the signal lines have crossed to negative mode. Shanghai ...
click to view larger image

The last time we looked at Shanghai, the index was trying to recover above the primary Saturn line (currently priced at 2170) ... and with some degree of positive divergence in the state of the long-range Canary. Nevertheless, the attempt to recover the ground has failed, though the potential turnaround divergence is still building in the oscillator.

And, finally, Auntie - the ASX200 ...
click to view larger image

The significance of the current orange Uranus price zone is obvious from past performance ... Support during 2009, 2010 and 2011, turning into Resistance during the recovery from the August/October plunge of 2011. If the old bat can decisively break above 4546, she has the potential to run to almost 4800. Decisive failure of the 4453 level, means the drop is unlikely to stop this time above 4200.

My apologies to Canadian readers. I'm still having trouble with TSX data. I know Google Finance has it; I'm just having a great deal of trouble converting it to a format the software likes! Playing with spreadsheet formulae is not, y'know, a Sagittarian strong point ... even if the Sadge in question does have a prissy and practical Virgo Moon!

Okay, that's a wrap. Please keep note of this weekend's edition, since I intend going into "lite" mode for the rest of the month so I can spend some time working on next year's Forecast and plans for an overhaul of some parts of the website.

Hopefully, the Forecast will be ready by the first week of January. I'll keep you briefed on the details late in the month.

Safe trading - RA

Randall Ashbourne
Astrological Investing's associate, Randall Ashbourne, author of the eBook, The Idiot and The Moon, writes a free weekly column titled, The Eye of Ra on his web site in  which he explains the potential impact of astrological aspects and the current state of technical conditions. Ashbourne's charts are revealing illustrations of exactly what has occurred in the market and the probability of what to expect.
Important reading:  Randall Ashbourne's article, Jupiter's cycle and its effects on Wall Street and a posting of the weekly Eye of Ra report in this blog, titled A look at the Venus Retrograde effect
(Disclaimer: This article is not advice or a recommendation to trade stocks; it is merely educational material.)
Copyright: Randall Ashbourne - 2011-2012