Friday, February 28, 2014

March 2014, Astrological Calendar - Transits for NY NY, The NYSE

Astrology calendar showing the day and times of planetary aspects for the NYSE, for the month of March, 2014.
March 2014,  Astrological Calendar - Transits for NY NY, The NYSE
Click to view larger image
Using locational transiting aspects is critical in market timing.  Have these calendars BEFORE they are posted each month.

Calendars come complete as full 13-month calendars January 1, 2014 through January 31, 2015.

 There are three separate 13-month calendars -  transit to transit aspects for the NYSE, FTSE, and ASX.

Download these handy PDF calendars to your iPad, or other electronic reader and/or and phone, and of course, to your computer to read. (They are printable as well.)

Included are transit to transit aspects; dates of Moon Phases, Planets Stationing (changing directions) and Eclipses; and a schedule of open hours and days for each market, New York, London, and Australia.

These calendars can be purchased individually for $8.00, but all three are available for $16.00 Click to purchase.

March 2014 Astrological Calendar - Transits for London, England, The FTSE

Astrological Calendar showing the day and times of planetary aspects for the FTSE, for the month of March, 2014.
March 2014  Astrological Calendar - Transits for London, England, The FTSE
Click to view larger image
Using locational transiting aspects is critical in market timing.  Have these calendars BEFORE they are posted each month.

Calendars come complete as full 13-month calendars January 1, 2014 through January 31, 2015.


 There are three separate 13-month calendars -  transit to transit aspects for the NYSE, FTSE, and ASX.

Download these handy PDF calendars to your iPad, or other electronic reader and/or and phone, and of course, to your computer to read. (They are printable as well.)

Included are transit to transit aspects; dates of Moon Phases, Planets Stationing (changing directions) and Eclipses; and a schedule of open hours and days for each market, New York, London, and Australia.

These calendars can be purchased individually for $8.00, but all three are available for $16.00 Click to purchase.

March 2014 Astrological Calendar - Transits for Sydney, Australia, The ASX

Astrology calendar showing the day and times of planetary aspects for the ASX, for the month of March, 2014.
March 2014  Astrological Calendar - Transits for Sydney, Australia, The ASX
Click to view larger image

Using locational transiting aspects is critical in market timing.  Have these calendars BEFORE they are posted each month.

Calendars come complete as full 13-month calendars January 1, 2014 through January 31, 2015.


 There are three separate 13-month calendars -  transit to transit aspects for the NYSE, FTSE, and ASX.

Download these handy PDF calendars to your iPad, or other electronic reader and/or and phone, and of course, to your computer to read. (They are printable as well.)

Included are transit to transit aspects; dates of Moon Phases, Planets Stationing (changing directions) and Eclipses; and a schedule of open hours and days for each market, New York, London, and Australia.

These calendars can be purchased individually for $8.00, but all three are available for $16.00 Click to purchase.

Saturday, February 22, 2014

Caution: FatBoy squares el Weirdo

Randall Ashbourne, an associate of Astrological Investing, posts a weekly market report on his web site, theidiotandthemoon.com The following is this weekend's Eye of RA report: Week beginning February 24, 2014 
The head honcho of the Old Gods, Jupiter, makes the second exact square with Uranus in the next few days.

Jupiter rules growth, expansion, optimism and Uranus rules technology in general and the stock markets in particular.

Every major astrological aspect between these two almost invariably causes a significant turn in the direction of the markets.

We'll take a look at the history in a moment.

Other stuff is also happening this week. Late in the week, the little mischief-maker, Mercury, goes Direct again as the Sun trines Jupiter (adding extra power to the Jupiter-Uranus square).

It's a weekly version of the Bi-BB charts we've been using for the past few weeks to track the potential for fast moves in short-term trends.

Let's begin, though, with an overview of the big astrological picture. We've chatted at length over the past couple of years about the long-running square between Uranus and Pluto and how these are always present when big, worldwide social shifts are underway.

I won't bore you - or me - by reiterating the symbolism now; other than to say that the "time" when we see actual events occur tends to arrive when that long-running square is triggered by a third planet making an aspect to Uranus or Pluto.

Enter the FatBoy. The chart below is a long-range monthly of Pollyanna, the SP500. Jupiter conjunctions to Uranus are marked with blue bars, trines with green bars, and the squares with red bars.

And all three tend to have a BIG impact. Jupiter lurvs BIG. Study the chart for a few minutes. It's almost uncanny just how often strong Jupiter-Uranus aspects show up as Pollyanna is peaking into long-range tops ... 1968, 1973, 1983, 1987, 2000, 2007. And 2014??

Okay, that's enough of The Spooky Stuff for this week. My Virgo Moon, Miss Prissy, will throw a hissy-fit if I don't pack away the crystal ball and start showing some technical stuff. "Do try to be practical, dear!" So, anyway. For the past few weekends, we've been exploring how to use some lessons from The Technical Section of the book to work out how we should trade some Bi-BB signatures when they make an obvious appearance in the charts. It's all in the Archives. Firstly, let's review last edition's warning about how gold was probably about to take a breather because it had broken the upside band. And ... lo and behold ... that's exactly what we got, at least for a couple of days.

In the longer-term, gold looks to have a lot more rally to come. For the moment, though, I'm just using this as another example of how to apply techniques from The Technical Section to real markets in real time.

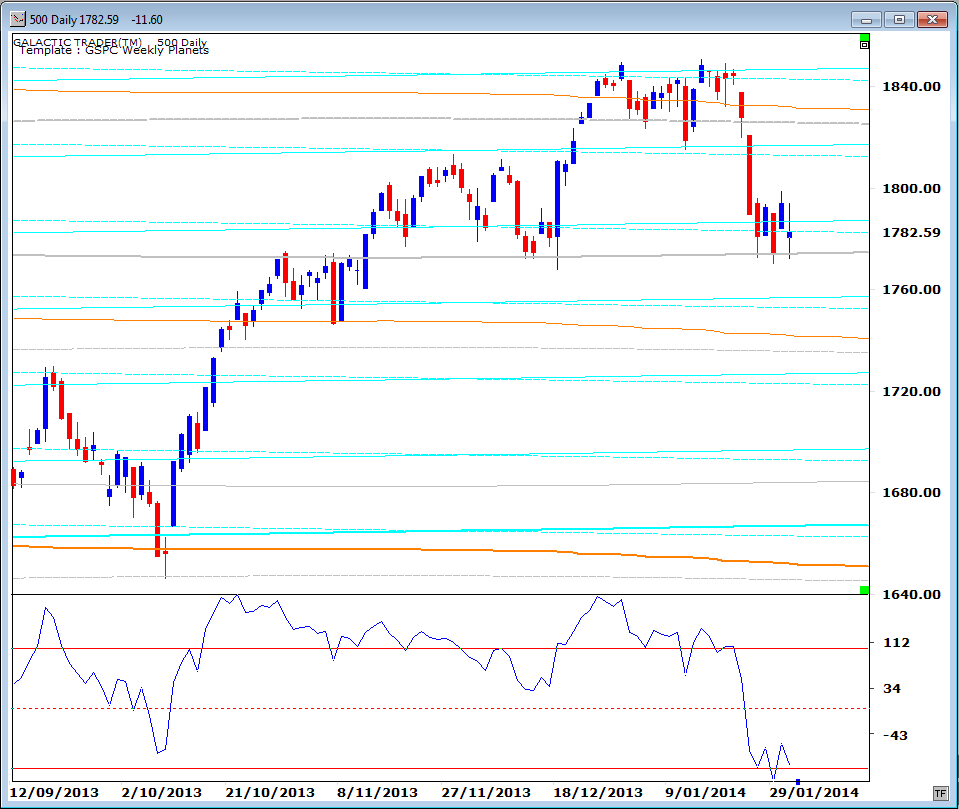
Because, while we saw how we could apply these trading rules to both Pollyanna and gold in the daily charts, we are starting to see a similar situation develop now in Pollyanna's weekly Bi-BB chart.

Notice how the bands are starting to pinch together. And remember the first rule ... a rapid tightening of the BBs is a warning that a fast move is approaching. In this case, because it's a weekly chart, the move will probably be of intermediate length, rather than short-term.

I also indicated last weekend that if the rally continued, rather than changing direction at the midpoint of the Mercury Rx phase, the maximum price Pollyanna would hit would be the 1860s.

Since we're in the statistically-positive period between 3Q and New Moon ... and with the Sun due to trine Jupiter ... 1864 remains a valid target for the coming week.

But first, it would have to overcome a Weekly Planets barrier - a double Saturn zone which stopped the two previous attempts to break northwards.

And our Big Bird oscillator is, so far, distinctly unhappy with this testing of the previous Highs!

Also, we've been discussing how the SP500 is currently trapped between rising and falling primary planet lines belonging to the Sun, Mercury and Venus.

Mercury is the two sets of pink lines and Miss Polly played with the falling Mercury line all last week.

Now, let's swap hemispheres for a look at my home market, Australia. The ASX 200 closed the previous week with a break above a Weekly Planets Saturn barrier in the early 5330s ... and is trying to reach the next Saturn/Uranus zone between 5466 and 5504.

We have 3 Canaries in the oscillator panel - 6, 14 and 50 CCIs. The most important is the 50 - Big Bird - which is suggesting one of those prices should be hit.

The green oscillator is the 6 - Fast Bird; and the red is the 14 - Medium Bird. It is already rolling over, suggesting the end of this rally is now very close.

And there's a technical validation for that, too. Below is Auntie's long-range monthly showing Fibonacci Retracement levels; red for the Bull run from the early 2000s into the 2007 top and blue for the Bear collapse into 2009.

It's fairly obvious from even a quick look just how important one or the other of these FiboRx levels have been during the past 5 years.

Short story: Auntie is AT strong resistance and the long-range Big Bird is distinctly unhappy. Now, we have been waiting for EXACTLY this technical condition to start showing up ... higher price Highs with a lower Big Bird high! Negative divergence - on a long-range, monthly chart, warning that the Bull is getting ready to morph into a Bear.

We're not about to wave our arms around and call Abracadabra! just yet. A breakout could rush Auntie up another 400 points (and perhaps worsen the Big Bird divergence in doing it).

But, but ... start putting these technical conditions together with the track record of the FatBoy making aspects with the Weirdo and we see why it's finally nearing time to be very, very cautious.

Safe trading - RA
Randall Ashbourne
Astrological Investing's associate, Randall Ashbourne, author of the eBook, The Idiot and The Moon, and The Idiot and the Moon, Forecast 2014, writes a free weekly column titled, The Eye of Ra on his web site in  which he explains the potential impact of astrological aspects and the current state of technical conditions. Ashbourne's charts are revealing illustrations of exactly what has occurred in the market and the probability of what to expect.
Important reading:  Randall Ashbourne's The Idiot and The Moon, Forecast 2014
(Disclaimer: This article is not advice or a recommendation to trade stocks; it is merely educational material.)
Copyright: Randall Ashbourne - 2011-2014

Sunday, February 16, 2014

More on Bi-BB trading rules ... and gold

Randall Ashbourne, an associate of Astrological Investing, posts a weekly market report on his web site, theidiotandthemoon.com The following is this weekend's Eye of RA report: Week beginning February 17, 2014 
Less than 8 weeks ago, most of the stock market "experts" were predicting another rip-roaring year ahead.

Then, along came January and they were falling over each other to lament the start of "the big one".

And on Friday, the Nasdaq 100 hit new highs and the SP500 was in gushing Pollyanna mode, finishing the week only a half per cent away from its all-time high in mid-January.

As I've been saying ... the series of retrogrades involving Venus, Mercury and Mars is likely to cause confusion early in 2014.

American markets will be closed on Monday and we need to be aware that traders will return from the long weekend with a potential rethink.

Monday is the midpoint of the current Mercury Retrograde phase and there is at least some danger that trends which began at the start of the phase will go into reverse halfway through the cycle.

Unusually, stocks and gold prices have been running strongly in the same direction.

But the same mechanism we began discussing a couple of weekends ago to look for a potential turn in stocks, is now giving signals that gold's rise is nearing a "breather" stage.

Let's begin, though, with Pollyanna. We've been using the past few weeks as a real-time example of how to use the Bi-BBs when they show a particular pattern.

To reiterate:


1. Tightening bands warn of a very fast move

2. A break of the outer bands stalls the move or forces a countertrend

3. The first move is usually in the wrong direction

So, let's take a look at where we currently stand in relation to those signals. The extreme tightening provoked the fast move down and the breaking of the outside bands first caused a stall and the second break launched a strong countertrend ... indicating that the first move was in the "wrong" direction.

Now, if it were not for the astrological expectation that the midpoint of the Mercury Rx phase can reverse the trend in play, I'd tend to lean here towards Pollyanna gushing to new highs.

We do have a rule that astrological expectations do not over-ride technical conditions. The significance of that is the new, higher peaks in the MACD histogram strongly suggest this isn't going into a sudden reversal.

But, the index is hitting planetary resistance. As we discussed last weekend, the 500 is within a price zone where uptrending and downtrending primary planet lines intersect. If the rally continues when traders return on Tuesday, the maximum price likely to be reached in the week ahead is around the 1860s.

A reversal would probably take the index back to the 1760s over the next couple of weeks.

Gold is now showing some sparkle, indicating it is possible that the correction ended with the double-bottom recorded in late December.

But, is it too much, too fast? If the "normal" rules of Bi-BB trading hold true, then yes. The upside outer band has been broken decisively ... so there's a strong chance that price will stall, or change direction.

The last minor break of the upside band, on January 26, provoked a 5-day pullback.

However, we are now getting strong signals that gold may well be in the early stages of a new Bull leg which will, eventually, take out the old highs.

We last looked at gold in any depth in the January 20 edition, which you can access in the Archives. At the time I indicated I'd prepare a special report on gold. I've been waiting for this sort of move to occur. I'll wait a little longer to see the reaction to make sure that report is as useful as it can be.

However, the potential for future profits in gold itself, and the miners, is starting to look very good. Two things to take special note of in the Sun-Pluto chart below ...

Firstly, our Big Bird oscillator couldn't be happier. The canary is trilling like a lark. And secondly, price has escaped the barrier of a downtrending heliocentric Sun line which put a stop to all attempted breakouts from October 2012 to March 2013.

Everything is looking good - for the intermediate to long-range future. But, we need to see this Sun line breakout tested and confirmed before we can be certain that the final low in gold's correction has been cemented in place.

We're only halfway through the Mercury Retrograde phase ... and a few days after he goes Direct again, Mars goes into a long Rx cycle.
Safe trading - RA
Randall Ashbourne
Astrological Investing's associate, Randall Ashbourne, author of the eBook, The Idiot and The Moon, and The Idiot and the Moon, Forecast 2014, writes a free weekly column titled, The Eye of Ra on his web site in  which he explains the potential impact of astrological aspects and the current state of technical conditions. Ashbourne's charts are revealing illustrations of exactly what has occurred in the market and the probability of what to expect.
Important reading:  Randall Ashbourne's The Idiot and The Moon, Forecast 2014
(Disclaimer: This article is not advice or a recommendation to trade stocks; it is merely educational material.)
Copyright: Randall Ashbourne - 2011-2014

Saturday, February 8, 2014

Dead cat bounce ... or Mercury mischief?

Randall Ashbourne, an associate of Astrological Investing, posts a weekly market report on his web site, theidiotandthemoon.com The following is this weekend's Eye of RA report: Week beginning February 10, 2014 

 I live in an area prone to bushfires ... wildfires ... and we're in for a bad day.

A few have broken out already and we're not near the forecast top of 42C yet.

And despite the heat, I need to leave the windows open as I write this weekend's report ... so I can hear the district fire alarm if it starts wailing.

I can hear the helicopters and water bombers battling the fires not far away. So, I won't be waffling on at inordinate length in this edition.

Okay, last weekend we touched on the topic of Mercury Retrograde and how, often, a trend starts very close to the Rx date and continues until midway through the cycle when it reverses course. And that might be what we now have.

There are also some other astrological aspects coming into play this week. On Tuesday, New York time, the Sun will square Saturn and Venus will be parallel (similar to a conjunction).

At the end of the week, we have the Full Moon, with the Sun making a trine to Mars, and on the following day, the Sun will conjunct Neptune.

Sounds exciting, but it probably won't be.

The strongest aspects - Sun square Saturn and Sun conjunct Neptune - don't have any sort of reliable track record for turning markets. In the chart below, the squares are marked with red bars and the conjunctions with Neptune are marked by blue bars.

All rather dull, really.

So, let's begin this weekend with a return to the main theme from last weekend when I talked about applying the techniques from The Technical Section of The Idiot &The Moon to Bi-BB charts.

If you haven't read it, it's in the Archives. Basically, we had arrived at a situation where the extreme tightening of the Bollinger Bands provoked a strong reaction, which then stalled as price broke the bands.

And I said: "However, the breaking of the band then caused a stall in the (down)trend. Polly didn't go much of anywhere all week long. So, two of the significant "rules" have been met and the only one remaining is ... is the first move in the wrong direction?"

I indicated it "could take a few days" to answer the question. We now appear to have the answer. Monday plunged and broke the bands again ... which prompted another stall ... and then the SP500 launched strongly higher.

So, it's certainly possible that the first move WAS in the wrong direction.

However, I've also been indicating that the series of retrogrades involving Venus, Mercury and Mars are likely to jerk markets around in the first few months of the year.

And it's rarely a good idea to rely on sustained moves of any kind while Mercury is Retrograde. Still, it took the SP500 14 days to drop and by Friday's close, only 3 days to recover just over half the decline.

If this is a first-degree countertrend in an ongoing downtrend, it'll fail in the first couple of days of this week and is unlikely to close above 1825.


There are a couple of specific price levels to watch IF the Sun-Saturn square is going to have an impact. These must be touched within $3 on Tuesday/Wednesday or they're very likely to be completely irrelevant.

A decisive close above 1836 would suggest Polly is off with the pixies again ... a close below 1763 would strongly suggest Pollyanna is morphing into Chicken Little again.


I suspect both price levels just won't be touched when they're relevant.

More interesting is that, long-range, Polly's Bull rally is now in a zone where the uptrend support from rising primary Sun/Mercury/Venus price lines is running into downtrend pressure from falling primary lines involving the same planets.

On the chart below the Sun is light green, Mercury is pink and Venus is dark green. They are primary lines; that is, they're set at the maximum 360 degree width and they intersect with each other only once a year.

And tend, always, to have an impact!

In addition to the fast-moving planets, there are some Outer Planet primaries also very important in this current game ... the grey Neptune around 1825, two Uranus lines at 1809 and 1790, and a Pluto down at 1722.

So, for the moment the 500 is holding to the uptrend primaries ... and is playing, apparently, by the technical rules we apply to squeezed Bollinger Bands.

1. Tightening bands warn of a very fast move

2. A break of the outer bands stalls the move or forces a countertrend

3. The first move is usually in the wrong direction

But, we are in a Merc Rx phase and technical signals are prone to sudden failure. Ray Merriman always says of Merc Rx periods: "Take profits too soon."

It's not at all bad advice.

And now you have a fairly good idea of the precise price levels where you just might want to grab those profits!

Safe trading - RA

(scroll down to view previous editions of The Eye of Ra)

Randall Ashbourne
Astrological Investing's associate, Randall Ashbourne, author of the eBook, The Idiot and The Moon, and The Idiot and the Moon, Forecast 2014, writes a free weekly column titled, The Eye of Ra on his web site in  which he explains the potential impact of astrological aspects and the current state of technical conditions. Ashbourne's charts are revealing illustrations of exactly what has occurred in the market and the probability of what to expect.
Important reading:  Randall Ashbourne's The Idiot and The Moon, Forecast 2014
(Disclaimer: This article is not advice or a recommendation to trade stocks; it is merely educational material.)
Copyright: Randall Ashbourne - 2011-2014

Monday, February 3, 2014

February 2014, Astrological Calendar - Transits for NY NY, The NYSE

Astrology calendar showing the day and times of planetary aspects for the NYSE, for the month of February, 2014.
February 2014,  Astrological Calendar - Transits for NY NY, The NYSE
Click to view larger image
Using locational transiting aspects is critical in market timing.  Have these calendars BEFORE they are posted each month.

Calendars come complete as full 13-month calendars January 1, 2014 through January 31, 2015.

 There are three separate 13-month calendars -  transit to transit aspects for the NYSE, FTSE, and ASX.

Download these handy PDF calendars to your iPad, or other electronic reader and/or and phone, and of course, to your computer to read. (They are printable as well.)

Included are transit to transit aspects; dates of Moon Phases, Planets Stationing (changing directions) and Eclipses; and a schedule of open hours and days for each market, New York, London, and Australia.

These calendars can be purchased individually for $8.00, but all three are available for $16.00 Click to purchase.

February 2014 Astrological Calendar - Transits for London, England, The FTSE

Astrological Calendar showing the day and times of planetary aspects for the FTSE, for the month of February, 2014.
February 2014  Astrological Calendar - Transits for London, England, The FTSE
Click to view larger image
Using locational transiting aspects is critical in market timing.  Have these calendars BEFORE they are posted each month.

Calendars come complete as full 13-month calendars January 1, 2014 through January 31, 2015.


 There are three separate 13-month calendars -  transit to transit aspects for the NYSE, FTSE, and ASX.

Download these handy PDF calendars to your iPad, or other electronic reader and/or and phone, and of course, to your computer to read. (They are printable as well.)

Included are transit to transit aspects; dates of Moon Phases, Planets Stationing (changing directions) and Eclipses; and a schedule of open hours and days for each market, New York, London, and Australia.

These calendars can be purchased individually for $8.00, but all three are available for $16.00 Click to purchase.

February 2014 Astrological Calendar - Transits for Sydney, Australia, The ASX

Astrology calendar showing the day and times of planetary aspects for the ASX, for the month of February, 2014. 
FebruaryFebruary 2014  Astrological Calendar - Transits for Sydney, Australia, The ASX
Click to view larger image
Using locational transiting aspects is critical in market timing.  Have these calendars BEFORE they are posted each month.

Calendars come complete as full 13-month calendars January 1, 2014 through January 31, 2015.


 There are three separate 13-month calendars -  transit to transit aspects for the NYSE, FTSE, and ASX.

Download these handy PDF calendars to your iPad, or other electronic reader and/or and phone, and of course, to your computer to read. (They are printable as well.)

Included are transit to transit aspects; dates of Moon Phases, Planets Stationing (changing directions) and Eclipses; and a schedule of open hours and days for each market, New York, London, and Australia.

These calendars can be purchased individually for $8.00, but all three are available for $16.00 Click to purchase.

Sunday, February 2, 2014

As goes January, so goes the year ...

Randall Ashbourne, an associate of Astrological Investing, posts a weekly market report on his web site, theidiotandthemoon.com The following is this weekend's Eye of RA report: Week beginning February 3, 2014

Wall Street loves its pithy little bon mots and has a cliché for every occasion.

This one, about January providing a barometer for the year ahead, has a good chance of turning out to be true.

The real question is When and at What Price the big downturn will come.

As I indicated last weekend, the series of retrogrades involving Venus, Mercury and Mars is likely to cause confusion in the first few months of the year because everyone will be constantly changing direction.

So, Venus ... the money planet ... is now Direct again. Watch for changes in currency trades. I don't "do" Forex, so can't help anyone with those trades.

Later this week, the little mischief maker of the Old Gods, Mercury, goes on one of its regular retrogrades and the usual warnings apply; double-check everything you do BEFORE clicking the Buy or Sell buttons, expect data feeds to go awry and technical signals to fail, and be aware that any trend which starts around the Rx date often has a habit of reversing course halfway through the period (February 6 to 28 - New York timing).

The only other major astrological aspect still in effect is Jupiter's opposition to Pluto, which made the second of three hits last Friday.

We've chatted often about the Jupiter/Sagittarius effect, which is to exaggerate. Usually, it's the optimism; sometimes it's the fear. And we saw a lot of fear take centre stage over the past couple of weeks.

And we've also seen a ramping-up of the sort of social upheaval I talked about again in Forecast 2014, with the threat of civil wars and armed/aggressive rebellion now spreading out of the Arab zone into parts of Europe. With Mars due to go retrograde in the sign of Libra not long after Mercury goes direct again, it's all going to get a lot worse.

But, we're here to talk about the state of the stock markets. Let's begin with a daily Bi-BB of Pollyanna, the SP500. In The Technical Section of The Idiot & The Moon, I make a couple of points about how to use the Bi-BB charts.

One is that a breaking of the bands stalls the trend or provokes a countertrend; and the second is that tightening bands cause a sharp move and that the first move is usually in the wrong direction.

Now, last week's Polly trading is an excellent example of the first of those technical conditions in action ... and at least the first part of the second condition. That is ... the extreme tightening of the bands produced a sharp move ... which broke the downside outer band.

However, the breaking of the band then caused a stall in the (down)trend. Polly didn't go much of anywhere all week long. So, two of the significant "rules" have been met and the only one remaining is ... is the first move in the wrong direction?

It could take a few days to answer that. The fast MACD went into a swan dive after recording negative divergence and even though the state of the histogram is improving, this level of dive usually takes a while to unwind ... as we can see from the earlier instance I marked with a yellow oval.

And the drop stopped at an "obvious" level ... one of Pollyanna's long-range Neptune price lines. We can see this line put up some Resistance to the rally last October and then became important Support in early December. And here we are again.

What is different now, however, is VERY different. Big Bird has dropped off his perch and is squawking horribly. These are Polly's Weekly Planets lines, but with daily price bars. If she holds the line you can calculate the upside Resistance levels; if it fails, the 1750s will probably be the minimum downside target for the coming week.

Let's put the January drop into perspective, though. The Nasdaq tech index has been on a tearaway, finally getting back into the lower end of its infamous bubble top. The new price High has been endorsed by the long-range Big Bird, which also hit a new peak in terms of the recovery rally from the 2009 Bear bottom. I want to stress that part. No negative divergence present from 2009 to 2014.

But! The current Big Bird high is lower than its peak in 2007. This is not ... yet ... a panic scenario.

And it's ditto for the DAX, where Big Bird is in complete agreement that the record highs in the German index are legitimate.

But, unfortunately, not quite ditto for the FTSE which is in danger of triple-topping. And doing so with the first signs of negative divergence in the state of the oscillator, which peaked in May, 2013.

So, it may well be the case that the January barometer does foretell of tough times ahead for the stock markets in 2014 and it is possible it's already underway. But, we won't really know that with any real degree of certainty until we see the personality of the first major bounceback ... and with the lack of any significant divergence in Big Bird on the major indices, we can't rule out the potential for a new high in any of these indices.

I'll leave you with a Weekly Planets chart for the ASX200. Yes, I'm playing favorites. Auntie is a Neptune index and I'm a little surprised it hasn't hit the 5142 level yet. It's certainly possible she can bounce within the Saturn zone, where she's currently getting Support at the 5173 line. Personally, I'd prefer to see a bounce from Neptune ...

Safe trading - RA

(scroll down to view previous editions of The Eye of Ra)

Randall Ashbourne
Astrological Investing's associate, Randall Ashbourne, author of the eBook, The Idiot and The Moon, and The Idiot and the Moon, Forecast 2014, writes a free weekly column titled, The Eye of Ra on his web site in  which he explains the potential impact of astrological aspects and the current state of technical conditions. Ashbourne's charts are revealing illustrations of exactly what has occurred in the market and the probability of what to expect.
Important reading:  Randall Ashbourne's The Idiot and The Moon, Forecast 2014
(Disclaimer: This article is not advice or a recommendation to trade stocks; it is merely educational material.)
Copyright: Randall Ashbourne - 2011-2014