Saturday, May 31, 2014

Major indices close to planetary targets

Randall Ashbourne, an associate of Astrological Investing, posts a weekly market report on his web site, theidiotandthemoon.com  The following is this weekend's Eye of RA report: Week beginning June 2,  2014 

With May out of the way, stock markets enter a five-month period which, statistically, tends to be weak.

Wall Street and London were closed last Monday. But, Big Money never sleeps ... and it poured into Frankfurt and Paris last Sunday evening to engineer opening gaps to set up a positive week for stock prices.

Yes, it was the statistically positive period of the New Moon and also the usually positive period going into the monthly changeover.

Nevertheless, it managed to get the SP500 out of its trading range and the DAX very close to an important, long-range planetary level we've been assuming "should" be hit.

We'll have a look at charts for the 500, the DAX, the FTSE, the CAC, the Nifty, Singapore and Australia this weekend.

And gold. Yes, that's an egg you see splattered all over my face. GeeZeus, what an unattractive look. The pressure was building for a fast move ... just not in the direction I was expecting it would go.

It could be a Bear trap which suddenly reverses. But, we'll look at that, too.

Astrologically, there are a couple of significant events ahead for June. Mercury goes Retrograde again next weekend and now that Mars is moving direct again, it will set off the Uranus/Pluto square again.

Let's start with Pollyanna, the SP500. We were watching for a decisive close last Wednesday above or below one of the two price levels I showed last weekend for the Sun square Neptune aspect.

As we can see, this set up what is normally a certain play. Tuesday's open gapped upwards, hitting the Neptune price level. Wednesday made a little bounce above the line to touch the falling Sun line and the day ended below the price level of the aspect. This is usually enough to turn the trend, at least temporarily and, often, on an intermediate basis.

Instead, the overnight computers went to work to force a higher open on Thursday, starting the day above the aspect price crossing.

There's a chance it'll turn out to be a false break. I'm not so sure about that ... and not just because of Polly. The DAX, CAC and FTSE are now so close to hitting overhead planetary levels it would be unusual for them not to actually get there before turning south again.

And the 500 also has legitimate higher targets probably now in play. There has been a clear breakout northwards from the long consolidation around the 1870s.

The strong barrier provided by that Pluto line in the 1870s is even more obvious displayed on a weekly bar chart, below. Having spent so long battling against it before breaking out, we probably have to lean towards more upside being on the probable side of possible.

And what was Resistance is very likely to morph into Support during the 500's next correction. Note the gap-up week. Germany was similar and the rise there has put the index within close touching distance of a long-range planetary target in the very early 10,000s. In theory, at least, it'll stall heavily if and when it gets there, just as its 2007 market peak got thumped by a similar planetary line.

And it's getting there with negative divergence starting to show fairly strongly in the oscillator.

The FTSE, too, is now only a tad short of hitting its primary planetary target in the high 6900s.


And Paris is also still reaching for its next level.


India's Nifty made another breakout attempt last week, but backed off ... suggesting it may need to consolidate the Modi bounce within a Uranus/Neptune price cluster zone.

This is actually a primary planet price zone, as indicated by the width of the lines, and should prove to be very strong, given the way the secondary zones neatly contained prices during earlier sideways shuffles.

Singapore is another of the major indices still reaching for major overhead resistance. The recent strength in the Big Bird oscillator indicates the target should be reached.

And Auntie, the ASX 200, picked up her skirts and jumped across the weekly Saturn hurdle ... only to realise it was all too much and that she really needed a Bex and a quiet lie-down to recover from all the excitement. I wouldn't mind, if only the silly old bat had actually touched the damn Uranus level now at 5555 before swooning away.

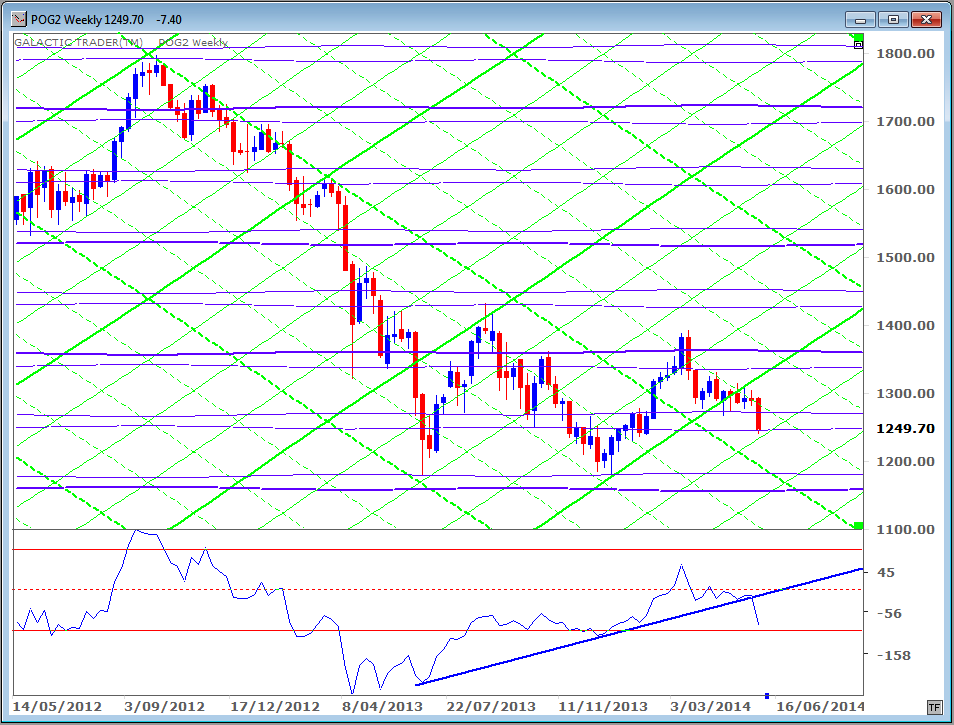
Now, gold. The Memorial Day market was a small-range affair ... and Tuesday went into instant meltdown. Looking at the hourly charts, I have a suspicion the fix was in ... and not just the usual Barclay's "fix".

Nevertheless, it was enough to inflict some major technical damage to the condition of the Big Bird oscillator which instantly croaked and fell of its perch into the toxic dust on the floor.

The sharp drop has brought price down to a horizontal Pluto support and potential help from a rising, secondary Sun line. But, it's not just the daily Big Bird which croaked.

Weekly Big Bird had been climbing very nicely along a rising trendline. No longer. We're at, or close to, potential bounce levels, but will have to see what happens in the next week or two to get a better idea of the intermediate direction.


Randall Ashbourne
Safe trading - RA

Astrological Investing's associate, Randall Ashbourne, author of the eBook, The Idiot and The Moon, and The Idiot and the Moon, Forecast 2014, writes a free weekly column titled, The Eye of Ra on his web site in  which he explains the potential impact of astrological aspects and the current state of technical conditions. Ashbourne's charts are revealing illustrations of exactly what has occurred in the market and the probability of what to expect.
Important reading:  Randall Ashbourne's The Idiot and The Moon, Forecast 2014
(Disclaimer: This article is not advice or a recommendation to trade stocks; it is merely educational material.)
Copyright: Randall Ashbourne - 2011-2014


  Purchase Forecast 2014 and receive a special report on GOLD
 

Friday, May 30, 2014

June 2014, Astrological Calendar - Transits for NY NY, The NYSE

Astrology calendar showing the day and times of planetary aspects for the NYSE, for the month of June, 2014.
Click to view larger image
Using locational transiting aspects is critical in market timing.  Have these calendars BEFORE they are posted each month.

Calendars come complete as full 13-month calendars January 1, 2014 through January 31, 2015.

 There are three separate 13-month calendars -  transit to transit aspects for the NYSE, FTSE, and ASX.

Download these handy PDF calendars to your iPad, or other electronic reader and/or and phone, and of course, to your computer to read. (They are printable as well.)

Included are transit to transit aspects; dates of Moon Phases, Planets Stationing (changing directions) and Eclipses; and a schedule of open hours and days for each market, New York, London, and Australia.

These calendars can be purchased individually for $8.00, but all three are available for $16.00 Click to purchase.

June 2014 Astrological Calendar - Transits for London, England, The FTSE

Astrological Calendar showing the day and times of planetary aspects for the FTSE, for the month of June, 2014.
Click to view larger image

Using locational transiting aspects is critical in market timing.  Have these calendars BEFORE they are posted each month.

Calendars come complete as full 13-month calendars January 1, 2014 through January 31, 2015.

 There are three separate 13-month calendars -  transit to transit aspects for the NYSE, FTSE, and ASX.

Download these handy PDF calendars to your iPad, or other electronic reader and/or and phone, and of course, to your computer to read. (They are printable as well.)

Included are transit to transit aspects; dates of Moon Phases, Planets Stationing (changing directions) and Eclipses; and a schedule of open hours and days for each market, New York, London, and Australia.

These calendars can be purchased individually for $8.00, but all three are available for $16.00 Click to purchase.

June 2014 Astrological Calendar - Transits for Sydney, Australia, The ASX

Astrology calendar showing the day and times of planetary aspects for the ASX, for the month of June, 2014.
Click to view larger image
Using locational transiting aspects is critical in market timing.  Have these calendars BEFORE they are posted each month.

Calendars come complete as full 13-month calendars January 1, 2014 through January 31, 2015.


 There are three separate 13-month calendars -  transit to transit aspects for the NYSE, FTSE, and ASX.

Download these handy PDF calendars to your iPad, or other electronic reader and/or and phone, and of course, to your computer to read. (They are printable as well.)

Included are transit to transit aspects; dates of Moon Phases, Planets Stationing (changing directions) and Eclipses; and a schedule of open hours and days for each market, New York, London, and Australia.

These calendars can be purchased individually for $8.00, but all three are available for $16.00 Click to purchase.

Sunday, May 25, 2014

Gold ... pressure building for a fast move

Randall Ashbourne, an associate of Astrological Investing, posts a weekly market report on his web site, theidiotandthemoon.com  The following is this weekend's Eye of RA report: Week beginning May 26,  2014 

 We'll concentrate this weekend on having another look at the short, medium and long-term charts for gold.

Mars is now back in direct motion and we have just passed the third hit of the sweet spot trine involving Jupiter in Cancer and Saturn in Scorpio.

It didn't take long for the Marshun themes to reveal themselves. Russia and China concluded a deal which will slowly alter the balance of power, economically and militarily, on a global scale.

And in Thailand, the generals finally got fed-up with the political mayhem and staged yet another coup. Thai coups d'etat tend to be relatively well-mannered. I was living in Hua Hin at the time of the previous coup and my next-door neighbour happened to be the guy who got tossed ... Thaksin Shinawatra.

Thaksin kept a very nice villa in the holiday resort, used largely I think so he could change clothes before being driven a few kilometres down the road for an audience with the King, who has made the summer palace his home for many years.

Hua Hin is surrounded by military bases and on the day of that coup, senior officers literally went door-knocking through the town, reassuring foreigners in particular there was no need to be concerned.

Astrologically, there are only a couple of significant events this week - both of them on Wednesday, New York time. We get the Gemini New Moon on the same day as a Sun square to Neptune. It's also the day Venus shifts from Aries into her primary home sign, Taurus.

We looked last weekend at price targets for the SP500 in relation to this weekend's Jupiter-Saturn trine. The Pollyanna index fell short of hitting the nearest target, despite a fairly strong performance for the week.

Since American markets will be closed on Monday, I'm not sure those particular planetary lines will now have the same degree of strength to either turn or accelerate the trend.


There are two relevant price targets, for Polly, for the Sun square Neptune aspect - $1912 and $1867. A fairly precise touch of either, followed very quickly by a change of direction, would suggest an intermediate change of trend is starting.

But, closing decisively through either of the levels - on the day of the aspect - would tend to accelerate the move.


However, it's time we took another close look at the price of gold and its potential impact on gold and silver stocks, many of which seem to have overdone their move to the downside. We'll start with a couple of daily charts.

My Sun-Pluto chart is first. Most of you will be familiar with this. After bouncing off the $1273 Pluto level, price regained a rising primary Sun line. However, for the past couple of weeks it has been on a slow slide down a falling secondary Sun line.


A Bi-BB chart, with Fibonacci Retracement levels, is next. What is interesting is that the gold price appears to have been in a consolidation phase on top of the 50% Rx level. On top of, rather than below, is a sign of strength. The Big Bird oscillator on the chart above and the fast MACD on the Bi-BB chart both hint there is reason to be optimistic about that strength.


So, too, does weekly Big Bird on our next chart. For the moment, it has not breached the trendline. Given the height of the peak Big Bird put in when price made its most recent high in mid-March, I think we could be reasonably sure price will make a higher high on its next move northwards ... probably into the mid-1400s as a minimum.

Our next chart is gold's long-range Sun-Pluto planetary pricing, with only the wide-scale primary lines shown. While price has lost contact with the rising primary Sun line on the daily and weekly charts, the monthly bar is still trying to cling to the rally angle.


It's probably worthwhile now to take a close look at the charts of the various miners, looking specifically for those with a slow build-up of positive divergence in the daily and weekly oscillators.

That's a wrap for this weekend. Before I go, one quick word about my home index, the ASX200. Yes, the old bat ran into trouble yet again at the Saturn barrier on her Weekly Planet charts. Check the chart I published last weekend and amend the prices by about $5 or so for the week ahead.

Randall AshbourneSafe trading - RA

Astrological Investing's associate, Randall Ashbourne, author of the eBook, The Idiot and The Moon, and The Idiot and the Moon, Forecast 2014, writes a free weekly column titled, The Eye of Ra on his web site in  which he explains the potential impact of astrological aspects and the current state of technical conditions. Ashbourne's charts are revealing illustrations of exactly what has occurred in the market and the probability of what to expect.
Important reading:  Randall Ashbourne's The Idiot and The Moon, Forecast 2014
(Disclaimer: This article is not advice or a recommendation to trade stocks; it is merely educational material.)
Copyright: Randall Ashbourne - 2011-2014


  Purchase Forecast 2014 and receive a special report on GOLD
 

Sunday, May 18, 2014

Still waiting ... but not for much longer

Randall Ashbourne, an associate of Astrological Investing, posts a weekly market report on his web site, theidiotandthemoon.com  The following is this weekend's Eye of RA report: Week beginning May 19,  2014 

The world gets its mojo back this week as Mars, the planet which symbolises drive, energy and action, ends its long retrograde in Libra.

And there are two other important events ... the Sun moves out of the luxuriant laziness of Taurus into hyperactive and bipolar Gemini, and Jupiter will make a trine with Saturn.

We will see some changes ... major changes ... especially in conflict zones. 

Mars in Libra is a diplomat and while the planet is going backwards, from a geocentric view, there is a tendency to retreat from direct action and try to rework agreements.

The Sun in Taurus strives for material comfort and, above all, stability and security. In Gemini the mood changes. New snippets of information are seized ... and acted on. So much information, so little time ... rush, rush, rush. This way. No! That way.

And Jupiter trined with Saturn represents a sweet spot, where the forces of optimism and expansion are in easy alliance with those of caution and solid reliability.

Hopefully, it's all finally enough to put a stop to this months-long sideways shuffle. Our first chart this week shows the impact, specifically on the SP500, of Mars going direct (red bars) and Jupiter trined to Saturn (blue bars).

A Jupiter-Saturn trine was in play going into the 2007 market top. By the time of the third hit, the market was already in Bear mode. Some writers are already wondering if stocks have entered the first stage of a stealth Bear.


Next, I want to remind you that Pollyanna, the 500, has a distinct tendency (as do other indices) of moving up and down in Marshun channels.

We can see Polly's prices constantly smooching with Mars planetary price lines throughout this year's sideways shuffle. It's an alternative way of viewing the range-trading we discussed last weekend. Last week, Polly made a real touch of an upside Marshun and started backing down.


Next we can look at the price levels of the Jupiter-Saturn trine due next weekend. The "rules" are that a clear and decisive Close through the price crossings on the day of the aspect suggests the move will continue in the breakthrough direction. Conversely, if the price hits one of the levels and almost immediately changes direction, it tends to mean Price and Time have recorded at least an intermediate Top or Bottom.


So, now we have some specific price targets we need to watch on Pollyanna for this coming Friday, or the following Monday at the latest.

Now we're going to take a look at the three major European indices and India's Nifty to see how they're performing in relation to the predictions contained in Forecast 2014.

Germany's DAX still hasn't touched the expected upside. At the start of the year, it was reaching for the target with no disagreement from the Big Bird oscillator. Since then, however, Big Bird has gone off-key in a fairly major way.

London's FTSE is next, also still falling short of its primary target zone in the high 6900s. Close, but still no cigar.

Paris, at least, has made it into the price zone I predicted it should reach. Forecast 2014 stated: "The historical performance of the index around Pluto price cluster zones still leaves open the potential to reach into the next zone, priced for 2014 in the region from around 4380 to 4600.I find it difficult to believe the index is so weak it can’t reach that zone, especially given the double-testing of the Pluto zone below 2800 at the last two major lows, in 2009 and 2011."


Mumbai's Nifty index is next and, thankfully, it too has performed as predicted in Forecast 2014, where I said: "I’ve inserted a Fibonacci projection … and the Nifty seems to be playing ball with it. If it continues to do so, the index is likely to reach the early 7000s without too much trouble." 


And finally for this edition, a look at the Weekly Planets chart for my home index, the ASX200, which ran into trouble again at a Saturn barrier.


So we have, overall, something of a mixed bag. Polly is keeping direct contact with her Mars channels and France and India have actually made it into the predicted 2014 target zones. Germany and England have not. So far.

To me, the apparent conflict still leaves open the entire question of breakout or breakdown from these many weeks of grinding sideways.

This week's set of astrological aspects might finally give us a real indication of which way it's going to go.


Randall Ashbourne
Safe trading - RA

Astrological Investing's associate, Randall Ashbourne, author of the eBook, The Idiot and The Moon, and The Idiot and the Moon, Forecast 2014, writes a free weekly column titled, The Eye of Ra on his web site in  which he explains the potential impact of astrological aspects and the current state of technical conditions. Ashbourne's charts are revealing illustrations of exactly what has occurred in the market and the probability of what to expect.
Important reading:  Randall Ashbourne's The Idiot and The Moon, Forecast 2014
(Disclaimer: This article is not advice or a recommendation to trade stocks; it is merely educational material.)
Copyright: Randall Ashbourne - 2011-2014


  Purchase Forecast 2014 and receive a special report on GOLD
 

Sunday, May 11, 2014

Still waiting for breakout or breakdown

Randall Ashbourne, an associate of Astrological Investing, posts a weekly market report on his web site, theidiotandthemoon.com  The following is this weekend's Eye of RA report: Week beginning May 12,  2014 

 Major world stock indices shuffled sideways for another week ... and with few clear hints about which way they're likely to break.

Wall Street finished Friday with the headlines gushing about the Dow's record close; which is technically true, but is also pure "spin".

We might start to see a bit more action in the coming week, since Venus is now in Aries and will conjunct Uranus, square Pluto and Jupiter and oppose Mars.

And the following week, Mars will end its unusually long retrograde in Libra.

These Venus aspects and the Mars change of direction will repeat the themes from April and earlier in the year ... and, perhaps, provide enough spark for either a breakout or a breakdown.

I'd thought we might look at some price targets for the Venus aspects, but there is little point with so little movement in most of the major indices. Since Jupiter, Uranus and Pluto have moved little, the price targets will be much the same as those I published a few weeks ago for the Cardinal Grand Square aspects.

Let's begin this weekend with a look at "the all-time record high close" in the Dow Jones Industrials. Yeah. Technically true. But not nearly as exciting as it sounds.

It was marginally higher than the 2013 close for the index. Now into the 5th month of 2014 and the index has gone nowhere.


London's FTSE index has gone nowhere for even longer. It made a high a year ago and has spent most of the time since, shuffling around in a 500 point range.

Most of the other major European indices are in a fairly similar situation.


The primary planets chart for Pollyanna, the SP500, is below. That index remains stuck along primary Pluto at about $1876.


And the ASX 200 performed last week fairly much in line with its Weekly Planets chart, topping just short of the 5494 price level in last weekend's edition.


Okay, so what we have is this ... months of trading within a fairly narrow range. Think of it like a spring being wound tighter and tighter.

When all that pent-up energy is released, markets are going to move hard and fast ... and it could be a very, very expensive mistake to be on the wrong side of the move.


Randall Ashbourne

Safe trading - RA
Astrological Investing's associate, Randall Ashbourne, author of the eBook, The Idiot and The Moon, and The Idiot and the Moon, Forecast 2014, writes a free weekly column titled, The Eye of Ra on his web site in  which he explains the potential impact of astrological aspects and the current state of technical conditions. Ashbourne's charts are revealing illustrations of exactly what has occurred in the market and the probability of what to expect.
Important reading:  Randall Ashbourne's The Idiot and The Moon, Forecast 2014
(Disclaimer: This article is not advice or a recommendation to trade stocks; it is merely educational material.)
Copyright: Randall Ashbourne - 2011-2014


  Purchase Forecast 2014 and receive a special report on GOLD
 

Saturday, May 3, 2014

No Eye ... and almost no I

Randall Ashbourne, an associate of Astrological Investing, posts a weekly market report on his web site, theidiotandthemoon.com  The following is this weekend's Eye of RA report: Week beginning May 5,  2014
This time a week ago I was in a hospital emergency department seldom more than a few racing heartbeats from death.

A whole team of doctors battled continually for hours to stop my heart from exploding, or my lungs from imploding.

I had meant to take my phone to the bedroom that Friday night. I didn't ... and struggled for almost an hour to make it the 15 feet back to my desk when I realised I needed an ambulance urgently.

For the next few hours I was in and out of the emergency resuscitation unit, constantly surrounded by doctors wearing worried looks and asking me just how far I wanted them to go to revive me if my heart stopped or my lungs did.

"If my heart stops, whack it with whatever you've got ... it's strong enough to take it. If my lungs stop, do nothing."

The prospect of "life" hooked to a breathing machine made the choice ... uncomplicated.

To the two officers of the Stirling Ambulance, the entire ED team at the Royal Adelaide Hospital, and the nurses and doctors of Ward S2, please accept my, quite literally, undying gratitude. You saved my life.

So, that's why I wasn't around last weekend, waffling on about markets. At other times from now on, I'll be taking further breaks from weekly reports.

The fact is, folks, there's not much to gain in raging against the dying of the light. Priorities change according to the stage of Life you're currently in ... and there are quite a few of considerably more interest to me than writing about Spooky Stuff or answering emails.

But, but ... we might as well do a bit of that now, since I'm here anyway, eh?

I'll deal with my home market, the ASX, first. A few weeks ago I showed the key levels to watch on the ASX 200 (as well as other indices) as the Mars/Jupiter/Uranus/Pluto Cardinal Grand Square became exact.

Those price levels for Auntie were 5536 or 5263. As we can see on the chart below, the old bat made a precise hit on target and right on time and has been backing away since, despite Wall Street's attempts to continue levitating. In fact, the highest Close was at 5536.10. Ten cents off. Tsk*Tsk.


The implications are that the Australian market is likely to face continuing weakness. It's not absolutely certain, simply because the index ended the week maintaining a tenuous grip on an important technical level ... the 618 Fibonacci Rx level of the post-2009 recovery.


There are two other very important signals from the above chart we must take into consideration. The rally has long fallen outside the main tynes of the rising pitchfork, but continues to respond to the Fibonacci extensions of the fork. This is in stark contrast to the main Wall Street index, the SP500, which we'll look at in a few minutes.

Note also the continuing deterioration in the state of the three main Canaries. The green Fast Bird and the medium Red Bird are negatively stacked against the blue Big Bird, which is also starting to display negative divergence.

The key here is whether the index can maintain its position above that Fibonacci Rx level in the early 5400s. Should the weakness continue, Auntie's Weekly Planets chart probably gives the best guide to the targets likely to provide Support or Resistance.


Now, let's turn our attention to Pollyanna, the SP500. Big Picture first. Just do a quick eyeball of the next chart so you can see how price continues to cling to the middle tyne of the rally pitchfork.

It's a lot stronger than the Australian index. That's probably because we spend our money on a universal healthcare system, rather than allowing the Reserve Bank to spend umpteen billion dollars a month making thieving bankers even richer. Different priorities.


And now that we have the broad overview, we can take a closer look at that chart, where it's easier to see Polly's tenacious grip on that rising central tyne of the fork as price sashays either side of the line like Saturday night dancers at the Belle Star.

We should note that the weekly Big Bird is looking as if he, too, might end up in the emergency resuscitation unit before long.

Still, in terms of primary planet prices, Polly also maintains a grip on the topside of a key, long-range level at 1876. The Fat Lady is still singing.


If there is any hint which way stocks are likely to go in the short-term, it may be in gold's Friday performance. It regained in a day the previous four days' worth of losses.


In terms of the weekly chart, we now have two bars standing tall on their tails after retests of the 1273 horizontal Pluto support as price tries valiantly to cling to the rising Sun line.

Also favouring some muted and cautious optimism about gold's rise is the fact that its Big Bird oscillator maintains a position on the northern side of a rising trendline.


Astrologically, the heavy weather takes a break for most of the coming week. The next major aspect doesn't occur until next weekend when the Sun opposes Saturn.

After that, though, Venus in Aries will do the whole Grand Square routine again.

If I have the time and energy next weekend, I'll try to catch you up with a few of the Euro/Asian indices and we'll look at some price targets for the Venus aspects.

Thank you to those who wrote asking if I was alright after my non-appearance online last weekend. I am ... now. Sort of. I mentioned recently that one needs an accurate birth chart to try to determine if Big Things Happening Out There will have an impact on a particular entity.

Silly old bugger that I am, I managed to totally ignore the fact that the recent Lunar Eclipse Full Moon triggered the angles of my birth chart, that the Solar Eclipse was conjunct my natal Midheaven and that two of the main players in the configuration were stuffing around with the 6th (health) and 12th (hospitalisation).

Luckily, I guess, my natal Jupiter stands permanent guard at the door of my 12th, a guardian angel position, and the transiting FatBoy was happily romping, exalted in Cancer, through my 12th and approaching the Ascendant.

And as much as an unaspected, 5th House Sagittarian Sun guy just loves the FatBoy and regards him as a pal, I gotta tell yuh, Jupie ... I've gotta love those ambos, docs and nurses even more!


Randall Ashbourne

Safe trading - RA
Astrological Investing's associate, Randall Ashbourne, author of the eBook, The Idiot and The Moon, and The Idiot and the Moon, Forecast 2014, writes a free weekly column titled, The Eye of Ra on his web site in  which he explains the potential impact of astrological aspects and the current state of technical conditions. Ashbourne's charts are revealing illustrations of exactly what has occurred in the market and the probability of what to expect.
Important reading:  Randall Ashbourne's The Idiot and The Moon, Forecast 2014
(Disclaimer: This article is not advice or a recommendation to trade stocks; it is merely educational material.)
Copyright: Randall Ashbourne - 2011-2014


  Purchase Forecast 2014 and receive a special report on GOLD