


There is likely to be some relief from the pressure this week as Mars makes a trine with Neptune and the Sun trines Uranus.
The Moon enters Sagittarius on Tuesday and we should probably be prepared for a couple of wide-range days.
The Moon is symbolic of the public mood and Sadge exaggerates either the fear, or the optimism.
As we go into next weekend, both Mercury and the Sun will square Saturn, coinciding with the statistical low period of the Full Moon.
August can be a nasty month for stock prices, as it was in 2007 and again in 2011. But, both of those were spike Lows, with strong bouncebacks.
I indicated last weekend that the Dow Jones Industrials had fired a warning shot and the German DAX looked to be in dive mode, so there was "clear and present danger" in the markets.
It pretty much turned out that way for most of the Western indices, so let's begin this weekend by going back to the DJI chart I said then was really the only stock chart of much importance.
It was then, and remains still, a fairly basic chart with one blue uptrend line and a red horizontal price level. The daily uptrend since the early-February low is now severely broken.
The January slide wiped nearly $1250 off the price of the Dow and the decline last week has taken a $714 bite. Now remember that the high at the end of December and the mid-July high were both listed as major Bradley turn dates.

The other point I want to emphasise about the above chart is the depth to which the Big Bird oscillator has dived ... fractionally lower than it did during the drop at the start of 2014. If normalcy prevails, it's an indication the current drop has further to go.
And I think that's probably endorsed by the next chart, the DJI's weekly, starting with the major Low in 2011. Again, it's a simple chart using just a couple of techniques from The Technical Section of The Idiot & The Moon; I'm really not a fan of complicated charts.
And we have another trendline break. The Dow has closed below the lowest channel marker for the first week since this rally phase started.

I had this chart marked with three important horizontal levels and the DJI finished last week trying to stay on top of the highest of those markers.
But, as with the daily, we have had a long build-up of negative divergence in the Big Bird oscillator. In fact, the 50CCI made its highest peak back in March 2013.
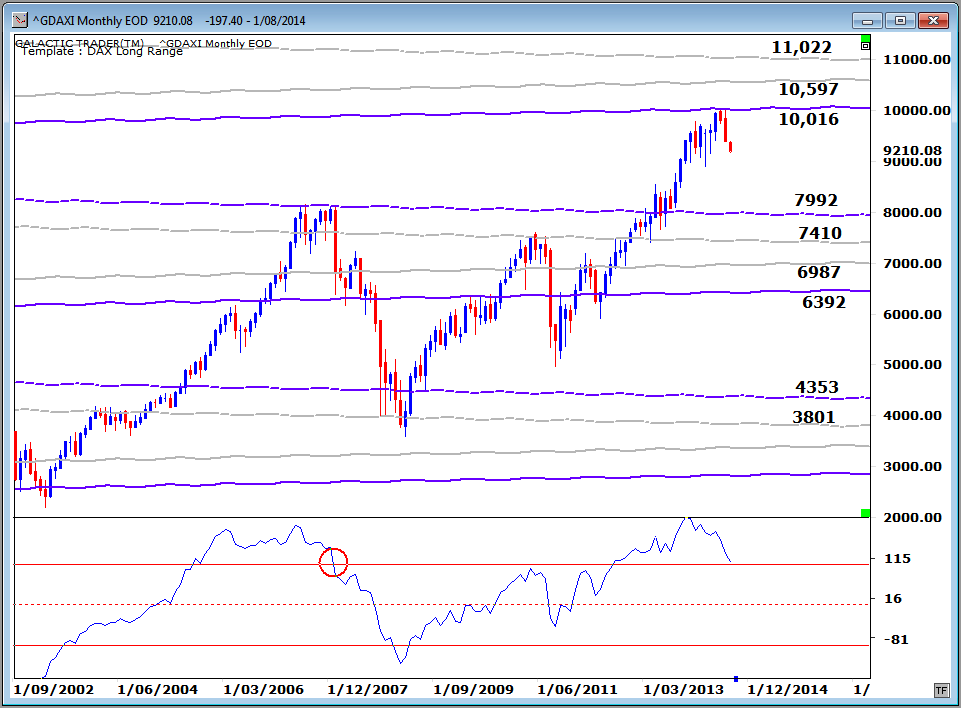
We'll go to Pollyanna's long-range planetary price chart in a moment, but have a quick look at the DAX first. That Pluto level in the early 10,000s clearly provided massive Resistance, just as the lower Pluto level did during formation of the 2007 top in the market.
Monthly Big Bird on the DAX is now getting dangerously close to losing its Bull market status. Once the oscillator loses the top red line in the oscillator panel, we can be pretty sure the big bad Bear is back.
Back to New York now and the current state of the SP500, where Pollyanna swapped her party frock for her Chicken Little outfit. The index has now lost both the Node level at $1957 and the Mars channel line, priced around $1944 for the week ahead.
Remember this is a long-range planetary price chart for the index. On the daily charts, the 500 has dropped into a zone where it could now receive a boost from rising inner planet price lines determined by the Sun, Mercury and Venus.

I didn't show you the ASX200's Weekly Planets chart last weekend, so here's the update. After the breakout above the Saturn/Uranus barrier in the 5560s, Auntie made a dash for the Neptune level in the 5600s ... and then joined the general swoon.
I indicated last weekend that if the breakout is the real deal "the negative period between New Moon and Full Moon should not cause major damage". So far, this isn't major damage. If the index can stay on top of the old Saturn resistance at 5530 by the end of this week, the old bat might just start a multi-hundred point run north.
And if she can't hold, she'll fall into a planetary price hole with no real support until several hunded dollars lower.

Gold. Yeah, yeah. Yada, yada. Waffle. Piffle. Drivel. Look, I don't give a rat's about the daily jerkarounds. One chart. Simple. Price has climbed back into and is consolidating within the upper, lower level of the monthly Bi-BBs. Both the MACD signal line and histograms are climbing. Put in your loss stops to protect your capital and go pour yourself a large gin. Sabbai, sabbai. Tidak apa apa.

Safe trading - RA
 (Disclaimer: This article is not advice or a recommendation to trade stocks; it is merely educational material.)
Copyright: Randall Ashbourne - 2011-2014
Astrological Investing's associate, Randall Ashbourne, author of the eBook, The Idiot and The Moon, and The Idiot and the Moon, Forecast 2014, writes a free weekly column titled, The Eye of Ra on his web site in which he explains the potential impact of astrological aspects and the current state of technical conditions. Ashbourne's charts are revealing illustrations of exactly what has occurred in the market and the probability of what to expect.
Important reading: Randall Ashbourne's The Idiot and The Moon, Forecast 2014
 Purchase Forecast 2014 and receive a special report on GOLD


0 comments:
Post a Comment
Note: Only a member of this blog may post a comment.