Showing posts with label FTSE. Show all posts

Sunday, May 15, 2016

Yogi, Boo Boo, or Gummy - pick a Bear!

Randall Ashbourne, an associate of Astrological Investing, posts reports and articles on his web site at  theidiotandthemoon.com   The following is the Eye of RA report for May 15, 2016 
Since January we've been chatting about a new Bear ... one which rapidly mauled 20% out of some markets, but has been more like a soft-chew gummy bear on the major Wall Street indices.
So, we'll spend some time in this edition of the Eye taking a look at just what sort of Bear we're dealing with.

And whether it's a real Bear, or a Bull that dressed up as one to play mind games with us!

In the last edition, in April, I indicated the potential negative impact of Mars going retrograde, something the planet does every couple of years, but which can be particularly dangerous when it occurs while markets are in a topping phase.

Mercury is also now a little over midway through one of its regular retrograde periods, often a time when prices change course every few days and it's difficult to get an accurate reading on what to expect next.

The Reserve Bank of Australia is the latest of the central banks to cut interest rates and there is talk it, too, is headed to the negative interest rate area.

And there's the problem ... because it makes stocks the only "growth" option.

The desperate search for yield is having different impacts on different markets. We'll begin the analysis with a look at Wall Street's main trading index, the SP500.

In the last edition, I explained the impact of Mars, the planet which symbolises drive and energy, on the price of stock indices and how the 500 (as well as other indices) rises over time very much in-step with the angle of Mars' travels through our solar system. Scroll down to April's blog if you need a refresher.

In our first chart, I'll reiterate the "drive" on a weekly chart. Looking from left-to-right, we can see that almost all of the price action since the last Bear bottom in 2009 has been contained within a rising channel between two Mars price lines placed 360 degrees apart.
There have been three downside breaks of that channel, with Pollyanna recovering each time to claw her way back inside the rising channel. The next chart shows the most recent action and narrows the Mars lines down to 90 degrees, as well as including the falling channels.

The 360 degree channel of the first chart is marked by the thicker red lines in this one and we can see how the 500 has been slowly dropping since Mars went Rx a few weeks ago. It is still trying to cling to the support that channel provides.
And while Mars tends to dictate the angle of rises and falls, it tends to be the price lines of the slower-moving outer planets which set the more horizontal levels of support and resistance. In the February 7 edition, Waiting for the dead cat to bounce, I said: "It is possible a rebound could take price all the way back to the 2080s." The index went a little above the 2087 level for a few days before being repelled by a falling, primary Mercury line (pink). In theory, the rally on Wall Street should be over, done and finished.
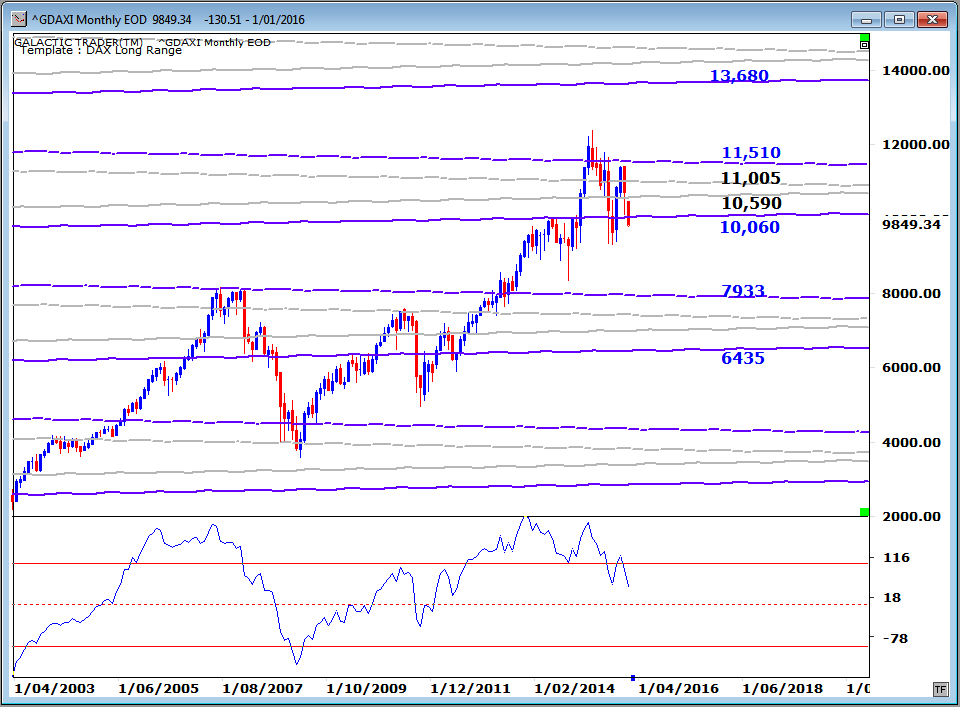
We'll turn now to the top two European indices ... the DAX and the FTSE. Both certainly appear to be well within the grip of a real Bear. The DAX has fallen out of a long-range Pluto/Neptune price cluster and hasn't been able to score a close inside it for the past 5 months.

Its Big Bird oscillator, the 50 CCI, is in Bear mode without even a hint of positive divergence suggesting a sustained rebound.
Instead of using planetary prices for the FTSE we'll use a couple of really simple technical lines ... the rally angle and a black horizonal line of support and resistance.

The FTSE has not closed below that black line, despite the spikes down, for many months. And that's one reason I remain more than a tad cautious about the exact nature of this Bear. The FTSE is finding support on TOP of the line, rather than consolidating below it.
And what makes me cautious is that price is not following the patttern Big Bird established during the 2007-2009 crash. Yes, this Bear also took a huge bite out of the index on its first decline ... but lately has morphed into some sort of gummy bear. Normally, when the oscillator drops but price simply goes sideways, it is a preliminary warning that the oscillator is just readying itself for another rally surge.

And I've been getting the same sense of real caution on the ASX 200. This index slumped more than 20% in 11 months from April last year and Big Bird started a death dive much the same as it did after the previous Bull peak.

But something odd is happening. Big Bird's dive has been constantly stalling, something it did not do during the crash into 2009.
We can also see it in the performance of all three Birds on the weekly chart below. The rebound hasn't been able to climb and stay above the 50% retrace level ... but the performance of the red Medium Bird and the blue Big Bird strongly suggest the index is not finished trying to do exactly that.

The only negative divergence here is in the green Fast Bird, which indicates only short-term resistance.
So, overall, my impression is that we are probably still wrapped in the claws of a very nasty and quite long-range Bear.

But, there are a few caution flags warning us not to get so certain of that as an imminent outcome ... and to be gently aware that Yogi and Boo Boo are taking time out for a picnic!

Safe trading - RA

Randall Ashbourne (Disclaimer: This article is not advice or a recommendation to trade stocks; it is merely educational material.)
Copyright: Randall Ashbourne - 2011-2016


The Idiot and the Moon, eBook, available for purchase

Sunday, January 10, 2016

Danger ... the Bear may be underway

Randall Ashbourne, an associate of Astrological Investing, posts reports and articles on his web site at  theidiotandthemoon.com   The following is this weekend's Eye of RA report: Week beginning January 10, 2016


Last weekend I warned that the alarm bells are screaming very loudly.  (scroll down to read last weeks post,. Beware of the Bear.)

After a week of deep-diving stock markets worldwide, I will review below where we may now be in long-range Elliott Wave terms.

It is possible, Stocks would need to begin bouncing strongly and virtually immediately for that to be true.

The alternative is that virtually all major worldwide stock indices made a long-term Bull market top last year and we are already in the grip of a Bear market which could last at least another year and, if follows the "norm", will wipe out perhaps as much as 50% of your net worth. And possibly more in the Wall Street markets.

The onset of the new Bear is not yet set in concrete. However, it is only a few per cent away and as I said last weekend, it was distinctly possible even before last week's dives, that some markets, such as Australia, are already in its grip. because of major astrological  events last week, that the drop is a head fake.

We will begin this report with an updated look at the broad Elliott Wave roadmap, where Bull markets rise in 5 waves. In Forecast 2015, (still available to download) , I had drawn the red arrow on the left indicating where we were at the start of 2015.

It is possible ... but only just ... that Wall Street still has two more rallies before the current Bull is dead. If that is so, those indices are close to where I have drawn the black arrow.

However, the very real danger is that the top is in and a large-scale meltdown is already underway. If that is the case, we may already be within the early stages of a crash ... the second part of a crash which has been underway for months.

As a rough guide, my best guesstimate would place Wall Street about where the red triangle is positioned. In short, we ALL need to watch the next rally very carefully and be prepared to: Get the Hell Outa Dodge!!


We'll look this weekend at the long-range charts for the FTSE and the DAX. England has slumped back into the price zone marked by the two thin, black horizontal lines.

Its position within that zone needs to be monitored VERY closely, because the Big Bird oscillator certainly looks to be in a death dive.

If you look at what happened during the 2007-2009 Bear market on the left of the chart you have a graphic illustration of what I mean when I say we may already be in the early stages of a crash.

The monthly Idiot is now firmly in Sell mode on Germany's DAX. The blue-line Big Bird oscillator is in deep trouble and so, too, is the red-line Medium Bird, which is clearly warning that more trouble is looming. The green-line Fast Bird is showing some positive divergence, though this will not be settled until the end of the month.

Still, it is giving preliminary notification of a potential bounceback nearby.

Please note in the chart above that the Fast and Medium Bird oscillators are looking suspiciously similar to their behaviour just before the 2008 crash.

Below is the DAX's long-range planetary price chart ... and that's one big hole its price is starting to drop into.

More than at any time in the past few years ...

Safe trading - RA

Randall Ashbourne (Disclaimer: This article is not advice or a recommendation to trade stocks; it is merely educational material.)
Copyright: Randall Ashbourne - 2011-2016


The Idiot and the Moon, eBook, available for purchase

Friday, May 30, 2014

June 2014 Astrological Calendar - Transits for London, England, The FTSE

Astrological Calendar showing the day and times of planetary aspects for the FTSE, for the month of June, 2014.
Click to view larger image

Using locational transiting aspects is critical in market timing.  Have these calendars BEFORE they are posted each month.

Calendars come complete as full 13-month calendars January 1, 2014 through January 31, 2015.

 There are three separate 13-month calendars -  transit to transit aspects for the NYSE, FTSE, and ASX.

Download these handy PDF calendars to your iPad, or other electronic reader and/or and phone, and of course, to your computer to read. (They are printable as well.)

Included are transit to transit aspects; dates of Moon Phases, Planets Stationing (changing directions) and Eclipses; and a schedule of open hours and days for each market, New York, London, and Australia.

These calendars can be purchased individually for $8.00, but all three are available for $16.00 Click to purchase.

Wednesday, April 30, 2014

May 2014 Astrological Calendar - Transits for London, England, The FTSE

Astrological Calendar showing the day and times of planetary aspects for the FTSE, for the month of May, 2014.
May 2014  Astrological Calendar - Transits for London, England, The FTSE
Click to view larger image
Using locational transiting aspects is critical in market timing.  Have these calendars BEFORE they are posted each month.

Calendars come complete as full 13-month calendars January 1, 2014 through January 31, 2015.

 There are three separate 13-month calendars -  transit to transit aspects for the NYSE, FTSE, and ASX.

Download these handy PDF calendars to your iPad, or other electronic reader and/or and phone, and of course, to your computer to read. (They are printable as well.)

Included are transit to transit aspects; dates of Moon Phases, Planets Stationing (changing directions) and Eclipses; and a schedule of open hours and days for each market, New York, London, and Australia.

These calendars can be purchased individually for $8.00, but all three are available for $16.00 Click to purchase.

Monday, March 31, 2014

April 2014 Astrological Calendar - Transits for London, England, The FTSE

Astrological Calendar showing the day and times of planetary aspects for the FTSE, for the month of April, 2014.
April 2014  Astrological Calendar - Transits for London, England, The FTSE
Click to view larger image
Using locational transiting aspects is critical in market timing.  Have these calendars BEFORE they are posted each month.

Calendars come complete as full 13-month calendars January 1, 2014 through January 31, 2015.

 There are three separate 13-month calendars -  transit to transit aspects for the NYSE, FTSE, and ASX.

Download these handy PDF calendars to your iPad, or other electronic reader and/or and phone, and of course, to your computer to read. (They are printable as well.)

Included are transit to transit aspects; dates of Moon Phases, Planets Stationing (changing directions) and Eclipses; and a schedule of open hours and days for each market, New York, London, and Australia.

These calendars can be purchased individually for $8.00, but all three are available for $16.00 Click to purchase.

Saturday, March 8, 2014

Still in search of some certainty

Randall Ashbourne, an associate of Astrological Investing, posts a weekly market report on his web site, theidiotandthemoon.com The following is this weekend's Eye of RA report: Week beginning March 3, 2014 
in search of certainty
Gee,Zeus! It's like trying to herd cats! Some markets are flying north ... others seem to have gone for a long walk on a short pier.

In the USA, the Russell, the 500 and the Nasdaq 100 have again hit new highs ... while the Dow Jones Industrials and Transports continue to lag.

Other markets, as diverse as Argentina, France, Denmark, New Zealand and India all rode to new highs ... while Britain and Germany heard the word "Crimea" and went into a funk.

Maybe they just have a genetic memory that getting involved in that particular piece of land tends not to end well for either of them.

I ended last week's edition with the words: "The next move isn't obvious ... well, it's not to me. I lean more towards a probable decline, but there is a danger in getting married to that expectation. Hopefully, the next few days will provide greater certainty."

I'm really not sure they have provided greater certainty ... not with a few indices going higher and other major ones going lower.

So, we'll go to some charts and try to get some sense of the possible, if not the probable.

The star performer last week was India, Mumbai's Nifty index finally broke free of planetary price resistance clustered near the 6400 level.

It has run into another line of resistance. There are no screeching warning sirens from the oscillator on a weekly basis and if the index can now hold the next minor correction no lower than the early 6400s, much higher prices can be expected.

Somebody mentioned Florence Nightingale and the Charge of the Light Brigade to London's FTSE and the teapots tumbled to the floor.

The FTSE has been having a LOT of trouble getting through these weekly Saturn lines; and there's nothing in the oscillator readings to give a clearcut indication of which way the index will break.

Similarly, the ASX 200 could break either way. Auntie's daily All Planets chart is below. It didn't make a precise touch of either of the light blue Saturn lines last week.

Monday dived and bounced back into a Venus support line; Tuesday couldn't decide whether to breakout above a downtrending Venus; and Wednesday jumped above it.

If the index can clear 5511 decisively in the coming week, new highs are on the cards, since there should be a relatively easy run higher into the 5600/5700s.

Now, let's turn our attention to the Paris Hilton of stock indices ... Miss Pollyanna, the SP500. She finished the previous week with a touch of the Neptune line at 1864 ... dived on Monday ... and went on a tearaway on Tuesday.

These are daily bars on a Weekly Planets chart for the index and a breakout opens a target zone from 1917 to 1932.

It would probably take some good news to get there quickly, however. We've been talking about how the 500's weekly Bollinger Bands had started to tighten. They're now opening wider again ... but with a breach of the upper outer barrier.

We've been discussing Bi-BB trading at some length since early in the year. I've circled each of the Bi-BB breaks on the chart below. Every one of them, even the little ones, either stalled the uptrend, or provoked a correction.

Gold. Now, I haven't forgotten that I did promise to compile a special report. I'll get it done in the next 2 weeks. In the meantime, there is a chance the correction is over and gold is on a new multi-year Bull run.

And the reason I say that is because I'm a silly old bugger who plays with planets. And, as I explained in Forecast 2013, my research tells me the Sun drives gold between Pluto stations.

The thick green lines on the chart below are primary Sun lines. And gold has now completed its fourth week outside the primary channel which constrained almost all of the downside and upside price action since the great drop began in 2011.

Okay, so that was a big picture. Now, let's return to the daily. Short story ... still climbing the Sun line and trying to hold the 1336 Pluto to make a run at a stronger 1363 Pluto.

And ... we're probably about to see a fast move. Remember the lessons from the past few weeks ... tightening bands provoke a fast move and the first move is usually in the wrong direction.


Safe trading - RA
Randall Ashbourne
Astrological Investing's associate, Randall Ashbourne, author of the eBook, The Idiot and The Moon, and The Idiot and the Moon, Forecast 2014, writes a free weekly column titled, The Eye of Ra on his web site in  which he explains the potential impact of astrological aspects and the current state of technical conditions. Ashbourne's charts are revealing illustrations of exactly what has occurred in the market and the probability of what to expect.
Important reading:  Randall Ashbourne's The Idiot and The Moon, Forecast 2014
(Disclaimer: This article is not advice or a recommendation to trade stocks; it is merely educational material.)
Copyright: Randall Ashbourne - 2011-2014

Friday, February 28, 2014

March 2014 Astrological Calendar - Transits for London, England, The FTSE

Astrological Calendar showing the day and times of planetary aspects for the FTSE, for the month of March, 2014.
March 2014  Astrological Calendar - Transits for London, England, The FTSE
Click to view larger image
Using locational transiting aspects is critical in market timing.  Have these calendars BEFORE they are posted each month.

Calendars come complete as full 13-month calendars January 1, 2014 through January 31, 2015.


 There are three separate 13-month calendars -  transit to transit aspects for the NYSE, FTSE, and ASX.

Download these handy PDF calendars to your iPad, or other electronic reader and/or and phone, and of course, to your computer to read. (They are printable as well.)

Included are transit to transit aspects; dates of Moon Phases, Planets Stationing (changing directions) and Eclipses; and a schedule of open hours and days for each market, New York, London, and Australia.

These calendars can be purchased individually for $8.00, but all three are available for $16.00 Click to purchase.

Monday, February 3, 2014

February 2014 Astrological Calendar - Transits for London, England, The FTSE

Astrological Calendar showing the day and times of planetary aspects for the FTSE, for the month of February, 2014.
February 2014  Astrological Calendar - Transits for London, England, The FTSE
Click to view larger image
Using locational transiting aspects is critical in market timing.  Have these calendars BEFORE they are posted each month.

Calendars come complete as full 13-month calendars January 1, 2014 through January 31, 2015.


 There are three separate 13-month calendars -  transit to transit aspects for the NYSE, FTSE, and ASX.

Download these handy PDF calendars to your iPad, or other electronic reader and/or and phone, and of course, to your computer to read. (They are printable as well.)

Included are transit to transit aspects; dates of Moon Phases, Planets Stationing (changing directions) and Eclipses; and a schedule of open hours and days for each market, New York, London, and Australia.

These calendars can be purchased individually for $8.00, but all three are available for $16.00 Click to purchase.

Sunday, January 5, 2014

Happy New Year - and the Forecast is ...

Randall Ashbourne, an associate of Astrological Investing, posts a weekly market report on his web site, theidiotandthemoon.com The following is this weekend's Eye of RA report: Week beginning January , 2013
 Welcome back! We start 2014 with historic levels of unabashed optimism ... in some markets.
Reportedly, the level of margin debt on NYSE stocks is back where it was in 1999/2000.

And the year starts with a major trend change date predicted by the Bradley Model. 

Wall Street launched a strong, year-long rally throughout 2013, apparently repeating the Saturn in Scorpio tendency I outlined in Forecast 2013.

Forecast 2014 is now available for sale and download.

It follows a similar format to last year's, though I have replaced the monthly list of aspects with a Time Map so traders can see at a glance the high-energy days each month likely to spark a reaction in the markets.

There's also an index-by-index guide to how lunar phase trading actually worked out in individual markets last year, confirming where and when the system can be used safely ... and where it should NOT be used! 

 As usual, there's a comprehensive section on the technical condition of the major indices, from a long-range point of view, as well as planetary price charts showing the likely upside and downside targets for stock indices over the course of 2014.

And we pay special attention to the gold price, with a whole series of both technical and planetary charts showing exactly what to watch for and the key price levels likely to be very important to traders in the metal for the year ahead.

The gold section was completed on the last day of trading for 2013 - and we're already seeing a bounce from a major junction of two planetary factors. In fact, gold continues to travel rather precisely to the planetary lines I revealed for the first time in last year's Forecast.

However, we also take a very close look at the technical conditions and what needs to be achieved before the metal can be considered a safe and reliable trade, as opposed to a mere speculative play in the short-term.

The price of the Forecast this year is $24. That's Australian dollars ... and since the Aussie has slipped strongly over the course of the year, that currently translates to about 22 greenbacks!

You should have little trouble getting a lot more than the purchase price back with a single trade on the stock or gold indices or ETFs.

As an example of what to expect, I'll tempt you with just one of the charts from the Forecast ... how the FTSE performed during The Moods of The Moon during 2013.


The table shows the performance of the FTSE from the first New Moon of December 2012 into the New Moon of December 2013. The index itself rose 10.17% during those dates.

Going Long for the two weeks between Full Moon and New Moon each month produced an overall profit of 10.43%, despite three periods of rather substantial losses.

And as a "system", the overall profit on the FTSE Loonytoons trades produced a 10.7% gain, outperforming the index. Used in conjunction with some relatively simple technical rules, The Moods of The Moon system continues to provide very strong profits while reducing the risk of being in the market during lunar phases which are statistically negative over longer timeframes.

However, there are some indices where the lunar phase trading system will not work - confirming the warnings I issued in Forecast 2013 about those indices.

Okay, well this first edition of The Eye for 2014 is a shameless plug to sell Forecast 2014. It contains a lot of information and charts you're not going to see anywhere else and which I think will help guide you through the year ahead, regardless of whether the rally has yet to enter its final blow-off or backs away from the run it made over the course of the last year.

In the weeks ahead, we'll slowly return to the usual format for these free weekend reports.

Warm regards, best wishes and ... Safe trading - RA

Randall Ashbourne
Astrological Investing's associate, Randall Ashbourne, author of the eBook, The Idiot and The Moon, and The Idiot and the Moon, Forecast 2014, writes a free weekly column titled, The Eye of Ra on his web site in  which he explains the potential impact of astrological aspects and the current state of technical conditions. Ashbourne's charts are revealing illustrations of exactly what has occurred in the market and the probability of what to expect.
Important reading:  Randall Ashbourne's The Idiot and The Moon, Forecast 2014
(Disclaimer: This article is not advice or a recommendation to trade stocks; it is merely educational material.)
Copyright: Randall Ashbourne - 2011-2013

Friday, December 20, 2013

January 2014 Astrological Calendar - Transits for London, England, The FTSE

Astrological Calendar showing the day and times of planetary aspects for the FTSE, for the month of January, 2014.
January 2014  Astrological Calendar - Transits for London, England, The FTSE
click for larger image
 Using locational transiting aspects is critical in market timing.

To have these calendars BEFORE they are posted each month, they will be available to purchase in January.  They come complete as full 13-month calendars January 1, 2014 through January 31, 2015.

The calendars are perfect for viewing on an iPad or other electronic reader - and they can be printed.  Included are dates of Moon Phases, Planets Stationing (changing directions) and Eclipses, as well as a schedule of open hours and days for each market. 
Click here to purchase

There are three separate 13-month calendars - January 1, 2014 through January 31, 2015 - with transit to transit aspects for the NYSE, FTSE, and ASX.

These can be purchased individually for $8.00,or all three for a special price of $16.00.

Tuesday, November 26, 2013

December 2013 Astrological Calendar - Transits for London, England, The FTSE

Astrological Calendar showing the day and times of planetary aspects for the FTSE, for the month of December, 2013.
December 2013  Astrological Calendar - Transits for London, England, The FTSE


Using locational transiting aspects is critical in market timing.

Click image to view full size calendar.

Saturday, November 2, 2013

November 2013 Astrological Calendar - Transits for London, England, The FTSE

Astrological Calendar showing the day and times of planetary aspects for the FTSE, for the month of November, 2013.
November 2013  Astrological Calendar - Transits for London, England, The FTSE


Using locational transiting aspects is critical in market timing.

Click image to view full size calendar.

Saturday, October 19, 2013

Murky Wrecks ... and more gold mystery

Randall Ashbourne, an associate of Astrological Investing, posts a weekly market report on his web site, theidiotandthemoon.com The following is this weekend's Eye of RA report: Week beginning October 21, 2013

Murky Wrecks...and more gold mystery
There are a couple of astro events this week likely to have an impact on stock markets ... Mercury goes Retrograde and the Sun shifts from Libra into Scorpio.

Firstly, the usual warning about Merc Rx - Murky Wrecks - make sure you double-check everything you do and expect some data feeds to go haywire.

Most of us make a few mental blunders during the Merc Rx periods; like hitting the Buy button when we actually meant to Sell.

It's just a lack of concentration, which is easy to overcome if we're aware of the tendency and adopt a policy of double, even triple, checking.

There is also a general tendency for stock markets to start a move in the few days around the Merc Rx date which reverses course halfway through the phase (normally about 3 weeks long).

It doesn't always happen, but it does more frequently than not ... and since the last Mercury Retrograde phase in June/July launched a strong rally throughout the period, the coming phase probably has a higher chance of returning to "normalcy" mode.

We'll take a look at a chart on the topic in a moment. We'll also be taking another look at gold, where mysterious big money buyers have replaced the mysterious sellers, and I'll start the process of updating the Weekly Planets charts for a range of indices ... starting this weekend with India's Nifty, London's FTSE and Singapore's STI.  

There is great joy across America as its politicians vote to send the nation deeper into debt while refusing to do anything about its profligate spending.

This is good. It means we can all get back to the really important stuff ... like why Miley persists in sticking her tongue out so far when it's always covered in white fuzz ... or whether there should be a law compelling Kim Kardashian to wear a full burqa so we are all spared another one of those endless "selfies" displaying buttocks that would shame a dairy cow into going on a diet.

And speaking of vacuous trolls ...

Miss Pollyanna, the SP500, gapped up on Friday into the Full Moon date, which statistically tends to be a low point in market mood. This inversion of the normal also happened at the last Full Moon - prompting a 3-week decline.

The new Price high has received an approving nod from the Big Bird oscillator, which has also recorded a higher peak ... though not as high as it recorded in May.

Next, we will look at a Mercury/Node chart for the index. In the left third of the chart I've marked the previous Merc Rx phase with two black verticals. The index rallied all the way through the phase, which is a little unusual.

Miss Polly has a tendency to travel between Node price lines, which are the orange horizontals on the chart above. And there's one of those immediately overhead.

The astrological symbolism applied to Mercury Retrograde periods is that it denotes time for a RE-think about what's happening. I showed you a few weeks ago that the Sun in Libra tends to be a bit chaotic. Libra symbolises balance and a drive to reach agreement and an harmonious outcome.

I also said it can just mean the iron fist is wrapped in a velvet glove. We had that sort of stuff happening in Washington. Nevermind. We got the agreement, which kicks the whole mess down the road until early next year.

The Sun's shift to Scorpio, in conjunction with the Merc Rx phase for the next few weeks, means it's very likely there'll be a national re-think about how to handle all the debt (Scorpio) issues.

So, we do need to be aware that the breakout could be subject to a reversal. However, it is a breakout and the next highest level of long-range planetary price resistance doesn't come into effect until the $1770s.

The optimism displayed by Pollyanna is not universally shared.

London's FTSE index remains below its May highs; in fact, it's still below its August and September highs.

The daily Big Bird is crawling higher, even with the price lower. There's not quite the same level of agreement from weekly Big Bird on the FTSE's Weekly Planets chart (below).

Still, either on this rally or the next one, the FTSE seems to have its target set at the upside Saturns - in the 6700s.

Mumbai's Nifty Weekly Planets is below and the index has been playing those close to perfection. Big Bird likes the bounce and breakout is likely to target the 6400s.

The Straits Times Index has been constrained by Saturn for many weeks - and its Big Bird is not giving clear signals for a move in either direction.

Similar to the Nifty, Auntie - the ASX200 - is playing almost perfect WP touches. We have preliminary indications of a break northwards ... and it's open space all the way to around 5500.


I'll try to update more European and Asian WP charts over the next couple of weekends. But now, let's turn our attention to the latest shenanigans in the bullion bazaar.

And bizarre it was again last week when, in the wee hours of New York's Thursday morning, a wave of Buy orders worth over $2.3 billion surged onto the markets, causing a 3% jump in prices in a matter of minutes. The manipulation continues unabated.

Let's look first at my planetary price chart for greenback gold. We got the lower prices when gold slumped down into the 1250 Pluto level early in the week and rebounded with all those mysterious early-am Buy orders on Thursday to finish the week capped by a falling Sun line.

Thursday's raid also produced a breakout above the red downtrend line which has controlled the market since it peaked in August. Fast Bird (green) likes the move and so does the red Medium Bird.

So, despite Friday's stall it appears higher prices are ahead. So go consult the planetary chart.

But remember that there's still a lot of overhead resistance which has yet to be overcome before we can be sure gold has embarked on a sustained rally.

Safe trading - RA

Randall Ashbourne
Astrological Investing's associate, Randall Ashbourne, author of the eBook, The Idiot and The Moon, and The Idiot and the Moon, Forecast 2013, writes a free weekly column titled, The Eye of Ra on his web site in  which he explains the potential impact of astrological aspects and the current state of technical conditions. Ashbourne's charts are revealing illustrations of exactly what has occurred in the market and the probability of what to expect.
Important reading:  Randall Ashbourne's The Idiot and The Moon, Forecast 2013
(Disclaimer: This article is not advice or a recommendation to trade stocks; it is merely educational material.)
Copyright: Randall Ashbourne - 2011-2013