
Showing posts with label Uranus/Pluto square. Show all posts

Sunday, July 12, 2015

High energy impact zone starts now

Randall Ashbourne, an associate of Astrological Investing, posts reports and articles on his web site at  theidiotandthemoon.com   The following is this weekend's Eye of RA report: Week beginning July 13, 2015 
We are now entering one of the astrological high-impact zones of the year.
In Forecast 2015, published in January as a free download, available in the Archives and in the Astrological Investing's shop, I outlined this period from mid-July to early-August with a heavy red border and indicated it was one of three periods likely to be significant for stock prices.

It has already been triggered by the passage of the Sun, but is about to get potentially even nastier.

Mars will oppose Pluto and square Uranus. Mars is symbolic of drive and energy, Pluto rules big power, big money and taxes, and Uranus is representative of "the little guy" demanding a fair go and radical reform.

We've discussed these many times in the past few years because of the long-running square aspect between Uranus and Pluto.

It'll start to get even more intense this week when Venus squares Saturn, an aspect the big guy, Jupiter, will repeat in early August.

And Venus, the ruler of money, material values and diplomatic relations, will soon go retrograde.

Let's not worry ourselves too much about trying to predict the outcome of the astrological transits and, instead, take a look at where we are, primarily with Wall Street's SP500.

In March, I warned that the 500 was about to start running into a series of primary, downtrending planet lines likely to heavily stall the rally.

Incidentally, the same thing will happen to the Australian stock market in the next couple of weeks, but I'll deal with that later in this edition. In the June edition, I indicated traders had to keep a close eye on a primary Pluto level of $2084 for the Pollyanna index (SP500).

It lost the support of that line and is now on its third attempt to retest it from the downside. Strong recovery, especially on a weekly basis, could see Wall Street launch into a rally likely to take it to $2180 or higher. A failure to do so will see prices drop back down under the influence of the falling primary planet lines. 
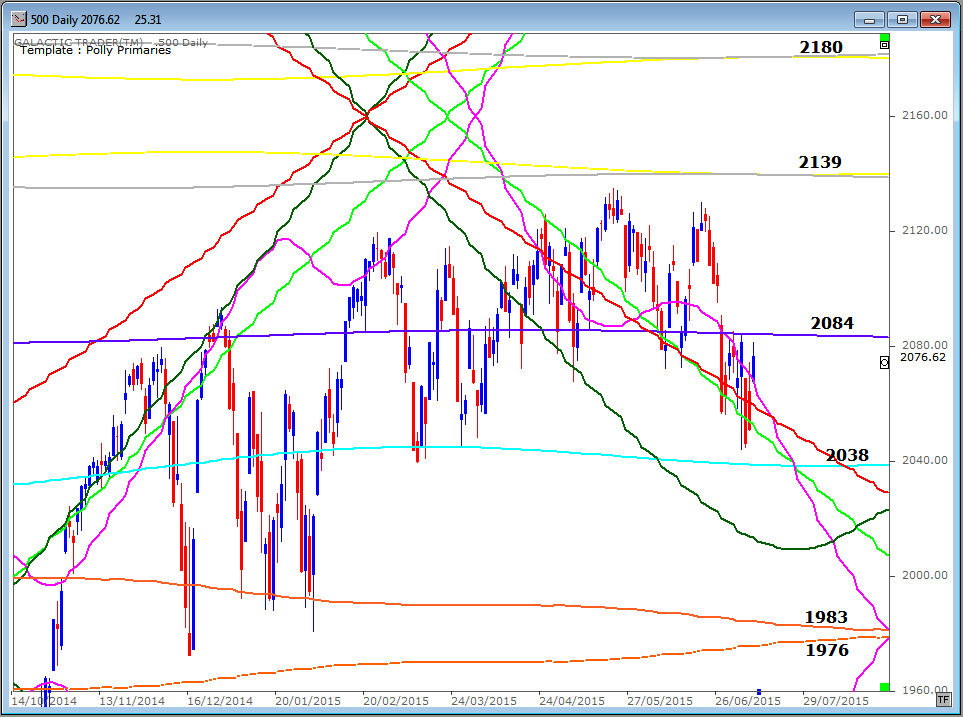
Remember that we are now in the weakest portion of the stock market year and the "sell in May" theory may be taking effect, with a decline all the way to October.

The chart below shows Pollyanna's long-range planetary price lines and a continued decline could see it drop a lot further yet.
Forecast 2015 also listed the major Bradley Model turn dates for the year ... and this is what has been happening, so far. I always warn you it is the dates which are important, not the direction nor the amplitude of the trend change.

April 3 was two days off a low; May 22 was one day off the all-time closing high; June 8 was one day off a low. The next major turn date doesn't arrive until early October, though there are two minor dates in the next couple of weeks during this high-energy astrological zone.
Now, let's take a technical look at how Pollyanna is holding up. Below is the long-range monthly Bi-BB chart, using a fast MACD as the oscillator and showing a trend pitchfork.

For the past few years, the 500's prices have travelled very strongly within the upper tier of the monthly Bi-BBs. This very useful technique is outlined in The Technical Section of The Idiot & The Moon.

As well as that, Polly has been trying valiantly to ride along the top edge of the major, blue tyne of the pitchfork. We are starting to see signs of deterioration in the strength of that advance ... and with negative divergence in both the MACD signal lines and histograms.
The deterioration is also evident in a weekly chart, where the pitchfork's tynes are anchored at the first major correction after the Bear bottomed in 2009. The angle of the uptrend continues to hold, but price is finding it increasingly difficult to sustain ... and the Big Bird oscillator doesn't seem convinced that the current correction has completed.

In short, we all need to be very careful in these few weeks into early August.
That might be particularly true for the Australian market. It is now facing the same problem which has thwarted the Wall Street rallies in recent months ... a heavy set of downtrending inner planet lines almost immediately ahead.

If you take a quick eyeball at the left-hand side of the chart, you get an idea of what contact with these once-a-year downtrend lines can do to the index!
The trouble will come if the index rises into around $5700 by the end of the month. During all the volatility of the past couple of months, the ASX 200 has been routinely playing with blue Saturn price lines on its Weekly Planets chart.

The Big Bird oscillator isn't hopeful, at this stage ... and you can see the resistance around the $5700 level is also emphasised on this chart. In any case, these price targets have been working exceptionally well for weeks now ... for initiating Longs or Shorts!
Safe trading - RA
Randall Ashbourne (Disclaimer: This article is not advice or a recommendation to trade stocks; it is merely educational material.)
Copyright: Randall Ashbourne - 2011-2015


Read Randall Ashbourne's FREE report
THE IDIOT AND THE MOON FORECAST 2015
Astrological Investing's associate, Randall Ashbourne, is the author of the eBook, The Idiot and The Moon,  Ashbourne's Galactic Trader planetary charts are revealing illustrations of exactly what has occurred in the market and the probability of what to expect.

The Idiot and the Moon, eBook, available for purchase

Wednesday, September 19, 2012

The Autumnal Equinox, September 22, 2012

Chart for Washington, D.C. USA

Chart Analysis with discussion of Astrological Events

Listed in the Astrological Events of the Season is the September 19, 2012 Uranus square Pluto aspect at 7° Aries/Capricorn. Click here for list.

Though exact before the Equinox, this aspect remains an important influence throughout 2012, up through 2015. It is significant because of the implication of its meaning globally as well as at home.

The Autumnal Equinox, Wednesday, September 22 at 10:48:58 am EDT, Washington D.C.
“What all the wise men promised has not happened,
and what all the damned fools said would happen has come to pass.” – Lord Melbourne

Charles E. O. Carter, the great Twentieth Century British Astrologer, states in the book, Mundane Astrology, The Astrology of Nations and States, "Uranus represents the administration of power, the administrative officers of the State and all their functions." Additionally Carter goes on to say, "Uranus rules power on the physical plane - dynamos and all power generators." With such electric energy, Uranus is as unpredictable as lightning. When afflicted by difficult aspects Uranus is rebellious and anarchic. 

Pluto desires to control power, using power to control. With an affinity to the Underworld, it reveals what is hidden and dark, bringing elements into the light making what was powerful now vulnerable, thus easier to tame, reform, transform or destroy. Pluto, like Mars, is a planet of war, but much, much more ruthless. With it's scorched earth policy Pluto brings about transformation, but only after destruction of what lies in it's path.

Randall Ashbourne writes, "Uranus represents an energy which demands change, reform and radical restructuring of everything it considers "wrong". In Aries, the demands are aggressive and, if thwarted, will turn to direct action ... from taking over the streets to taking up arms. Pluto represents great power and great wealth concentrated very narrowly. In Capricorn, it is very much all about control by the plutocrats... " - Eye of Ra report, week beginning June 18, 2012

So, what we have in this season ahead is a time greatly influenced by tense, dynamic energy pitting the nature of these two planets and the signs they are in against each other to force an outcome. It is quite understandable then, that the world has been confronted with economic and political crises.

Bold, impatient, impulsive and rebellious Uranus in Aries square Pluto in Capricorn has brought about the reigniting of anti-Japan protesters across China; has exposed the euro as a divisive force instead of what was to be a uniting force for European countries; and has driven deeply divided political parties in the USA to face off in a nasty, bitter battle for the White House while America faces a fiscal cliff ahead regardless who wins. It has brought about the Arab Spring uprisings, and now extremely anti-American sentiment and tension in the Middle-East. We now are experiencing what some journalists have named "the Arab Winter". 

"U.S. embassies and consulates have been breached this week in Egypt, Libya, Yemen and Tunisia — the same four countries to rid themselves of decades-long dictatorships in what became known as the Arab Spring of revolutions last year. In Libya, the only place the U.S. used its military to ensure regime change, the violence was the worst, claiming the life of Ambassador Chris Stevens and three other embassy staffers." The Washington Post, September 14

The Equinox chart is rife with difficulty. Sun in opposition to Uranus square Pluto with Mars on the Ascendant in Scorpio. Markets will go on a wild ride, gold and silver prices will rise and fall and people are in an aggressive mood...

The Equinox Sun for Washington, D.C. appears in the Eleventh house with Mercury
The Sun in good aspect here should be beneficial for Washington D.C., however five days later, on September 29 the Sun forms an exact T-Square with the Uranus-Pluto aspect. National and International news is filled with stores of anti-American protests and of a presidential campaign that only gets nastier.

Mercury goes retrograde on election day and that isn't good news for the candidates. The last time Mercury stationed retrograde on election day was in 2000! And we all know how that went...

Mars (co-chart ruler with Pluto) in the first house square Venus in the ninth - An aggressive spirit has risen in the people regarding domestic matters and matters abroad. With riots, strikes, fires, assaults, and rumors of war, military affairs attract attention and battleships are launched. Financial questions affecting foreign relations cause debate and concern.

Moon in the Second House sextile Saturn in the twelfth - Economic worries are soothed by the Fed's release of more money into the market to influence financial affairs generally. This adds to the ever increasing political power of the Fed.

The national debt and the economy is an important campaign issue, but what women "value" and what their needs are an important part of the debate in the presidential election.

Saturn enters Scorpio on October 5 - Real and responsible reform regarding financial policy must be dealt with as Saturn transits Scorpio over the next three years. Debt, regulations in banking, and taxation are areas that both political parties must confront.

Pluto in the Second house square Uranus in the fifth house - suggests a possible increase in military spending and a discontent over national extravagance. Possible loss in equities in the stock exchange causes precious metals to soar. Disputes over financial questions and taxation cause concern.

Neptune in the fourth house - This is good for crops if the weather remains temperate and damp, but there is a possibility of cold, damp weather. Not only is there a good deal of fluctuation in temperature, but in the political climate as well!

Jupiter in the eighth house sextile Venus in the ninth house -Opportunities for financial relations with foreign countries improve. This is fortunate for trade and the shipping industry.

Happy Halloween, October 31, 2012
Happy Thanksgiving, USA November 22, 2012

Be sure to read the New Moon Newsletters for September, The New Moon in Virgo, September 15; for October 15, The New Moon in Libra; and for November 13, The New Moon in Scorpio. (If those newsletters are not for the current month, you will find them in the newsletter archives.) To get these newsletters in advance please subscribe here.
All the best ~ Marley

Marlene Pfeifle, CAP

Saturday, August 4, 2012

The end of the spurt-and-reverse cycle

Randall Ashbourne, an associate of Astrological Investing, posts a weekly market report on his web site, theidiotandthemoon.com The following is this weekend's Eye of RA report: Week beginning August 6, 2012
Mercury returns to Direct motion in the coming week, which will help put a stop to the spurt-and-reverse activity of the past few weeks.

According to research by Kaye Shinker, the Dow Jones Industrials have a distinct tendency to end the Mercury Rx period with prices back within 1% of where they started the cycle.

 If that tendency plays out, it should put the SP500 somewhere between 1370 and 1350 on Wednesday.

Last weekend, we pondered why the Fed would goose markets with Wall Street back in the bubble zone which marked the 1999-2000 and 2007 "irrational exuberance" peaking range ... and the chances of Mario Draghi having to revisit his hairy-chested "whatever it takes" bravado of the week before.

SuperMario, who presided over the Bank of Italy while the country was going bankrupt, went from pit bull to lapdog within a week as all his "will act" talk made the transition to "may consider" and a dozen other weak phrases.

The markets tanked ... and then turned again just as suddenly, purportedly on good hiring numbers in the USA (numbers which will, like MachoMario, have to be revisited when Mercury goes Direct).

Since the Mercury Rx cycle started in mid-July, the "trend" has reversed every few days. Mercury Direct should put us back on a more stable course - one way, or the other.

Let's begin this weekend by reviewing where we are within the SP500's long-range planetary prices. Firstly, trace the grey Neptune marked with 1411 and the orange Node line marked with 1319 from the current price bar back to the top left of the chart.

During the 2007 topping process, these two planetary lines underscored the final stages of the Bull run. For the moment, the Neptune barrier continues to provide formidable resistance.

Click for larger image

We may be talking about faraway planets, but there's no rocket science involved with the price targets. Last month found support at the Node line and this month, so far, the dark blue Pluto line is providing that function - with Neptune as the upside barrier.

Using a weekly Bi-BB chart (below), we get a reasonably similar view from a purely technical viewpoint. For a few weeks, the upside was contained by the middle band. The breakthrough then opened the first layer of the upper tier as a target - and it has been met. IF we get a weekly close inside the higher layer, there's a strong chance Pollyanna will make a new High.

Click for larger image
On a technical basis, the chart suggests a new High is probable, rather than merely possible. The fast MACD looks healthy enough ... and the candlesticks are leaving long tails, indicating Bullish buyers step in just as the Bearish crowd threatens to take command.

The MACD readings on the daily chart are not quite as healthy and the height of the histograms continues to decline with each new peak in the price. I mentioned last weekend that the price of the last low before the high - 1391 - should provide strong resistance the first time it was hit.

Monday hit that level and produced a strong reaction downwards, which Friday's strong rally reversed, regaining all of the losses and then some.

Click for larger image
We've been chatting recently about Pollyanna's tendency to run in cyclical timeframes linked to divisions of 30 calendar days, which are the dashed blue verticals on the chart above. Starting from the high price on April 2, we can see the index declined 60 days ... and then rose for 60 days into the peak early last week.

But, now we have a new peak and have to ask the question whether, despite the Bradley Model turn date and the astrological expectations of a Bear wave developing, the index is in a longer-running cycle that might last for 90 days.

Well, the targets for that scenario are clearly spelled out on Pollyanna's long-range planetary chart - or by the technical markers on the Bi-BB template. And it all depends on whether we get treated to another spurt-and-reverse Mercury Rx move before the planet goes Direct again midweek.

Click for larger image
The FTSE, too, perked up on Friday after being disappointed by a Bundesbank-chastened Draghi on Thursday. The oscillators weren't as giddy about the move as price was. The index is trying to catch yet another ride higher along the angle of the rising Sun line which kicked into gear in early June.

I suspect it's going to fail ... but, just in case ...

Click for larger image
The FTSE Weekly Planets chart is shown above - with the upside target marked if price can hold the 5756 Saturn line. As with the 500, the fast MACD is showing no warnings of a imminent demise.

Click for larger image
I mentioned over the past couple of weekends the ASX200's long-term love affair with Neptune price lines. She not only finally made kissy/smoochy with the line last week, but ran to a false break above Saturn, before settling back into Neptune's embrace. And, once again, no warning klaxons from the MACD.

So, we have a situation where the normal Mercury Rx mode should bring prices down again by midweek, but the technical picture across three indices points towards further intermediate gains and the potential for a retest of last year's Highs.

Apart from Merc's change of direction, a 3Q Moon, and a Venus sign change accompanied by a trine to Neptune, there's not much happening with The Spooky Stuff in the coming week.

There will, however, be a major fireworks show the following week when the New Moon concides with Venus setting off the Uranus/Pluto square and Mars conjuncting Saturn ... when forward "drive" runs into a brick wall.

Safe trading - RA
Randall Ashbourne
Astrological Investing's associate, Randall Ashbourne, author of the eBook, The Idiot and The Moon, writes a free weekly column titled, The Eye of Ra on his web site in  which he explains the potential impact of astrological aspects and the current state of technical conditions. Ashbourne's charts are revealing illustrations of exactly what has occurred in the market and the probability of what to expect.
Important reading:  Randall Ashbourne's article, Jupiter's cycle and its effects on Wall Street and a posting of the weekly Eye of Ra report in this blog, titled A look at the Venus Retrograde effect
(Disclaimer: This article is not advice or a recommendation to trade stocks; it is merely educational material.)
Copyright: Randall Ashbourne - 2011-2012