Showing posts with label cardinal signs. Show all posts

Saturday, September 28, 2013

Libran "balance" can be very chaotic!

Randall Ashbourne, an associate of Astrological Investing, posts a weekly market report on his web site, theidiotandthemoon.com The following is this weekend's Eye of RA report: Week beginning Sept, 30, 2013

Sometimes, the velvet glove just puts a pretty face on the iron fist.
We need to talk about The Spooky Stuff this weekend ... because there's a surprising amount of danger involved.

The Sun is now travelling through Libra and will be joined by the Moon late this week for a New Moon, statistically a high point in market prices.

The New Moon is closely opposed to Uranus and square to Pluto, again setting off the tension we've discussed at length over the past 2 years.

Libra is supposed to be one of the really nice signs of the zodiac. Symbolically, it represents a drive for equity, harmony, fairness, balance and diplomacy. Supposed to be. Sometimes, the velvet glove just puts a pretty face on the iron fist.

Which is precisely what we're seeing again as the Obama White House engages in another battle about debt with the Republican Congress.

Instead of playing nice with each other we see yet more nuances of the Uranus/Pluto square, which pits demands for radical reform against entrenched defence of the status quo. And, perhaps typical of Libra, both sides are on ... both sides.

Obama is determined to get radical reform of healthcare, while raising the debt ceiling to keep the Government functioning; Republicans want radical reform of spending and the scrapping of the healthcare reforms.

All that aside, past performance suggests the Sun travelling through Libra is nearly always a volatile time for the stock market.

The chart below shows the performance of Wall Street's SP500 since the late 1990s, with the red bars depicting the Sun's annual move through Libra.

Libra is one of the Cardinal signs; an action sign. And it does tend to produce some very strong action ... and not much "balance".

There are 14 Libran Sun periods on the chart before the current one ... 9 of them produced significant lows, 2 produced significant highs. That's 11 of the 14 which turned the markets in a very significant way.

With odds like that, it's probably not a good time to nod off. Even the three periods which did not occur with a high or low produced a lot of action ... a strong rally in all three cases.

Our next chart is Pollyanna's New Moon/Full Moon chart. We discussed the implications of this channel last weekend because of the rarity of making a Full Moon price high.

New Moons are the thick red dotted bars (statistical high) and Full Moons are the thick blue bars. Check back through the performance and we can see it's unusual for the SP500 to drop directly into the New Moon. The tendency is to at least bounce for the few days into the NM date; Friday of this coming week.

Remember, too, that we have a Bradley Model trend change date next weekend. Check the Archives for last weekend's edition if you missed it.

You'll notice on the New Moon chart that Polly closed Friday with another visit to the red parallel of the channel she'd been following for most of the year.

It was also a gap-filling, Fibonacci Retracement level of the post-June rally. I indicated early in the year I was starting to keep manual charts for Pollyanna because of the inaccuracy (total lies) of the official figures from the NYSE.

As you can see, the real Opening figures show she's been gapping all over the place for the past few months. While contact with a supportive FiboRx level and the rising trendlines indicates the potential to show a "normal" bounce into the New Moon on Friday (and the Bradley date), there are two very obvious gaps crying to be filled ... the black line at 1672.40 and another down at 1593.79.

Now let's turn our attention to where we are in the bigger picture. Last weekend, I showed a monthly version of the following weekly channel chart and mentioned Big Bird on that chart was only just starting to show signs of negative divergence.

If we apply a general rule of normalcy ... and I emphasised just how normal that monthly chart was ... we cannot transform from Bull to Bear without clearcut divergence in the monthly Big Bird.

But, as I've said, weekly Big Bird has fallen off his perch and is squarking horribly. It's not screaming Bear! ... but it is giving increasingly shrill warning signs of another multi-week correction.

While the chart above uses the simple trendline/channel techniques outlined in The Technical Section of The Idiot & The Moon, we can also use Andrew's Pitchforks to get a good idea of where we are - and some sense of where we might be going.

The chart below shows both the long-range rising fork and the potential for more relatively near-term declines. Just "eyeball" the chart for the big picture overview.

Because once we see the broad picture, it's easier to spot exactly where we are within the broader context.

We can see Miss Polly topped out two weeks ago with a touch of the central blue tyne of the rising, long-range fork. It was also the place where the last Fibonacci outlier of the falling fork came into play.

We don't really need ALL of these methods. Too many cooks spoil the broth; too many charts befuddle the brain. Still, we see Polly ended the week with a touch of one of the important internal Fibonacci lines of the rising fork.

So, what we seem to have is the potential for what would be a normal New Moon bounce this week. But we also have an intermediate-range Big Bird which is decidedly unhappy with the state of affairs and disagrees very, very strongly with the legitimacy of the recent price rises

We have a significant, month-long Bradley trend change indicated. And we have the potential for the Libran Sun to cause chaos and sharp price moves. Caution, anyone?

Safe trading - RA

Randall Ashbourne
Astrological Investing's associate, Randall Ashbourne, author of the eBook, The Idiot and The Moon, and The Idiot and the Moon, Forecast 2013, writes a free weekly column titled, The Eye of Ra on his web site in  which he explains the potential impact of astrological aspects and the current state of technical conditions. Ashbourne's charts are revealing illustrations of exactly what has occurred in the market and the probability of what to expect.
Important reading:  Randall Ashbourne's The Idiot and The Moon, Forecast 2013
(Disclaimer: This article is not advice or a recommendation to trade stocks; it is merely educational material.)
Copyright: Randall Ashbourne - 2011-2013

Saturday, June 22, 2013

Bounceback potential in stocks and gold

Randall Ashbourne, an associate of Astrological Investing, posts a weekly market report on his web site, theidiotandthemoon.com The following is this weekend's Eye of RA report: Week beginning June 24, 2013

Bounceback potential in stocks and gold

World stock indices and the price of gold are hitting, or are very close to hitting, prices which have the potential to produce a bounceback.

However, the situation overall remains dangerous and complex as both technical conditions and the astrological weather deteriorate.

We have a lot to consider this weekend; most especially whether we are now in the early stages of a developing Bear market in stocks.

But we will begin by reviewing where we are in terms of the correction which started, for most indices, late in May. I indicated then that: "There's a strong chance stock markets have gone into correction mode likely to last for several weeks."

For the past few weekends, as we tracked the decline in European and Asian indices, I've also indicated: "At a glance, the correction on Wall Street still seems to be too shallow, in terms of both Price and Time, to be realistic - especially considering the rapid, steep declines in most other major indices."

And I said last weekend: "Jupiter energy takes centre stage this week, when the fires of optimism will be stoked again ... or the fear will be."

We got the fear mode, which finally produced a Wall Street decline which is much more realistic in terms of an intermediate correction.

It now may be nearing bounceback levels. I would prefer to see a low form in the SP500 in the price range from 1570 to 1540, since the decline still seems a little short of the mark.

However, some of the other world indices are starting to display positive divergence sufficient enough to produce at least a bounce.

But the astrological weather ahead in the next few weeks is full of turmoil ... and we have reached a major Bradley Model turn date. I will leave discussion of The Spooky Stuff until later in this edition.

Since it's the easiest to deal with, we'll begin with a quick look at gold. Long-range, it has hit an important Fibonacci Retracement level.
click for larger image
Purely from a technical perspective, this is a normal retracement which, if it holds, keeps the long-term uptrend in a strong position. And it should hold, at least for a relatively strong bounce. The danger is that the long-range oscillator continues its deep dive.

From a planetary perspective, gold has lost the primary Pluto line at 1360 and a primary Sun line - with last week's drop taking price down to a secondary Pluto level. The potential good news is that not only has it now hit a long-range FiboRx price, but it has dipped into Pluto prices with a third instance of positive divergence in the oscillator, though it is mild divergence rather than strident.
click for larger image
There is one other factor which could help to produce a bounce ... Heliocentric Mercury goes into Sagittarius this weekend for a brief visit into early July. It's a position which frequently causes a gold rally. It's not a certainty, but as we can see from the weekly gold price chart below, it does tend to have an impact.
click for larger image
Now let's turn our attention to Pollyanna, the SP500. Well, Polly actually ran screaming from the stage last week for a Chicken Little revival. As usual, Wall Street was more than a day late and a lot more than a dollar short in doing what everyone else was sure of weeks ago.

There is a reason I call the SP500 Pollyanna ... or The Vacuous Troll. However, reality finally dawned that Benign Ben isn't going to drop money from helicopters in QE4ever.

The index finally dropped out of the uptrend channel which has defined the rally since it launched late last year. The drop has taken it down into a potential Full Moon low, which is a statistical tendency. The only thing that concerns me is I'd have preferred to see it hit price levels from 1570 to 1540.
click for larger image
Now let's look at the index in terms of the wider rally channel in play since the bottom of the Bear crash in 2009. While it has lost the intermediate-term rally angle, it came to rest at the end of the week with a little bounce from one of the long-term channel markers.
click for larger image
The bad news is that the long-range Canary, the Big Bird, has dipped below the upper red line in the oscillator panel, which is a clear warning the inner technical strength of the Bull run is starting to fade again.

Now I have been indicating since late May that I thought this was going to be an intermediate-length correction, lasting probably 5 to 8 weeks. There is a chance it is something much worse. However, there are no major warning signs on the monthly charts, so I'm still leaning towards the optimistic outcome ... which is that this is the last major correction before the final, the last, rally of this Bull run.

But ... two things. Firstly, the combined impact of Neptune going Retrograde and last week's Sun-Jupiter conjunction. They're marked on Pollyanna's long-range monthly chart below with blue bars for Sun-Jupiter conjunctions and red bars for Neptune Rx.

And they have a nasty habit of showing up at important turning points!
click for larger image
And we also have the Bradley Model suggesting a major trend change. I dealt with the Bradley Model at some length in the June 3 Eye of Ra (click here), or you can access via the Archives button on my web site. (http://www.theidiotandthemoon.com/index.html)

I repeat the warning: It is the dates which are important, not the direction nor the amplititude of the swing.

The next trend change dates for this year don't occur until early September and early October.
click for larger image
Okay, now let's discuss The Spooky Stuff - because the astrological weather is full of change in the next few weeks.

Jupiter changes signs into Cancer this week ... Venus goes into Leo, where she throws off the dowdy house frock, gets a new "do" and piles on the bling ... and Mercury the brat mischief maker goes Retrograde.

We have discussed Mercury Rx many, many times. And here we go again. DOUBLE-check EVERYTHING you do for the next few weeks to make sure you are actually doing what you intended to do!

Before you hit the Buy or Sell button, pause ... consciously think ... double-check that you WANT to Buy or Sell. You have a stronger than usual chance of hitting the wrong button. But ... ONLY if you're being inattentive! This is not the world out to "get" you. It's you!

Now, it is true that data feeds go awry for a couple of days around the Rx and Direct dates; it is true that emails go missing; it is true that computers do the damndest things.

And it is also true ... more often than not ... that markets will start a trend around the Rx date which reverses course halfway through the Rx phase ... and then arrive at the Direct date a few weeks later with prices pretty much within a per cent or so of where the whole silly phase started.

So, Mercury is Rx from June 26 to July 20. Just pay attention!

Jupiter's shift into Cancer should accelerate sector rotation ... that is, money will flow out of stock sectors which have been popular over the past year or so and into different sectors. I discussed this in the May 13 edition.

It also puts the planet of expansion on track to make a Grand Trine, which is the most benevolent of all astrological aspects, with Neptune in Pisces and Saturn in Scorpio. Neptune rules Pisces, so is in a good mood; Jupiter is exalted in Cancer, so he is reasonably benign; and Saturn in Scorpio is associated historically with strong stock market rallies.

The aspect becomes exact in mid-July. We will need to watch the performance of stock indices very closely then, because a Grand Trine is a very powerful aspect likely to produce an important high or low.

Okay then ... let's recap. Most of the world stock indices behaved themselves ... launching into a strong, intermediate correction in late May. The Vacuous Troll kept dancing to the old Benny and the Feds soundtrack, but also finally faced reality. Apart from Polly, most indices have already hit - and in some cases re-tested - potential bounce levels.

We have a Murky Wrecks period fast approaching, which have a tendency to start a short-term trend change which reverses course halfway through. Helio Merc is going into Sadge and Geo Venus is going into Leo, both of which have a reasonably strong tendency to be good for a gold rally ... as the metal hits a long-range Fibo Rx level, with some intermediate-term positive divergence.


So, I think we have the potential for a good bounce in both gold and stocks getting underway this week. It's probably not going to be long-lasting for either of them ... and over the longer-term, warning sirens are starting to wind-up for stock markets.

Safe trading - RA

Randall Ashbourne
Astrological Investing's associate, Randall Ashbourne, author of the eBook, The Idiot and The Moon, and The Idiot and the Moon, Forecast 2013, writes a free weekly column titled, The Eye of Ra on his web site in  which he explains the potential impact of astrological aspects and the current state of technical conditions. Ashbourne's charts are revealing illustrations of exactly what has occurred in the market and the probability of what to expect.
Important reading:  Randall Ashbourne's The Idiot and The Moon, Forecast 2013 , Jupiter's cycle and its effects on Wall Street and a posting of the weekly Eye of Ra report in this blog, titled A look at the Venus Retrograde effect
(Disclaimer: This article is not advice or a recommendation to trade stocks; it is merely educational material.)
Copyright: Randall Ashbourne - 2011-2013

The Idiot and the Moon, Forecast 2013
  • Major trend change dates for the full year, plus a month-by-month breakdown of high-energy trading dates and critical reversal dates.

  • An index-by-index analysis of Moon Trading across major American, European, Asian and Australian stock indices-

  • Identifies the major indices where following the phases of the Moon can dramatically cut profits, or even result in large losses.

  • Old Gods & Gold ... a Eureka! discovery about exactly what drives gold prices during rallies and corrections and charts showing highly-reliable target levels to both the upside and downside.

These price charts are individually-tailored to each index and cover Wall Street, Australia, Canada, Hong Kong, Singapore, Shanghai, India, England, Germany and France.

You will not see these charts anywhere else on the Internet!

And much more...

It is NEVER too late in the year to have this monthly information!


Saturday, June 15, 2013

The bounce in stocks ... and Asian indices

Randall Ashbourne, an associate of Astrological Investing, posts a weekly market report on his web site, theidiotandthemoon.com The following is this weekend's Eye of RA report: Week beginning June17, 2013
Jupiter energy takes centre stage this week
 Jupiter energy takes centre stage this week, when the fires of optimism will be stoked again ... or the fear will be.

Last weekend, we reviewed where we were within the correction and I indicated Venus was making two aspects we needed to watch closely.

I said: "So, the Friday bounce could be short-lived. We need to pay close attention to price reaction on Tuesday and Wednesday when Venus opposes Pluto and squares Uranus."

That was the timing for Europe and America. The aspects were in play on Wednesday/Thursday in Asia - and most Asian indices, including Australia, produced a classic turnaround bar on Thursday and bounced strongly into the week's end.

Whether the bounce produces anything more than a blip will depend on the reaction to this week's conjunction between the Sun and Jupiter. This is a once-a-year event. Symbolically, it represents a peaking of growth energy and packs enough oomph to cause an intermediate change in trend.

It's also the week when a major Bradley Model trend turn date is due and the Sun will leave volatile Gemini for the security of Cancer. As one of the Cardinal signs, Cancer is an "action" sign ... and it is where the action is geared almost solely towards protection of all those things which make us feel secure, safe and comfortable.

We'll review the status of the correction this weekend and the Weekly Planets charts for Asian indices.

At a glance, the correction on Wall Street still seems to be too shallow, in terms of both Price and Time, to be realistic - especially considering the rapid, steep declines in most other major indices.

Yet, technically, the SP500 remains in its uptrend channel. The Venus aspects to Uranus and Pluto produced another drop to again retest the validity of the lower channel trendline. We'll be in the lunar phase between the 1Q Moon and Full Moon, which tends to be statistically negative.
click for larger image
At this stage, however, Pollyanna is not only holding the rally channel in play since last November, but remains within the upper level of a long-term channel based at the 2009 Bear bottom. In other words, it's still Bullish.

The index is still rising in a sharp angle within that broader channel and the long-range Canary in the oscillator panel has not lost the upper red level which would indicate a major correction is underway.
click for larger image
This has not been the case with many other stock indices, most of which entered a major correction more than a month ago. Last weekend, I indicated those indices had reached potential bounce levels. The drops continued into the Venus aspects, but the delayed bounce was exceptionally strong.

We'll use the ASX200 Weekly Planets chart I've featured a couple of times in past weeks to review the bounceback. Despite the drop into the Venus aspects, Auntie finished the week in a stronger positon than the previous week. The Big Bird has turned higher without dropping as far as the Zero line.

Experienced traders I've talked to seem wary of the bounce. Yet, the index certainly seems to have met its targets for a major correction, which is what we thought this one was shaping up to be. It overbalanced the Price drop of the similar-level correction in early 2012, but not the Time - at least not so far.

We do need to continue to be cautious and not just because of this week's Bradley data and the Sun/Jupiter conjunction. We had several weeks of sideways shuffling at the end of the last correction of this magnitude.
click for larger image
However, we also need to at least weigh the prospect of what is "normal" after a drop this deep and this fast. And normal would tend to indicate a more sustained bounce to "balance" the drop.

Many of the other Asian area indices display charts very similar to that of the ASX200.

India's Nifty began its decline after failing to close above the 6175 Uranus level on its WP chart ... and with very clear divergence between the Big Bird and Price peaks when the high was made.
click for larger image
Singapore failed to even reach its Uranus barrier before turning down, with a negative divergence signal in the height of the fast MACD histogram peaks.
click for larger image
While Hong Kong turned south after being unable to climb above a Saturn barrier.
click for larger image
The build-up in the negative divergence levels on the oscillator for Jakarta was obvious and growing strident as that index struggled to overcome a Neptune price level in the mid-5100s ... but recovered the 4745 Neptune level with last week's strong bounceback.
click for larger image
While Shanghai may be in the process of finding its bounce level after recontact with a primary Saturn price line at 2150.
click for larger image
Now, each weekend we go through this exercise of trawling through planetary charts while I waffle on endlessly about astrological aspects and technical conditions. And that's just here. I got involved in a lively discussion with a couple of pals at the end of the week.

Both of them are not only intelligent, experienced, regular traders, but also have some enviable technical skills. We chat online virtually every trading day, swap tips and opinions, and tell jokes. These are conversations I wouldn't want to miss and if I had to trust someone else to invest for me, I'd trust these guys to make a profit more than any professional broker I've ever met.

Late on Friday, one of them was lamenting the fact his trading account was a little deeper in red ink than the previous week and I was reminded of why I wrote The Idiot & The Moon in the first place. And it's this ... a high-level IQ and an extraordinary degree of technical competence isn't a guarantee of making regular, reliable, safe profits from trading stocks. And nor is it even vaguely uncommon for regular traders to suffer varying degrees of despondency and anguish over trading decisions that continue to fail - no matter how much time, skill and effort they put into the job.

All of that is exactly why I came up with The Idiot. The Idiot is an Ego-destroyer without peer!

The Idiot reads nothing (except price bars), watches nothing, talks about nothing.

And yet ...

Well, here's the weekly Idiot applied to Miss Pollyanna. One of us made a lot of money trading this index. And it wasn't me. Even worse is the realisation it could, and should, have been me!

I do hope you all are smarter than I am!
click for larger image

Safe trading - RA

Randall Ashbourne
Astrological Investing's associate, Randall Ashbourne, author of the eBook, The Idiot and The Moon, and The Idiot and the Moon, Forecast 2013, writes a free weekly column titled, The Eye of Ra on his web site in  which he explains the potential impact of astrological aspects and the current state of technical conditions. Ashbourne's charts are revealing illustrations of exactly what has occurred in the market and the probability of what to expect.
Important reading:  Randall Ashbourne's The Idiot and The Moon, Forecast 2013 , Jupiter's cycle and its effects on Wall Street and a posting of the weekly Eye of Ra report in this blog, titled A look at the Venus Retrograde effect
(Disclaimer: This article is not advice or a recommendation to trade stocks; it is merely educational material.)
Copyright: Randall Ashbourne - 2011-2013

The Idiot and the Moon, Forecast 2013
  • Major trend change dates for the full year, plus a month-by-month breakdown of high-energy trading dates and critical reversal dates.

  • An index-by-index analysis of Moon Trading across major American, European, Asian and Australian stock indices-

  • Identifies the major indices where following the phases of the Moon can dramatically cut profits, or even result in large losses.

  • Old Gods & Gold ... a Eureka! discovery about exactly what drives gold prices during rallies and corrections and charts showing highly-reliable target levels to both the upside and downside.

These price charts are individually-tailored to each index and cover Wall Street, Australia, Canada, Hong Kong, Singapore, Shanghai, India, England, Germany and France.

You will not see these charts anywhere else on the Internet!

And much more...

It is NEVER too late in the year to have this monthly information!

Sunday, March 24, 2013

WP: USA, TSX, FTSE, DAX & ASX

Randall Ashbourne, an associate of Astrological Investing, posts a weekly market report on his web site, theidiotandthemoon.com The following is this weekend's Eye of RA report: Week beginning March 25, 2013

 Sun and Venus in Aries with Mars in Aries conjunct Ur sq PL
This weekend I'll update the Weekly Planets charts for a range of Western stock indices ... and do the same for Asian markets next weekend.

We have a highly critical week ahead going into the Easter break, with the Sun, Venus and Mars all making aspects to the Uranus-Pluto square.

We've discussed the implications of the Uranus-Pluto square at length over the past year or two.

Basically, it pits the forces of rebellion and radical change against the entrenched status quo protected by ruling elites. Pluto is big money and big power, big debt and big taxes; Uranus is the voice of "the people", though with the old weirdo in Arien mode these days, the voice is a little like Mao's dictum: Political power grows out of the barrel of a gun.

Squares are always an "action" aspect in astrological symbolism ... and even more inclined that way when the action signs, the Cardinal signs, are involved.

We've been seeing the signs everywhere since the aspect began; from the Arab Spring rebellions to the changes in China, from political angst virtually everywhere to banking crises almost everywhere.

And with Mars, now in its primary home sign Aries, being joined by the Sun and Venus, it adds a potentially explosive charge to the mix in the coming week.

So, we will take a look this weekend at some intermediate-range Weekly Planets charts for a range of Western indices. I'm not sure anyone can predict reliably what the Plutocrats have in mind for the Wall Street markets.

While the Dow has been making new highs and the SP500 keeps trying to, other markets ... and even the NDX ... display uncertainty.

Our first chart this weekend shows important planetary barriers which have a long-term impact on Pollyanna's prices.

click for larger image
Miss Polly has huge price gaps all over the place and you might want to consult last weekend's edition in the Archives if you missed it.

The media always promotes these surges as "investors piling back into the market". It's nonsense. "Investors" aren't sitting at their computers at 4.30am forcing a huge gap in opening prices. No, no ... that job falls to the computers run by the big banks.

Basically, the big banks which own the US Federal Reserve; and that would be the Fed that's printing $85 billion a month to deposit with its owners, while the political system struggles to make an annual cut of $85 billion to spending programs.

However, let's not concern ourselves with a political polemic. For the past couple of weeks, the SP500 has been stalled around a Jupiter-Neptune level ... and there are two primary (ie: strong) planetary lines not far overhead. The orange Node line is at 1572 and the cyan Saturn is at 1579. I would expect either of these to provoke a fierce reaction downwards if they're hit before there's a deeper correction.

click for larger image
The Nasdaq 100 remains below its peak from October last year - despite the optimisim of the DJI and Pollyanna. Both the signal line and histogram peaks in the fast MACD continue to send warning signals as the NDX continues to be stalled by an overhead Saturn.
click for larger image
Canada has been stalled for even longer than the Nasdaq - and, again, it's a combined Saturn/Uranus zone that's blocking a breakout.

And ditto with the DAX ...

click for larger image
London's FTSE is below. Note the difference in the state of the MACD. While the DAX is showing the same warning signals as the NDX, we're not seeing that build-up yet in the FTSE.

click for larger image
And the ASX 200 is below ...
click for larger image
I've mentioned in the past couple of weeks the negative divergence being displayed by the Canary on this index and regular readers will know this is a Neptunian index, so the false break and drop from the 5139 line isn't really an unexpected surprise.

And nor should be the price level which stopped the drop ...
click for larger image
It serves as a good example of applying, in real time, the technical lessons about gaps, Fib Rx and Fib Xt levels I went through last weekend.

I finished last weekend with these words: "You might not get a nice gold star from the teacher. Learn the lesson well, though, and you just might get a few gold bars - real ones ... that you earned for yourself!"

There are know-it-alls out there who'll happily bore you witless with their opinion that there is no such thing as "a Holy Grail" when it comes to making stock market profits. In fact, there are probably at least 100 of them. There isn't one that will guarantee you the exact top and precise bottom of every rally and decline.

But, I stand by what I said last weekend ... learn a few simple lessons really well and you'll learn how to make money.

Next weekend ... an update on Asia.

Safe trading - RA

Randall Ashbourne
Astrological Investing's associate, Randall Ashbourne, author of the eBook, The Idiot and The Moon, and The Idiot and the Moon, Forecast 2013, writes a free weekly column titled, The Eye of Ra on his web site in  which he explains the potential impact of astrological aspects and the current state of technical conditions. Ashbourne's charts are revealing illustrations of exactly what has occurred in the market and the probability of what to expect.
Important reading:  Randall Ashbourne's The Idiot and The Moon, Forecast 2013 , Jupiter's cycle and its effects on Wall Street and a posting of the weekly Eye of Ra report in this blog, titled A look at the Venus Retrograde effect
(Disclaimer: This article is not advice or a recommendation to trade stocks; it is merely educational material.)
Copyright: Randall Ashbourne - 2011-2013

The Idiot and the Moon, Forecast 2013
  • Major trend change dates for the full year, plus a month-by-month breakdown of high-energy trading dates and critical reversal dates.

  • An index-by-index analysis of Moon Trading across major American, European, Asian and Australian stock indices-

  • Identifies the major indices where following the phases of the Moon can dramatically cut profits, or even result in large losses.

  • Old Gods & Gold ... a Eureka! discovery about exactly what drives gold prices during rallies and corrections and charts showing highly-reliable target levels to both the upside and downside.

These price charts are individually-tailored to each index and cover Wall Street, Australia, Canada, Hong Kong, Singapore, Shanghai, India, England, Germany and France.

You will not see these charts anywhere else on the Internet!

And much more...


Wednesday, July 11, 2012

Backtesting the Mars-Uranus crash cycle

Randall Ashbourne, an associate of Astrological Investing, posts a weekly market report on his web site, theidiotandthemoon.com The following  is this weekend's Eye of RA report:    Week beginning July 9, 2012

There is a very famous American financial astrologer who makes dire predictions whenever Mars is about to make a harsh aspect with the old weirdo, Uranus. So, this weekend we're going to examine the historical reality of whether there really is a Mars-Uranus crash cycle, since we have the potential for one to develop in the next couple of weeks.

And we're also going to revisit some comments I made a month ago about Jupiter's sign change to Gemini shifting the money flows.

Overall, the high-energy days for the coming week are likely to be Thursday and Friday, when both Mercury and Uranus go Retrograde ... and the Sun moves in to square Saturn. But, it is the following week which is likely to be much more volatile as Mars, now in the Cardinal (action) sign of Libra, squares Pluto and opposes Uranus

The Sun square to Saturn, coupled with Uranus going Rx as it's fired up by Mars, do symbolise a major energy shift which has the capacity to turn markets and accelerate the moves.

But, before we get to that, I want to return to some comments I made about Jupiter changing signs to Gemini.

I said: "With Jupiter in Taurus, for example, the emphasis has been on banking and debt - the Taurus/Scorpio axis; and also on technology and gold, the Aquarius/Leo axis. I think most of you will agree that banks, brokers, Apple and gold have been the topics de jour for all the time the FatBoy has been in Taurus.

Slowly, you'll see a change; transportation, travel, health, labour and oil will begin to fill the news pages."So, this weekend we're going to examine the historical reality of whether there really is a Mars-Uranus crash cycle, since we have the potential for one to develop in the next couple of weeks.

Now, let me indulge in a little bit of basic astrology for those of you unfamiliar with the arcane details of The Spooky Stuff. Jupiter was head honcho of the Old Gods and is associated with all the good things - he expands whatever he touches.

So, while he was in Taurus and opposing Scorpio, the banks and debt got exaggerated ... and because the FatBoy was squaring the Leo/Aquarius axis, the effect also impacted on gold and the technology sector.

In early June, I indicated the emphasis would start to change. Gemini rules transportation and the media; Sagittarius rules foreign travel, universities and the law; Virgo is labour, accountancy, health; and Pisces rules oil, shipping, hospitals, prisons and (with Virgo), big pharmaceuticals.

The effect of Jupiter is to expand either the supply OR the demand. I really want to emphasise that point ... the supply OR the demand.
Several news reports caught my eye during the week.

NEW YORK - US stocks have racked up solid gains in a holiday-shortened trading session, boosted by reports of strong June sales from the leading US auto makers.

Data showing that car sales in Germany are resisting the eurozone crisis drove Frankfurt's DAX 30 index up 1.26 per cent to 6,578.21 points.

DETROIT - The Big Three US car manufacturers have reported strong domestic sales for June, capping a solid first half of the year even as US economic growth overall remained weak.

DETROIT, July 3 AP - General Motors Co said its US sales rose 16 per cent in June on solid demand for small and midsize cars.

PARIS - US aircraft maker Boeing has raised its 20-year forecast for global demand for airliners by $US500 billion ($A489.21 billion).

We've also been treated to plans by News Corporation to split itself into two divisions. And, there was a very interesting story about how a massive fleet of Chinese coastal shipping - somewhere between 1500 and 2000 cargo vessels - is now competing for traffic volume worldwide because trade between northern and southern China has declined massively.

So, this is an example of how it works. Jupiter in Gemini squares the sign of Pisces, which rules shipping, and the SUPPLY of ships suddenly becomes terribly exaggerated.

Jupiter opposes Sagittarius, the sign of foreign travel, and Boeing gears up for a big increase in DEMAND.

Jupiter enters Gemini, the transportation sector, and the DEMAND for new cars surges ... or the world's biggest media conglomerate splits into TWO (always a Gemini signature!).

I revisit this issue because a sign change by Jupiter is one of the more reliable astrological predictions ... the money flow WILL change to different sectors, either the supply OR the demand will escalate dramatically in those sectors ... and there are substantial profits to be made by getting out of the former and piling into the latter.

So, it could prove to be worthwhile to look at the technical state of the charts for car manufacturers and transport companies (including railroads), big pharmaceutical companies, oil companies, media stocks, airlines ... and any companies associated with supplying services to either them, or hospitals, prisons etc.

***
Okay, now let's turn our attention to whether or not there really is a RELIABLE Mars-Uranus crash cycle. We'll concentrate purely on the opposition aspect, since that's the one due to become exact in the next couple of weeks. I do need to emphasise that this next one occurs with a simultaneous square to Pluto, so is more likely than usual to have an impact, especially since all three planets are in the early degrees of Cardinal signs.

We will begin by examining the impact on the SP500 in recent years.
Mars opp Uranus
click for larger image
We're looking at a weekly chart of the Pollyanna index and the Mars opposed Uranus aspects are marked with red bars. And it's immediately obvious that the aspect does NOT necessarily provoke a market crash. Of the seven instances marked on the chart, only two turned up near important Highs. Four of them occurred nearby important Lows.
What gets some astrologers overly-excited, is that it was one of the aspects in effect at the start of the Great Crash.
click for larger image

The chart above shows the Dow Jones Industrials from the late 1920s to early 1970s - and one can see why the arrival of Mars opposed to Uranus sets the alarm bells ringing. The aspect does have an overall tendency to occur very nearby the start of some very bad crash cycles.

But, it's not a certainty, as we can see in the chart below, which covers the Great Sideways Shuffle period in the DJIA from the early 60s to early 80s.

DJIA 1960's
click for larger image
Okay, it's almost time to stop waffling on about les Spookies and turn our attention to the techie charts. The point I wanted to make is that astrology does have its uses. There are some things it is very good at predicting reliably - which is the sector shift caused by Jupiter changing signs.

And there are other things which get some astrologers very, very excited ... but which are a tendency, rather than a reliable certainty.

At the risk of boring you all silly, I will repeat the mantra again ... Astrological expectations do NOT over-ride technical conditions!

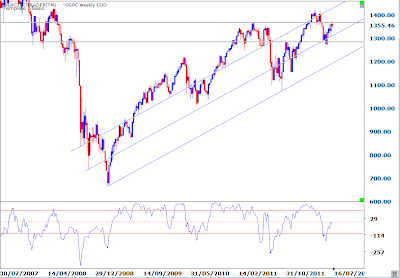
GSPC-Weekly EOD
click for larger image
As I said last week, there are only two really important horizontal lines of Support/Resistance for the 500 ... and, GeeGolly, looks like they continue to be important, eh?


And we've been discussing this one, too, for the past few weeks - expecting she'd face some hurdles at the 1340s and 1360s. We have some relatively mild divergence showing up at last week's pre-holiday peak in the height of the MACD histograms ... and the potential is showing on the earlier weekly chart for the intermediate-range Canary to be turned down from a hit of the Zero line.
Support/Resistance SPX
click for larger image

Let's go to London's FTSE.

click for larger image
I introduced this chart a few weeks ago to show the potential for a the index to launch a rally from contact with the rising (diagonal) Sun lines ... but I'd like you to compare the planetary chart with the technical one below.
And the reason is I want to emphasise to those of you on a budget that you don't need really fancy software. In the chart below, the bounce came from a hand-drawn trendline, which then allowed us to set up some Fibonacci Retracement targets. Targets which have worked very well!

click for larger image
All of this comes back to the point that trading profitably does NOT have to be terribly difficult. WE make it difficult by clogging our brains with crap. Simple works! Simple works really bloody well. Shut out the noise ... pay attention to the simple charts you've drawn for yourself ... watch for divergence in the oscillators when Price is hitting predetermined levels of Support or Resistance.

I'll leave you once again with Auntie's Weekly Planets chart for the ASX 200.

click for larger image

Safe trading - RA

Randall Ashbourne
Astrological Investing's associate, Randall Ashbourne, author of the eBook, The Idiot and The Moon, writes a free weekly column titled, The Eye of Ra on his web site in  which he explains the potential impact of astrological aspects and the current state of technical conditions. Ashbourne's charts are revealing illustrations of exactly what has occurred in the market and the probability of what to expect.
Important reading:  Randall Ashbourne's article, Jupiter's cycle and its effects on Wall Street and a posting of the weekly Eye of Ra report in this blog, titled A look at the Venus Retrograde effect


(Disclaimer: This article is not advice or a recommendation to trade stocks; it is merely educational material.)
Copyright: Randall Ashbourne - 2011-2012