Showing posts with label The Idiot and The Moon. Show all posts

Monday, October 2, 2017

The Idiot and the Moon

Information is not Knowledge – and Knowledge is not Wisdom -Einstein/Kappa


Excerpt from The Idiot & the Moon, by Randall Ashbourne

INTRODUCTION: "The last thing I learned was the first thing I knew.
Somewhere between then and now, I’d forgotten – drowned in a daily deluge of data and information, cunningly disguised as knowledge.

But, it was not. It was a long way from being knowledge and farther still from being wisdom.
So, this book is an attempt to begin at the beginning – at least so far as stock trading is concerned. And we begin with just two thoughts:
· ALWAYS protect your capital
· I am NOT as smart as I think I am
It’s not a big book, but I hope it distills many years of information accumulation into a taut collection of useful knowledge that you, in turn, may be able to convert to trading wisdom.

Its primary purpose is to outline the rules of a simple trading system – a system so simple and so easy to follow that I call it: The Idiot.

It will take only a few minutes of backtesting on your part to see that it does work; it will protect your capital; it will deliver enormous profits without agonising, analysis, or angst; it will limit your losses; and it will prove itself to be a lot smarter than you think you are.

But wait … there’s more.  As they say in the tackier TV commercials.

I will also outline the details of a Lunar Cycle trading system that will also help you to make profits and to avoid costly mistakes. And I will show you advanced and original techniques using unique planetary software to determine the probable start and finish prices of intermediate and long-term moves in some of the world’s most widely-traded stock indices.

And I will show you how to make the most use of some simple technical indicators, unlike some others who tell you what they are, but not how to tweak them and interpret their signals and secrets.

The book is written for those who, like me, forgot the first thing they knew – but, also, for everyone just starting out learning how to trade stock markets.

The simple truth is that most traders lose money. If you remember the first two thoughts and learn to follow The Idiot, or even only The Moods of the Moon, you will not be one of them."
- RA
***

Orders are processed manually.  
Please allow time to receive your email to download your eBook. Thank You!

NOTE! The Idiot & The Moon is a password and print protected eBook formatted for "READ ONLY" in the popular Adobe PDF format.  IT CAN NOT BE PRINTED - IT MUST BE READ ON A COMPUTER, TABLET, OR OTHER TYPE OF ELECTRONIC DEVISE.  You will be able to transfer the downloaded PDF file into your iTunes library and read it in iBooks on your iPad or similar device that reads Adobe formatted PDF's. And you will be able to highlight key sections or add "sticky notes" to the file.

Saturday, January 2, 2016

2016 ... beware of the Bear


Randall Ashbourne, an associate of Astrological Investing, posts reports and articles on his web site at  theidiotandthemoon.com   The following is this weekend's Eye of RA report: Week beginning January 3, 2016
Best wishes to everyone for a happy and prosperous 2016, though if you're counting on stocks to provide either happiness or prosperity, you'll need to be very nimble.
2015 has ended with very few worldwide stock indices holding onto the gains they made early in the year.v

Many commentators, even the optimistic ones, expect more trouble and few gains to be made in the coming 12 months.

From a contrarian point of view, there are ... perhaps ... too many people calling an end to the Bull run and a return of the Bear; the market rarely does what the majority expect and forecast.

Still, even the best Elliott Wave analysts now believe the end of this very long-running Bull market (at least for the American indices) is only a rally or two away from starting.

It is distinctly possible that some stock markets are already in its grip. Over the next week, I will try to bring you up to date on all the major markets ... starting today with Wall Street's SP500 and Australia's ASX200.

My apologies for my prolonged absence during the past few months. I am still ill and no longer have the energy to write regular columns.

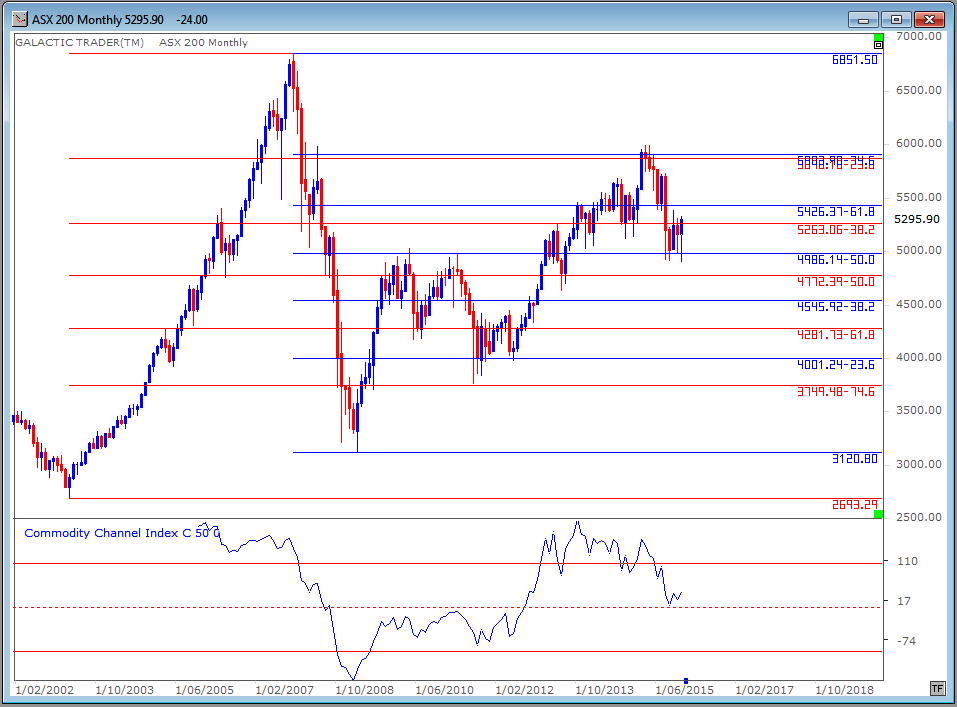
Bear markets tend to be defined in line with the percentage crash from their Highs. The Australian stock market has been one of the world's real laggards in terms of its Bull run since the last Bear terminated in 2009.

The ASX200 made a double top at $5996 last March and April. In the next 4 months, it crashed a tad more than 17.5% from the High and has made four "tests" of that crash level, with December finally making a bounce from the obvious ... contact with a rising trendline.


The Idiot remains on a monthly Sell signal. Big Bird, the 50 CCI oscillator marked with a blue line in the lower panel, has plunged below the +100 level. There remains some hope for a rally in the first part of 2016; we have a bounce from the long-range trendline, Big Bird appears to have made a Zero Line Rejection (ie: it has bounced higher from the red, dotted zero line which tends to indicate a reliable bounce) and Fast Bird, the green line, has spiked above Medium Bird (the red).

Now let's take a look at the Pollyanna index, the SP500, using the alternative Bi-BB method recommended in The Idiot & The Moon. The August mini-crash took the index down 12.5% from its High. The fast MACD remains in clear Sell mode.

Nor is Pollyanna's Big Bird singing a happy song. In the chart below, take special note of what happened to this index when that blue oscillator line plunged below the red +100 line after the two previous Bull peaks. The alarm bells are screaming. Very loudly.

Thankfully, we have some tools which can be used to help us trade these volatile markets. The ASX200, for example, has been making regular stops and reversals at two sets of Fibonacci Retracement levels ... the blue ones from the 2007 peak to 2009 low, the red ones from the strong Bull market leading into that 2007 High.


These are long-range markers and should be used to inform any short or medium term trades you may be considering. In other words, if your daily and weekly charts are starting to show oscillator or momentum weakness as the price rises into any of these Fibonacci Rx targets you need to be very careful about staying Long ... and also need to move your Loss Stops much closer to the current price action at the time.

And we also have my long-range planetary price charts which can be used effectively for price targets ... up or down. The ASX 200 is quite simple. You know from past columns and the book that it is an index with a very strong relationship to Neptune.

Those price lines are marked with both grey and orange lines on the chart below and while there are often overshoots, the reliability of using Neptune prices as targets for moves in both directions, I think is too profitable, and too regular, to be ignored. Again, use these long-range targets to inform your decisions when daily and weekly charts are showing positive or negative divergence and the strong chance of a looming trend change.


And the same is true of the SP500.


In Forecast 2015, I published a basic Elliott Wave diagram, where a Bull run is made up of 5 large waves, with (1), (3) and (5) being the major rally phases and (2) and (4) being the downtrend waves. I marked last year with a red arrow, indicating we were nearing the end of 5 intermediate waves within a long-range 3 rally and that would normally be followed by a major wave 4 correction.

That appears to have happened fairly accurately. If it remains so, we start 2016 at about where I have placed the black arrow. In short, the good times are running out of room and time.

Do NOT go to sleep at the wheel any time during 2016.


Safe trading - RA
Randall Ashbourne (Disclaimer: This article is not advice or a recommendation to trade stocks; it is merely educational material.)
Copyright: Randall Ashbourne - 2011-2016


The Idiot and the Moon, eBook, available for purchase

Sunday, August 16, 2015

Aussie market nearing a potential bounce

Randall Ashbourne, an associate of Astrological Investing, posts reports and articles on his web site at  theidiotandthemoon.com   The following is this weekend's Eye of RA report: Week beginning August 17, 2015 
The month of August is showing its habit of being a wild month for stock trading.
On Wall Street, the Dow Jones Industrials have been in downtrend mode since May, but the Pollyanna index has been bouncing around in a trading range for all of 2015.

Astrologically, we have a couple of major events. This weekend has Venus, the ruler of money and material wealth, in the middle of its current Retrograde phase.

And the head honcho of the Old Gods, Jupiter, has now changed signs ... moving from extroverted Leo into the far more discreet and discerning symbolism of Virgo. Jupie loves the Fire signs, especially Leo, which is associated with gambling and speculative profits.

The symbolism of Virgo is much more picky. It always want to see the evidence on the books ... books attended by accountants and subject to nit-picking auditors.

We should see an accelerated shift in support for some sectors and a withdrawal from others. Since Virgo rules health stocks, it might be worth studying those charts more closely than usual.

I'm going to concentrate in this edition on the position of the Australian stock market ... with a quick look at the SP500 and the DAX. In the last edition on July 13, I published the following chart and warned the ASX 200 was heading into a major hurdle.

It was a major set of downtrending inner planet lines ... Sun, Mercury, Venus and Mars ... which had a strong track record of sending the index into a dive.

This was the chart:
I said in that edition: "The trouble will come if the index rises into around $5700 by the end of the month."

And this is what happened. On August 4, two trading days after the end of the month, the ASX 200 hit a momentary spike high of 5727 ... and then its wings fell off.
Which brings us to the potential good news. On the chart above, I've now included a set of rising primary planet lines. As we did last time, take a look over on the left of the chart.

The ASX flopped down until it made contact with a rising (pink) Mercury line ... and a new one of those is now very close to the current price action. There's no certainty the rising Mercury will be strong enough to change the downtrend back into full-on rally mode, but we can use some other techniques to get a sense of where the drop will stop.

Firstly, let's take a look at a weekly Bi-BB chart. The use of Bi-BB charts is outlined in The Technical Section of The Idiot & The Moon, and is one of the two most strongly-recommended techniques for trading safely.

The first thing to take note of is the distinctly higher trough developing in the histograms of the fast MACD oscillator ... positive divergence. The second is the projection being made by the Fibonacci extension tool.

A corrective downtrend tends to make what Elliott Wave analysts describe as an ABC pattern, where A is the first wave down, the B is a bounce, and the final downleg is the C wave. We appear to be well into the C wave.
 It is not at all unusual for the C wave to be some level of Fibonacci projection of the A wave. The index ended last week with a touch of the 618 extension of wave A. Often A and C are close to the same length and if that holds true this time, the ASX is headed to the 5100s before either a major uptrend, or even a resumption of the overall Bull trend, starts.

We have a couple of alternative price targets to watch using Auntie's Weekly Planets chart, which most of you are now thoroughly familiar with.
Our Big Bird oscillator is in a dive, strongly suggesting there is more downside to come before a reliable and safe bounce can take hold.

Traders should be very cautious if any bounce in the next week or two cannot close decisively above those two blue Saturn lines which have just failed to hold the price lows. The price levels around 5200 and 5100 should also be monitored for bounce potential should the decline continue.

Turning now to the SP500. I went into its position at some length in the July 13 edition and not much has changed, so you can have a look at that report in the Archives if you need a refresher on the price targets to watch.

We are on the verge of getting a preliminary sell signal using the monthly Idiot chart. Pollyanna is still trying desperately to hold the upper tier line on the monthly Bi-BB chart, but both the fast MACD signal line and histograms have gone negative, so traders do need to be really cautious opening new Long positions on the 500.
Germany's DAX continues to be Europe's outperformer, but it is also into a multi-month correction. The chart below is its long-range planet price chart.

It's playing inside a Pluto/Neptune price zone ... and it has a history of doing so. It occurred during the 2007 Bull peak and the 2009 Bear bottom.
There is much talk about the woes of the Australian market being heavily under the influence of how China is going. It's an easy explanation for the talking heads, who seem to overlook the fact that Australia didn't soar with the eagles when Shanghai went into a major Moon shot this year.

I'd rather trust the planets! And the Idiots. Long story short ... if Auntie goes into bounce mode shortly, hitching a ride on the rising primary planet lines, so too will the other Western indices.

Safe trading - RA
Randall Ashbourne (Disclaimer: This article is not advice or a recommendation to trade stocks; it is merely educational material.)
Copyright: Randall Ashbourne - 2011-2015


Read Randall Ashbourne's FREE report
THE IDIOT AND THE MOON FORECAST 2015
Astrological Investing's associate, Randall Ashbourne, is the author of the eBook, The Idiot and The Moon,  Ashbourne's Galactic Trader planetary charts are revealing illustrations of exactly what has occurred in the market and the probability of what to expect.

The Idiot and the Moon, eBook, available for purchase

Monday, February 2, 2015

Mercury Rx and the ASX 200 2015 Overview

Randall Ashbourne, an associate of Astrological Investing, posts reports and articles on his web site at  theidiotandthemoon.com  The following is a copy of his recent report and a link to download his ASX 200 Targets and Technicals 2015
We are currently in the middle of the first Mercury Retrograde cycle of the year.

It happens a few times, for a few weeks, each year and they tend to be periods where stock markets are choppy ... with changes in direction every few days.

Communications can easily become miscommunications during Mercury Rx ... and not because the planet is "doing" things.

Rocks and giant gas balls Out There are just ... there.

The astrological symbolism is that WE tend to become inattentive and prone to making silly mistakes during these periods.

For the moment, I have nothing to add to the 2015 Forecast published in January. However, I am slowly working on reports for individual indices and can now include the 2015 outlook for the Australian stock market.

The report includes long-range, intermediate and short-term targets and is a PDF download.
ASX 200 Targets and Technicals 2015
http://www.theidiotandthemoon.com/asx2002015.pdf 
   

NB: It contains one black chart. So don't print, without excluding that page!  

Safe trading - RA

Randall Ashbourne (Disclaimer: This article is not advice or a recommendation to trade stocks; it is merely educational material.)
Copyright: Randall Ashbourne - 2011-2015


Astrological Investing's associate, Randall Ashbourne, is the author of the eBook, The Idiot and The Moon,  Ashbourne's Galactic Trader planetary charts are revealing illustrations of exactly what has occurred in the market and the probability of what to expect.


The Idiot and the Moon, Compleat & Utter Lunatic Idiot's Guide to Trading Stocks,


Sunday, September 7, 2014

Venus takes a swim, Mars catches Fire

Randall Ashbourne, an associate of Astrological Investing, posts a weekly market report on his web site, theidiotandthemoon.com  The following is this weekend's Eye of RA report: Week beginning September 8  2014 

This will be an interesting week in the markets in spite of the ceasefire negotiated to bring Ukraine off the boil.

I indicated last weekend that Wall Street was likely to be volatile in the shortened week following the Labor Day holiday and we'll look at exactly how that panned out in a moment.

There is the potential for danger dead ahead. One of the most accurate Elliott Wave theorists on the web believes American markets are about to go into correction.

And Clif Droke, who is both an expert in Kress cycles and financial astrology, is forecasting a decline into October or, at best, a continuation of a sideways range.

Both of them believe there will be a strong resumption of the Bull trend in the later part of the year.

This week begins with a Harvest Full Moon. Mercury will square Pluto and oppose Uranus; Venus will oppose Neptune midweek; and Mars moves out of Scorpio into the Fire sign, Sagittarius, next weekend.

Normally, the Full Moon is a statistical low point. It might not work this time.
Let's look first at the historical track record of Venus opposing Neptune and Mars entering Sagittarius. In terms of Greek mythology, Venus and Neptune are buddies. 

Venus was born when Saturn castrated his poppa, Uranus, and threw his manly bits into the ocean. There was a bit of froth and bubble, Venus popped up, and Neppy rescued her from the waves and took her back to shore in his chariot.

So, aspects between Venus and Neptune have a tendency to be relatively benign. The reality doesn't always match the expectations; Venus-Neptune oppositions occur near peaks, as well as troughs. There has been only one previous occasion in the past few years where the aspect occurred simultaneously with Mars moving to Sadge ... it concided with the sudden drop in October, 2012.


Now, last weekend I indicated there was some danger to the SP500 rally because it had peaked the week before very close to the price of a Sun-Neptune crossing.

I said: "So, when Wall Street opens on Tuesday, the big boys' computers are going to have to force a gap above $2004 ... or the index will be in danger of starting a dive."

That is exactly what happened. Pollyanna gapped-up to open at almost $2006 when Wall Street went back to work on Tuesday.

And it gapped-up again the next day.

You can see just how volatile the shortened week was by the range of the price bars.

That's probably just a small taste of what is to come over the next few weeks.

There is a battle going on to control the immediate future of stock prices.

That battle is perhaps even more obvious when we return to the wider view of where Pollyanna is positioned in relation to primary planet prices. Breakout above the falling, dark green Venus opens targets at 2028 and rising Mars in the 2040s; a breakdown suggests the 1970s or 1960 before strong support comes back into play.


The ASX 200 is still having trouble climbing above, and staying above, its Weekly Planets Neptune barrier, now priced around 5640.


The rise in the value of the American dollar caused another sharp slump in the price of greenback gold. There is potential support from a secondary Pluto and a rising Sun line not far below.


Safe trading - RA

Randall Ashbourne (Disclaimer: This article is not advice or a recommendation to trade stocks; it is merely educational material.)
Copyright: Randall Ashbourne - 2011-2014


Astrological Investing's associate, Randall Ashbourne, author of the eBook, The Idiot and The Moon, and The Idiot and the Moon, Forecast 2014, writes a free weekly column titled, The Eye of Ra on his web site in  which he explains the potential impact of astrological aspects and the current state of technical conditions. Ashbourne's charts are revealing illustrations of exactly what has occurred in the market and the probability of what to expect.


Important reading:  Randall Ashbourne's The Idiot and The Moon, Forecast 2014  


  Purchase Forecast 2014 and receive a special report on GOLD   

Saturday, April 5, 2014

One swallow does not a summer make

Randall Ashbourne, an associate of Astrological Investing, posts a weekly market report on his web site, theidiotandthemoon.com  The following is this weekend's Eye of RA report: Week beginning April 7, 2014 
And Friday's rather dramatic turnaround for Wall Street stocks ... and gold ... doesn't necessarily signal The Turn for either of them.

It is possible, for a whole range of reasons on both technical and astrological levels.

But we are dealing in both cases with markets that are heavily manipulated.

We have been discussing for some time, in the Eye and in Forecast 2014, the special danger posed by April ... and that danger has been growing because of the negative divergence building in the oscillators on weekly and monthly charts.

We'll concentrate this weekend on trying to work out whether this is just another part of the big boys' game, or whether the tide has finally turned.

Normally, I do not give too much weight to a single day's trading. But, if this one is a real "false break", it could be the start of a major downswing that could get very ugly for those caught unprepared.

We'll deal firstly with something I warned about in Forecast 2014 and have discussed specifically a couple of times in the Eye this year, including only last weekend.

We looked last weekend at last week's Sun transits to Jupiter, Uranus and Pluto as a possible precursor to what might happen later in April when Mars, Jupiter, Uranus and Pluto align in a Cardinal Grand Square. You might want to refresh your memory by reading last weekend's edition again.

There is a chance that those Sun transits have acted as a "trigger". So, let's begin this weekend by looking at the bigger transits, the major component of which is Jupiter in Cancer opposing Pluto in Capricorn while squaring Uranus in Aries.

The first chart is a multi-decade view of the SP500 with Jupiter square Uranus marked in red bars, Jupiter trine Uranus marked in green bars, and Jupiter opposed Pluto in blue bars.

As I've indicated before ... these are dangerous. In one guise or another they were there leading into the 1987 flash crash and again at the two previous Bull market peaks.


We can zero-in on the next chart to get a closer view. We are now in the month of Jupiter's third and final "hit" of squaring Uranus AND it concides with an opposition to Pluto. In 2000, the Bear had started to bite with the red square to Uranus and then the real mauling began with the first of the blue oppositions to Pluto.

The third hit of the square to Uranus in 2007 brought the Bull top and a rapid Bear mauling. Now we have the same aspects again.


On top of those omens, we have what might be a "false break". This is when price temporarily breaks through an important barrier and goes into a sudden and largely unexpected reversal. False breaks always provoke very fast moves in the opposite direction. A number of times this year we've discussed the real trouble Pollyanna was having trying to break free of an overhead primary Pluto barrier on her daily charts.

Last Tuesday, the overnight computers went to work - forcing a gap Open on the index to get it above that barrier. But, it didn't last.


And that's what makes Friday's action ... a new, all-time High, followed by a fast and dramatic reversal ... so dangerous. Because, that Pluto line is an important long-range barrier, not just a daily hurdle.

The two previous Bull peaks also occurred at a long-range Pluto line. Trace backwards the one marked with the $1518 price tag and you'll see what I mean.


The upshot of all this is basically what I said in last weekend's headline ... April may be "it". Let's not get married to the idea to the exclusion of all else.

It is, so far, just a single day's trade. But, if this is a real false break, the stock markets could turn really ugly, really fast.

On the flip side, gold has turned northwards within the fairly narrow price range we anticipated should bring about a bounce. All of the big picture stuff is in the special gold report I sent out a couple of weeks ago.

You know I was expecting a down move to retest the validity of the rising primary Sun line - and that, too, is in last weekend's edition.

Here is the update.


We talked about a potential hit of the $1273 level, the intersection of a secondary Pluto horizontal with the rising Sun line. And I also said: "There is no guarantee it will be hit, however, since Friday bounced from another "obvious" level - the 50% retracement marker of the post-December rally. This could be an important level, and if it can hold, leaves gold in a position to mount another strong rally leg."

 And here's what happened.


The 50% retracement level was broken by only a small amount and only relatively briefly. It is another example of what happens with a "false break".

As I said last weekend, the 3 Birds in the oscillator panel were signalling a potential turnaround in the gold price and that the Birds were already stacked in approaching rally mode for a lot of individual gold mining stocks. And now they're stacked that way for gold itself.

It's too early to say with any real degree of certainty that the long-range tides have turned for both stocks and gold. But the evidence for exactly that scenario has been building for quite some time - and much moreso on stock indices other than those on Wall Street.

Individually, we need now to check the charts - monthly, weekly and daily - on all the stocks we are holding.

And we need to remember the very first rule of survival: Always protect your capital. 

Randall Ashbourne

Safe trading - RA
Astrological Investing's associate, Randall Ashbourne, author of the eBook, The Idiot and The Moon, and The Idiot and the Moon, Forecast 2014, writes a free weekly column titled, The Eye of Ra on his web site in  which he explains the potential impact of astrological aspects and the current state of technical conditions. Ashbourne's charts are revealing illustrations of exactly what has occurred in the market and the probability of what to expect.
Important reading:  Randall Ashbourne's The Idiot and The Moon, Forecast 2014
(Disclaimer: This article is not advice or a recommendation to trade stocks; it is merely educational material.)
Copyright: Randall Ashbourne - 2011-2014


Purchase Forecast 2014 and receive a special report on GOLD

Saturday, March 8, 2014

Still in search of some certainty

Randall Ashbourne, an associate of Astrological Investing, posts a weekly market report on his web site, theidiotandthemoon.com The following is this weekend's Eye of RA report: Week beginning March 3, 2014 
in search of certainty
Gee,Zeus! It's like trying to herd cats! Some markets are flying north ... others seem to have gone for a long walk on a short pier.

In the USA, the Russell, the 500 and the Nasdaq 100 have again hit new highs ... while the Dow Jones Industrials and Transports continue to lag.

Other markets, as diverse as Argentina, France, Denmark, New Zealand and India all rode to new highs ... while Britain and Germany heard the word "Crimea" and went into a funk.

Maybe they just have a genetic memory that getting involved in that particular piece of land tends not to end well for either of them.

I ended last week's edition with the words: "The next move isn't obvious ... well, it's not to me. I lean more towards a probable decline, but there is a danger in getting married to that expectation. Hopefully, the next few days will provide greater certainty."

I'm really not sure they have provided greater certainty ... not with a few indices going higher and other major ones going lower.

So, we'll go to some charts and try to get some sense of the possible, if not the probable.

The star performer last week was India, Mumbai's Nifty index finally broke free of planetary price resistance clustered near the 6400 level.

It has run into another line of resistance. There are no screeching warning sirens from the oscillator on a weekly basis and if the index can now hold the next minor correction no lower than the early 6400s, much higher prices can be expected.

Somebody mentioned Florence Nightingale and the Charge of the Light Brigade to London's FTSE and the teapots tumbled to the floor.

The FTSE has been having a LOT of trouble getting through these weekly Saturn lines; and there's nothing in the oscillator readings to give a clearcut indication of which way the index will break.

Similarly, the ASX 200 could break either way. Auntie's daily All Planets chart is below. It didn't make a precise touch of either of the light blue Saturn lines last week.

Monday dived and bounced back into a Venus support line; Tuesday couldn't decide whether to breakout above a downtrending Venus; and Wednesday jumped above it.

If the index can clear 5511 decisively in the coming week, new highs are on the cards, since there should be a relatively easy run higher into the 5600/5700s.

Now, let's turn our attention to the Paris Hilton of stock indices ... Miss Pollyanna, the SP500. She finished the previous week with a touch of the Neptune line at 1864 ... dived on Monday ... and went on a tearaway on Tuesday.

These are daily bars on a Weekly Planets chart for the index and a breakout opens a target zone from 1917 to 1932.

It would probably take some good news to get there quickly, however. We've been talking about how the 500's weekly Bollinger Bands had started to tighten. They're now opening wider again ... but with a breach of the upper outer barrier.

We've been discussing Bi-BB trading at some length since early in the year. I've circled each of the Bi-BB breaks on the chart below. Every one of them, even the little ones, either stalled the uptrend, or provoked a correction.

Gold. Now, I haven't forgotten that I did promise to compile a special report. I'll get it done in the next 2 weeks. In the meantime, there is a chance the correction is over and gold is on a new multi-year Bull run.

And the reason I say that is because I'm a silly old bugger who plays with planets. And, as I explained in Forecast 2013, my research tells me the Sun drives gold between Pluto stations.

The thick green lines on the chart below are primary Sun lines. And gold has now completed its fourth week outside the primary channel which constrained almost all of the downside and upside price action since the great drop began in 2011.

Okay, so that was a big picture. Now, let's return to the daily. Short story ... still climbing the Sun line and trying to hold the 1336 Pluto to make a run at a stronger 1363 Pluto.

And ... we're probably about to see a fast move. Remember the lessons from the past few weeks ... tightening bands provoke a fast move and the first move is usually in the wrong direction.


Safe trading - RA
Randall Ashbourne
Astrological Investing's associate, Randall Ashbourne, author of the eBook, The Idiot and The Moon, and The Idiot and the Moon, Forecast 2014, writes a free weekly column titled, The Eye of Ra on his web site in  which he explains the potential impact of astrological aspects and the current state of technical conditions. Ashbourne's charts are revealing illustrations of exactly what has occurred in the market and the probability of what to expect.
Important reading:  Randall Ashbourne's The Idiot and The Moon, Forecast 2014
(Disclaimer: This article is not advice or a recommendation to trade stocks; it is merely educational material.)
Copyright: Randall Ashbourne - 2011-2014