Showing posts with label gold. Show all posts

Sunday, October 19, 2014

Fleshing out the 2 main scenarios

Randall Ashbourne, an associate of Astrological Investing, posts a weekly market report on his web site, theidiotandthemoon.com  The following is this weekend's Eye of RA report: Week beginning October 20, 2014 


 Stock markets began bouncing late last week, but it is likely only a relief rally which will be relatively short-lived.

We have a couple of key astrological aspects taking place during the coming week.

The most powerful of these is the solar eclipse New Moon due to occur on Thursday evening in Euro-America and early Friday morning in Asia.

It will take place in Scorpio just after both the Sun and Venus enter the sign.

It's the presence of Venus which will make this eclipse particularly powerful. Scorpio rules debt, taxes and most especially really BIG money. Venus rules material wealth and, according to traditional astrology, tends not to act benignly when travelling through Scorpio.

The other significant aspect is that next weekend Mercury will finish its current retrograde phase.

I indicated last weekend that Mercury Rx can manifest as a head fake. However, I also outlined the two main scenarios now facing markets ... either the Bull is dead and we are now in a new, long-running Bear ... or, this is a major correction likely to run for weeks or months before this post 2009 Bull phase puts on another major rally leg.

So, we'll spend a little time this weekend fleshing out those two main scenarios. I said last weekend that under the major correction scenario, the target for the decline could be as high as $1878 or as low as $1776 on the Pollyanna index, Wall Street's SP500.

I should have said "this" decline, meaning the first leg of of a three-legged decline. It can morph into a five-legged triangle pattern, but that is a level of Elliott Wave complexity which tends to be more confusing than helpful.

In any case, I showed you the long-range planetary price targets which should prove to be important throughout the correction and here's the update.

We now need to see exactly what sort of completed bounce we get before we can even think about predicting targets for the next major leg down.

What we do know is that this is now the second biggest correction on Pollyanna since this Bull market launched itself in 2009.

A lot of commentators are all Awoe! Alas! because the index has broken down below its long-term trendline. Well, yes and no at this stage. Personally, I think log-scale charts tend to be more accurate for an "eyeball" look at the long-range ... and on that chart, Polly is trying to cling on.

The log-scale chart shows how the price has been constrained within a rising wedge ... the thin, red topside trendline and the thick, blue support trendline.

I don't think there's any question that blue trendline is going to be broken decisively. The MACD signal line has gone negative and the peaks in the histograms have gone from mountains to molehills over a long period while the price went higher. Negative divergence.

But, even when the trendline is finally broken, it doesn't necessarily stop the Bulls from launching a rally to do what's called a "kiss back" of the underside of the line before it all then starts really crashing.

Turning now to my home market, Australia. I said last weekend: "Regular readers will know that Auntie is a strongly Neptunian index over the long term, even as she responds to Saturn lines during weekly moves.
 

The next potential Neptune "rescue" level is very nearby, priced around $5150. Note that the index topped out at the $5650 level, so $5150-ish is both a legitimate target and potentially quite strong as a Support level."

And the old bat did exactly as expected ...

The break of the 5150 Neptune level was very short-lived. I'll show you on my daily All Planets chart for the ASX200 below. Now, do NOT try to print this chart, dear reader. Your printer will run out of black ink. Right-click the chart and save it as an image ... and then you'll have a ready-reference guide to help you through the bounce.

As you can see, Auntie topped out with some dithering around the Neptune line in the 5600s and then followed Sun and Venus lines down into the pile-up of coloured spaghetti near the lower 5150s Neptune.

But there were were only intraday breaks below Neptune on Monday and Tuesday. Even Monday managed a close above the line, setting us up for what I'd indicated was a potentially strong Support level.

For a bounce, dear reader, but probably not a complete change in trend.

And finally for this weekend, a quick look at gold and the Sun-Pluto chart most of you will be familiar with.
Earlier in the year, greenback gold found Support at the 1248 Pluto line ... which is now Resistance. However, on the bright side, notice the performance of the Big Bird oscillator.

While the price plunged lower, Big Bird has been steadily making higher troughs. It's a build-up of positive divergence which should have enough power to drive gold prices higher over the next few weeks.

Now I still haven't created a 4Q Archives page ... so you can access the previous two October editions of the Eye from the buttons below.  In the meantime, if you missed the previous two October editions, or want to re-read them, you can access them from the website http://www.theidiotandthemoon.com/eyeofra.html or scroll down in this web site's blog.

Safe trading - RA

Randall Ashbourne (Disclaimer: This article is not advice or a recommendation to trade stocks; it is merely educational material.)
Copyright: Randall Ashbourne - 2011-2014


Astrological Investing's associate, Randall Ashbourne, author of the eBook, The Idiot and The Moon, and The Idiot and the Moon, Forecast 2014, writes a free weekly column titled, The Eye of Ra on his web site in  which he explains the potential impact of astrological aspects and the current state of technical conditions. Ashbourne's charts are revealing illustrations of exactly what has occurred in the market and the probability of what to expect.


Important reading:  Randall Ashbourne's The Idiot and The Moon, Forecast 2014  

Saturday, August 16, 2014

Crash through or crash ... Mars/Saturn

Randall Ashbourne, an associate of Astrological Investing, posts a weekly market report on his web site, theidiotandthemoon.com  The following is this weekend's Eye of RA report: Week beginning August 18,  2014 
 Well, the snugglepuss session with Venus and Jupiter making kissy-smoochy in Leo is almost over.

Now the wicked warrior is heading for a confrontation with the old guy who eats children ... and Venus will throw a hissy fit with both of them.

As expected, stock markets had a nice lull in the developing storm last week as the Prince and the Showgirl headed into their leonine love-in and the general tendency for a price rise into the aspect held firm.

Now we need to think about whether such grand passion can last. Mars, in Scorpio clothing, is heading for a conjunction with Saturn. This won't be pretty. Think ... Cesare Borgia and the "charm" of a King Cobra off for a little chat with the King of Naples. Soon to be the dead, former King.

Venus will make a tense square aspect with both of them ... and the Sun leaves sunny Leo for picky Virgo, where he'll oppose Neptune.

Now, these key aspects pack enough power to turn the markets again. They're not happening this coming week, but the following one.

Last weekend, I published a chart showing the general tendency for stock prices to rise into the annual Venus-Jupiter conjunctions. Now let's take a look at the historical track record of Venus square Saturn, Mars conjunct Saturn and Sun opposed Neptune, marked below with blue, red and green bars respectively.

The other reasonably significant astrological event is that Mercury moves into Virgo this weekend. It's indicative of a mental shift, a change in thinking from grandiose speculation and bold statements to a much more measured outlook and demands for real, hard, actual evidence.

As in ... You can say you bombed a secret Russian convoy, but now it's time to show-and-tell, not just bluff, bluster and try to bravado your way through. And that's not just a matter for little Mercury. The Sun opposed Neptune may well see a "big lie" exposed for all to see.

Still, enough with all of that. Time for some techie stuff. And since it has served us none too shabbily for the past few weeks, let's return to the Dow Jones Industrials daily. I've gone back to the really basic. As expected, the Dow had a better week and managed to climb back above the orange horizontal.

But! The bounce was not enough to get the Dow back inside its longer-term rally channel. So far, it's only a retest of the rising channel's bottom line.

And ditto at a daily level for Pollyanna, the SP500.


Okay, now let's return to some specific planetary price levels. I said last weekend: "I'd have thought she (Pollyanna) should be able to climb above Mars in the coming week, and if she does, we need to watch how she handles the $1958 Node price line." If you recall, the falling Mars line was priced at 1940 for last week. Polly regained it and on Friday attempted to break through the 1958 level. And failed.

Let's hop across the Pond and consider the state of the FTSE. I've shown you the long-range planetary price chart for the German DAX a few times recently.

London made a retest of the 6526ish planetary price level during the August spike down and has bounced again.

What worries me about the bounce, though, is its weakness. I've marked the general area of this very long sideways shuffle with a couple of thin black horizontals, which also cover the previous Bull peaks.

But the Big Bird oscillator is getting very unhappy.

Okay, the ASX200, which enjoyed a stronger love-in bounceback than most other markets. As with the Dow and Pollyanna hitting either planetary price lines or technical trendline levels, the index now has to crash through ... or face the prospect of at least a mini-crash developing.

And gold. Spikes to the topside, spikes to the downside. A shiv into the Bears one day, a skewer into the Bulls the next. Personally, I remain long-range bullish and short-range totally relaxed. And bored by the games.


Safe trading - RA

Randall Ashbourne (Disclaimer: This article is not advice or a recommendation to trade stocks; it is merely educational material.)
Copyright: Randall Ashbourne - 2011-2014


Astrological Investing's associate, Randall Ashbourne, author of the eBook, The Idiot and The Moon, and The Idiot and the Moon, Forecast 2014, writes a free weekly column titled, The Eye of Ra on his web site in  which he explains the potential impact of astrological aspects and the current state of technical conditions. Ashbourne's charts are revealing illustrations of exactly what has occurred in the market and the probability of what to expect.


Important reading:  Randall Ashbourne's The Idiot and The Moon, Forecast 2014  


  Purchase Forecast 2014 and receive a special report on GOLD   

Sunday, July 20, 2014

Storm warnings in space

Randall Ashbourne, an associate of Astrological Investing, posts a weekly market report on his web site, theidiotandthemoon.com  The following is this weekend's Eye of RA report: Week beginning July 21,  2014 
The astrological weather patterns are about to make a dramatic change.

We have planets changing signs, changing directions, and making a series of intense, high-energy aspects with each other.

And since a lot of that energy is unleashed over the next week or so, it could be enough to generate a super storm.

Jupiter has now moved into Leo and is about to be joined by the Sun; Venus has moved into Cancer; Mercury is about to oppose Pluto and square Uranus; Saturn is changing to Direct motion while Uranus goes into Retrograde mode.

And the killer change is Mars finishing an unusually long journey through the diplomatic sign of Libra, shifting into Scorpio and heading for a conjunction with Saturn ... when the "drive" energy smashes into a brick wall.

Mars is the traditional ruler of Scorpio. Mars in his primary sign, Aries, is an all-action hero; more Ego than IQ. The Scorpio version is much, much deadlier ... a deep-thinking, deep-scheming, vengeful, poisonous piece of work who fights to the death.

I've discussed with you many times before how Pollyanna, the SP500, rises and falls within Martian channels between long-range Node price levels.

Other indices tend to do the same, though Uranus, Neptune or Pluto tend to be more reliable as horizontal price stoppers.

Anyway, let's have a look at where Polly is within her long-range Mars channels. In the chart below, I'm showing only the rising channels. We can see that the last Bear bottom was recorded with a small break of what I've labelled as the primary channel bottom.

Price rebounded from there to the next higher primary Mars line, which I've labelled as the channel top. We've had only one major breach outside of that primary channel ... the countertrend down marked with a yellow oval.


Okay, now let's move in for a close-up. The horizontal orange lines marked with 2003 and 1955 are primary Node prices. As I said, the SP500 tends to move in Martian channels between Node price levels.

So the $1955 to $2003 range is a major, long-range danger zone. The declining, dotted red lines are the Martian downtrend channels. In brief, a weekly close below the $1950s could well signal the start of a major correction in this index ... possibly even the start of a new Bear trend.


The ASX 200 has stalled yet again at the $5533 Saturn barrier on its Weekly Planets chart, after a failed attempt to breakout higher, falling a tad short of hitting the Uranus price line at $5565. We've had only a single weekly Close above this line since Auntie started playing with it 22 weeks ago. Breakout or breakdown, you old bat!


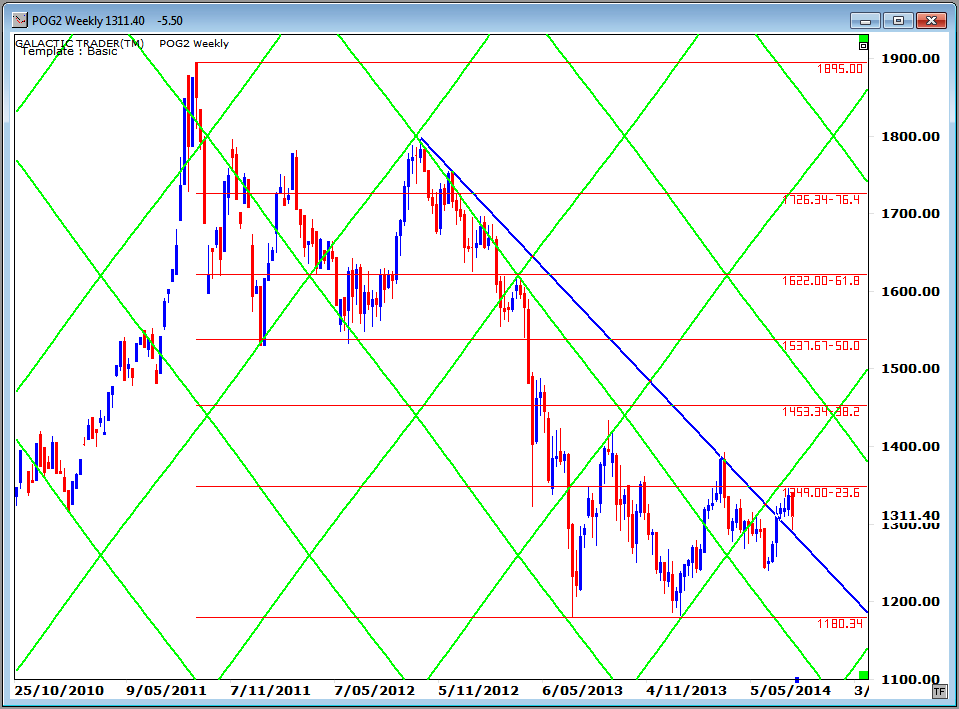
Now let's have a quick look at gold. At 2am New York time last Monday, the mysterious "somebody" suddenly dumped over a billion dollars worth of gold contracts onto the market. It was followed a few hours later by a multi-billion-dollar dump.

Obviously, it was yet another calculated move with only one aim ... to end the rally in gold prices. Nobody dumps a billion dollars worth of anything onto a thinly-traded 2am market expecting it will cause a price jump. It's designed solely to cause a selling panic when the markets open for real.


One suspects it was a co-ordinated move by big central banks. It's not the first time we've seen these out-of-hours, mega-billion dumps and it probably won't be the last.

However, it was not enough to totally trash the distinct possibility that a long-range bottom in the gold price was cemented with the double-bottom in June and December of 2013.


I raised the possibility some time ago that the trend had changed when gold moved out of its Sun downtrend channel. On the above chart, I add a blue technical downtrend line. It put a stop to the last rally, but it, too, has now been broken.

In fact, last week's plunge seems to be a retest of that line ... from the top side. If it holds, it is potentially very, very Bullish. We can't be too optimistic until price can break above the first Fibonacci Retracement barrier around $1350. If it can manage that, it will be doing so with quite extreme positive divergence readings in the Fast and Medium range Canaries on gold's monthly chart, indicating that the gold Bear is back in hibernation and a multi-year rally is underway.

Safe trading - RA

Randall Ashbourne (Disclaimer: This article is not advice or a recommendation to trade stocks; it is merely educational material.)
Copyright: Randall Ashbourne - 2011-2014


Astrological Investing's associate, Randall Ashbourne, author of the eBook, The Idiot and The Moon, and The Idiot and the Moon, Forecast 2014, writes a free weekly column titled, The Eye of Ra on his web site in  which he explains the potential impact of astrological aspects and the current state of technical conditions. Ashbourne's charts are revealing illustrations of exactly what has occurred in the market and the probability of what to expect.


Important reading:  Randall Ashbourne's The Idiot and The Moon, Forecast 2014  


  Purchase Forecast 2014 and receive a special report on GOLD 
 

Saturday, May 3, 2014

No Eye ... and almost no I

Randall Ashbourne, an associate of Astrological Investing, posts a weekly market report on his web site, theidiotandthemoon.com  The following is this weekend's Eye of RA report: Week beginning May 5,  2014
This time a week ago I was in a hospital emergency department seldom more than a few racing heartbeats from death.

A whole team of doctors battled continually for hours to stop my heart from exploding, or my lungs from imploding.

I had meant to take my phone to the bedroom that Friday night. I didn't ... and struggled for almost an hour to make it the 15 feet back to my desk when I realised I needed an ambulance urgently.

For the next few hours I was in and out of the emergency resuscitation unit, constantly surrounded by doctors wearing worried looks and asking me just how far I wanted them to go to revive me if my heart stopped or my lungs did.

"If my heart stops, whack it with whatever you've got ... it's strong enough to take it. If my lungs stop, do nothing."

The prospect of "life" hooked to a breathing machine made the choice ... uncomplicated.

To the two officers of the Stirling Ambulance, the entire ED team at the Royal Adelaide Hospital, and the nurses and doctors of Ward S2, please accept my, quite literally, undying gratitude. You saved my life.

So, that's why I wasn't around last weekend, waffling on about markets. At other times from now on, I'll be taking further breaks from weekly reports.

The fact is, folks, there's not much to gain in raging against the dying of the light. Priorities change according to the stage of Life you're currently in ... and there are quite a few of considerably more interest to me than writing about Spooky Stuff or answering emails.

But, but ... we might as well do a bit of that now, since I'm here anyway, eh?

I'll deal with my home market, the ASX, first. A few weeks ago I showed the key levels to watch on the ASX 200 (as well as other indices) as the Mars/Jupiter/Uranus/Pluto Cardinal Grand Square became exact.

Those price levels for Auntie were 5536 or 5263. As we can see on the chart below, the old bat made a precise hit on target and right on time and has been backing away since, despite Wall Street's attempts to continue levitating. In fact, the highest Close was at 5536.10. Ten cents off. Tsk*Tsk.


The implications are that the Australian market is likely to face continuing weakness. It's not absolutely certain, simply because the index ended the week maintaining a tenuous grip on an important technical level ... the 618 Fibonacci Rx level of the post-2009 recovery.


There are two other very important signals from the above chart we must take into consideration. The rally has long fallen outside the main tynes of the rising pitchfork, but continues to respond to the Fibonacci extensions of the fork. This is in stark contrast to the main Wall Street index, the SP500, which we'll look at in a few minutes.

Note also the continuing deterioration in the state of the three main Canaries. The green Fast Bird and the medium Red Bird are negatively stacked against the blue Big Bird, which is also starting to display negative divergence.

The key here is whether the index can maintain its position above that Fibonacci Rx level in the early 5400s. Should the weakness continue, Auntie's Weekly Planets chart probably gives the best guide to the targets likely to provide Support or Resistance.


Now, let's turn our attention to Pollyanna, the SP500. Big Picture first. Just do a quick eyeball of the next chart so you can see how price continues to cling to the middle tyne of the rally pitchfork.

It's a lot stronger than the Australian index. That's probably because we spend our money on a universal healthcare system, rather than allowing the Reserve Bank to spend umpteen billion dollars a month making thieving bankers even richer. Different priorities.


And now that we have the broad overview, we can take a closer look at that chart, where it's easier to see Polly's tenacious grip on that rising central tyne of the fork as price sashays either side of the line like Saturday night dancers at the Belle Star.

We should note that the weekly Big Bird is looking as if he, too, might end up in the emergency resuscitation unit before long.

Still, in terms of primary planet prices, Polly also maintains a grip on the topside of a key, long-range level at 1876. The Fat Lady is still singing.


If there is any hint which way stocks are likely to go in the short-term, it may be in gold's Friday performance. It regained in a day the previous four days' worth of losses.


In terms of the weekly chart, we now have two bars standing tall on their tails after retests of the 1273 horizontal Pluto support as price tries valiantly to cling to the rising Sun line.

Also favouring some muted and cautious optimism about gold's rise is the fact that its Big Bird oscillator maintains a position on the northern side of a rising trendline.


Astrologically, the heavy weather takes a break for most of the coming week. The next major aspect doesn't occur until next weekend when the Sun opposes Saturn.

After that, though, Venus in Aries will do the whole Grand Square routine again.

If I have the time and energy next weekend, I'll try to catch you up with a few of the Euro/Asian indices and we'll look at some price targets for the Venus aspects.

Thank you to those who wrote asking if I was alright after my non-appearance online last weekend. I am ... now. Sort of. I mentioned recently that one needs an accurate birth chart to try to determine if Big Things Happening Out There will have an impact on a particular entity.

Silly old bugger that I am, I managed to totally ignore the fact that the recent Lunar Eclipse Full Moon triggered the angles of my birth chart, that the Solar Eclipse was conjunct my natal Midheaven and that two of the main players in the configuration were stuffing around with the 6th (health) and 12th (hospitalisation).

Luckily, I guess, my natal Jupiter stands permanent guard at the door of my 12th, a guardian angel position, and the transiting FatBoy was happily romping, exalted in Cancer, through my 12th and approaching the Ascendant.

And as much as an unaspected, 5th House Sagittarian Sun guy just loves the FatBoy and regards him as a pal, I gotta tell yuh, Jupie ... I've gotta love those ambos, docs and nurses even more!


Randall Ashbourne

Safe trading - RA
Astrological Investing's associate, Randall Ashbourne, author of the eBook, The Idiot and The Moon, and The Idiot and the Moon, Forecast 2014, writes a free weekly column titled, The Eye of Ra on his web site in  which he explains the potential impact of astrological aspects and the current state of technical conditions. Ashbourne's charts are revealing illustrations of exactly what has occurred in the market and the probability of what to expect.
Important reading:  Randall Ashbourne's The Idiot and The Moon, Forecast 2014
(Disclaimer: This article is not advice or a recommendation to trade stocks; it is merely educational material.)
Copyright: Randall Ashbourne - 2011-2014


  Purchase Forecast 2014 and receive a special report on GOLD

Saturday, April 5, 2014

One swallow does not a summer make

Randall Ashbourne, an associate of Astrological Investing, posts a weekly market report on his web site, theidiotandthemoon.com  The following is this weekend's Eye of RA report: Week beginning April 7, 2014 
And Friday's rather dramatic turnaround for Wall Street stocks ... and gold ... doesn't necessarily signal The Turn for either of them.

It is possible, for a whole range of reasons on both technical and astrological levels.

But we are dealing in both cases with markets that are heavily manipulated.

We have been discussing for some time, in the Eye and in Forecast 2014, the special danger posed by April ... and that danger has been growing because of the negative divergence building in the oscillators on weekly and monthly charts.

We'll concentrate this weekend on trying to work out whether this is just another part of the big boys' game, or whether the tide has finally turned.

Normally, I do not give too much weight to a single day's trading. But, if this one is a real "false break", it could be the start of a major downswing that could get very ugly for those caught unprepared.

We'll deal firstly with something I warned about in Forecast 2014 and have discussed specifically a couple of times in the Eye this year, including only last weekend.

We looked last weekend at last week's Sun transits to Jupiter, Uranus and Pluto as a possible precursor to what might happen later in April when Mars, Jupiter, Uranus and Pluto align in a Cardinal Grand Square. You might want to refresh your memory by reading last weekend's edition again.

There is a chance that those Sun transits have acted as a "trigger". So, let's begin this weekend by looking at the bigger transits, the major component of which is Jupiter in Cancer opposing Pluto in Capricorn while squaring Uranus in Aries.

The first chart is a multi-decade view of the SP500 with Jupiter square Uranus marked in red bars, Jupiter trine Uranus marked in green bars, and Jupiter opposed Pluto in blue bars.

As I've indicated before ... these are dangerous. In one guise or another they were there leading into the 1987 flash crash and again at the two previous Bull market peaks.


We can zero-in on the next chart to get a closer view. We are now in the month of Jupiter's third and final "hit" of squaring Uranus AND it concides with an opposition to Pluto. In 2000, the Bear had started to bite with the red square to Uranus and then the real mauling began with the first of the blue oppositions to Pluto.

The third hit of the square to Uranus in 2007 brought the Bull top and a rapid Bear mauling. Now we have the same aspects again.


On top of those omens, we have what might be a "false break". This is when price temporarily breaks through an important barrier and goes into a sudden and largely unexpected reversal. False breaks always provoke very fast moves in the opposite direction. A number of times this year we've discussed the real trouble Pollyanna was having trying to break free of an overhead primary Pluto barrier on her daily charts.

Last Tuesday, the overnight computers went to work - forcing a gap Open on the index to get it above that barrier. But, it didn't last.


And that's what makes Friday's action ... a new, all-time High, followed by a fast and dramatic reversal ... so dangerous. Because, that Pluto line is an important long-range barrier, not just a daily hurdle.

The two previous Bull peaks also occurred at a long-range Pluto line. Trace backwards the one marked with the $1518 price tag and you'll see what I mean.


The upshot of all this is basically what I said in last weekend's headline ... April may be "it". Let's not get married to the idea to the exclusion of all else.

It is, so far, just a single day's trade. But, if this is a real false break, the stock markets could turn really ugly, really fast.

On the flip side, gold has turned northwards within the fairly narrow price range we anticipated should bring about a bounce. All of the big picture stuff is in the special gold report I sent out a couple of weeks ago.

You know I was expecting a down move to retest the validity of the rising primary Sun line - and that, too, is in last weekend's edition.

Here is the update.


We talked about a potential hit of the $1273 level, the intersection of a secondary Pluto horizontal with the rising Sun line. And I also said: "There is no guarantee it will be hit, however, since Friday bounced from another "obvious" level - the 50% retracement marker of the post-December rally. This could be an important level, and if it can hold, leaves gold in a position to mount another strong rally leg."

 And here's what happened.


The 50% retracement level was broken by only a small amount and only relatively briefly. It is another example of what happens with a "false break".

As I said last weekend, the 3 Birds in the oscillator panel were signalling a potential turnaround in the gold price and that the Birds were already stacked in approaching rally mode for a lot of individual gold mining stocks. And now they're stacked that way for gold itself.

It's too early to say with any real degree of certainty that the long-range tides have turned for both stocks and gold. But the evidence for exactly that scenario has been building for quite some time - and much moreso on stock indices other than those on Wall Street.

Individually, we need now to check the charts - monthly, weekly and daily - on all the stocks we are holding.

And we need to remember the very first rule of survival: Always protect your capital. 

Randall Ashbourne

Safe trading - RA
Astrological Investing's associate, Randall Ashbourne, author of the eBook, The Idiot and The Moon, and The Idiot and the Moon, Forecast 2014, writes a free weekly column titled, The Eye of Ra on his web site in  which he explains the potential impact of astrological aspects and the current state of technical conditions. Ashbourne's charts are revealing illustrations of exactly what has occurred in the market and the probability of what to expect.
Important reading:  Randall Ashbourne's The Idiot and The Moon, Forecast 2014
(Disclaimer: This article is not advice or a recommendation to trade stocks; it is merely educational material.)
Copyright: Randall Ashbourne - 2011-2014


Purchase Forecast 2014 and receive a special report on GOLD

Monday, March 31, 2014

Significant Astrological Events of the Spring Season

Significant Upcoming Astrological Events of the Season

Mar 20 SUN into Aries
Mar 29 (Saturday) VENUS Square SATURN, VENUS Trine MARS
Mar 30 (Sunday) NEW MOON

Apr 01 SUN Square JUPITER
Apr 02 SUN Conjunct URANUS, MERCURY Trine SATURN, MOON opposition SATURN
Apr 03 SUN Square PLUTO
Apr 05 (Saturday) VENUS into Pisces
Apr 07 MERCURY into Aries
Apr 08 SUN Opposition MARS
Apr 11 VENUS Conjunct NEPTUNE
Apr 14 PLUTO Retrograde, MERCURY Conjunct URANUS, Square JUPITER, Square PLUTO, MOON Conjunct MARS
Apr 15 FULL MOON/ LUNAR ECPLISE
Apr 16 MERCURY Opposition MARS
Apr 17 VENUS Trine JUPITER
Apr 18 VENUS Sextile PLUTO
Apr 19 (Saturday) SUN into Taurus
Apr 20 (Sunday) JUPITER Square URANUS, JUPITER Opposition PLUTO, MOON conjunct PLUTO
Apr 21 URANUS Square PLUTO
Apr 22 MARS Square JUPITER
Apr 23 MARS Square PLUTO, MARS Opposition URANUS, MERCURY into Taurus
Apr 25 SUN Conjunct MERCURY, VENUS Trine SATURN
Apr 29 NEW MOON / SOLAR ECPLISE, MERCURY Trine PLUTO

May 02 VENUS into Aries, MERCURY Opposition SATURN,
May 07 MERCURY into Gemini
May 10 (Saturday) SUN Opposition SATURN
May 11 (Sunday) VENUS Opposition MARS
May 14 FULL MOON, VENUS Square PLUTO,
May 15 VENUS Conjunct URANUS, MERCURY Sextile VENUS, MERCURY Sextile URANUS,
May 18 (Sunday) VENUS Square JUPITER
May 20 MARS Direct SUN into Gemini
May 24 (Saturday) JUPITER Trine SATURN
May 28 NEW MOON , SUN Square NEPTUNE, VENUS into Taurus,
May 29 MERCURY into Cancer

Jun 07 (Saturday) MERCURY Retrograde
Jun 09 NEPTUNE Retrograde
Jun 12 FULL MOON, VENUS Opposition SATURN,
Jun 14 (Saturday) MARS Square PLUTO
Jun 17 MERCURY into Gemini
Jun 21 (Saturday) SUN into Cancer Summer Solstice (Northern Hemisphere)


Read Randall Ashbourne's weekly Eye of Ra reports and his Forecast 2014 for more specific information as to how transits and planets changing directions might affect the market.

Randall Ashbourne's Forecast 2014 now includes a special report on GOLD.  People who purchase a copy of Forecast 2014 will receive the special report emailed  by Randall Ashbourne. 

You can purchase Forecast 2014 at www.astrologicalinvesting.com  as well as www.theidiotandthemoon.com


******
"How to Choose Stocks to Outperform the Market 2014"  by Grace Morris,
Know what stocks to buy for 2014!    Click to purchase her Book
ASTRO ECONOMIC NEWSLETTER, by Grace Morris
STOCK RECOMMENDATIONS,  IPO dates and Incorporation Dates on recommended stocks each month! SUBSCRIBE FOR A THREE MONTH TRIAL ($55.00) or 1 yr subscription to the Astro Economic Newsletter

Saturday, March 29, 2014

April ... the month that could be "it"!

Randall Ashbourne, an associate of Astrological Investing, posts a weekly market report on his web site, theidiotandthemoon.com The following is this weekend's Eye of RA report: Week beginning March 31, 2014 
 
  Monday brings the end-of-month and end-of-quarter, a time when the bonus babies cook the books to ensure a nice, fat cheque is in the mail.

And unless Monday brings an explosive splurge, Wall Street's main index, the SP500, will finish March leaving a price bar that could be The Top.

 April shows all the signs of a long-range turn in the tide.

Of course, I am talking about astrological expectations ... and those of you who have read last weekend's special report on gold know that I reiterated my view about relying on expectations of any kind.

Still, I showed in Forecast 2014 the huge pile-up of planetary energy due to be unleashed in the latter part of the month when Mars, Jupiter, Uranus and Pluto will be lined-up in a configuration called a Cardinal Grand Square. And, as we've discussed before, the Cardinal signs and transiting Squares are very much "action" signatures.

It will be compounded by the first Solar and Lunar eclipses of the year. We should get a small taste of the energy in the coming week, when the travelling Sun, now in the action sign of Aries, squares Jupiter, conjuncts Uranus and squares Pluto.

In the chart below, Sun conjunct Uranus is marked with blue bars; Sun square Pluto with red bars; and Sun square Jupiter with green bars.

I've circled the three previous instances where the Sun's conjunction with Uranus happened almost simultaneously with a square to Pluto. And I'm not sure from the track record that we can draw any reliable conclusion.

In fact, the Sun squares to Jupiter (the green bars) seem to have more impact; there seems to be a tendency to accelerate the existing trend - whether it's up or down. This week will be the first time the Sun makes aspects to all three outer planets within a few days ... so, I would expect the month-long sideways shuffle is about to end abruptly.


The shuffle is probably best seen using the 500's daily bars on the index's Weekly Planets chart, where nearly all of the price action since late February has been constrained upside and downside by Saturn price barriers. This is either accumulation for a splurge higher ... or the big boys have been quietly selling over the past 6 weeks.


There is not, in my mind, such clear-cut evidence from the state of the daily oscillator to be able to predict the next move with any real certainty.

However, the level of negative divergence continues to build very solidly on both weekly and monthly charts, regardless of whether we're consulting the Canaries or the fast MACD.

And we are likely to have Pollyanna end the month leaving a bar that's potentially quite dangerous. What we have, in essence, is a bar that highlights a rather extreme amount of indecision.

It displays a very tight range, where both the upside and the downside have been tested ... and the bar seems likely to finish Monday trading in the middle of that range. In short, no-one seems certain what to do next.


My "expectation" is that April will bring an end to the indecision. We break out, or we break down. The Wall Street indices aren't alone in this condition.

The ASX 200 has also spent the past 6 weeks largely contained by its Weekly Planets Saturn barriers. Again, the Big Bird weekly oscillator is not giving any obvious and clear hints as to whether it will be a break to the upside or downside ... but at least we have the key price levels to watch for the first clues.


Now let's turn our attention to gold. I went through the big picture in last weekend's special report and you know I've been expecting some sort of retest of the rising primary Sun line.

That retest got underway during the past week. There is an intersection of the rising primary Sun with a secondary Pluto horizontal in the next few days - at $1273. It is an "obvious" bounce level if it is hit.


There is no guarantee it will be hit, however, since Friday bounced from another "obvious" level - the 50% retracement marker of the post-December rally. This could be an important level, and if it can hold, leaves gold in a position to mount another strong rally leg.


We are getting signals from the 3 Birds of a potential turnaround in the gold price. The green Fast Bird is turning and is above the red Medium Bird, which is also starting to diverge from the price plunge. If you're watching the charts of the gold miners, some of those are already showing a shift in the stacking of the Birds into approaching rally mode ... meaning both Fast and Medium Birds have already climbed higher than the blue Big Bird.

Safe trading - RA
Randall Ashbourne
Astrological Investing's associate, Randall Ashbourne, author of the eBook, The Idiot and The Moon, and The Idiot and the Moon, Forecast 2014, writes a free weekly column titled, The Eye of Ra on his web site in  which he explains the potential impact of astrological aspects and the current state of technical conditions. Ashbourne's charts are revealing illustrations of exactly what has occurred in the market and the probability of what to expect.
Important reading:  Randall Ashbourne's The Idiot and The Moon, Forecast 2014
(Disclaimer: This article is not advice or a recommendation to trade stocks; it is merely educational material.)
Copyright: Randall Ashbourne - 2011-2014