Showing posts with label Jupiter Retrograde. Show all posts

Sunday, December 7, 2014

Germany joins the USA in all-time Highs

Randall Ashbourne, an associate of Astrological Investing, posts a weekly market report on his web site, theidiotandthemoon.com  The following is this weekend's Eye of RA report: Week beginning December 8, 2014 
 Wall Street continues to make marginal new Highs, though the SP 500 is still shy of touching a major planetary price barrier at 2082.

 Trading on Wall Street was relatively subdued last week, despite some strong astrological aspects involving Jupiter and Uranus.

 There are more of them to come, especially over the next week when Jupiter goes Retrograde, Venus moves to Capricorn, the Sun trines Jupiter ... and we get another exact hit of Uranus square Pluto.

Europe, especially Germany, is now bouncing back from weakness earlier in the year. You might recall that some months ago we talked about the DAX running into long-range overhead planetary price resistance.

It was strong enough to send the DAX into a multi-month downfall. However, the pick-up in performance since the low in mid-October has lifted the German market back into the same territory.

European traders are hopeful that the ECB will now follow Japan, taking over monetary expansion from the US Federal Reserve.

We'll look at the key levels now.

Below is the long-range planetary price chart for the DAX. Midway through 2014, the index ran into the Pluto barrier priced in the early 10,000s, prompting a strong correction.

The index is now making another attempt to breakout northwards. At this stage, the Bird Bird oscillator seems very dubious.

The SP500 continues to fall just short of touching its overhead Pluto barrier in the early 2080s. It's entirely possible the resistance could be breached by a gap Open, opening potential targets in the 2100s.

A couple of weeks ago, we discussed the under-performance of the ASX200 and I suggested a Uranus price line, then priced at 5270 could provide a stronger level of support.

The index had a one-day dive below the level last Monday, but recovered the following morning. The weekly resistance from Saturn lines around 5382 and 5417 need to be overcome before the index has a chance of challenging the August highs. 

Safe trading - RA

Randall Ashbourne (Disclaimer: This article is not advice or a recommendation to trade stocks; it is merely educational material.)
Copyright: Randall Ashbourne - 2011-2014


Astrological Investing's associate, Randall Ashbourne, author of the eBook, The Idiot and The Moon, and The Idiot and the Moon, Forecast 2014, writes a free weekly column titled, The Eye of Ra on his web site in  which he explains the potential impact of astrological aspects and the current state of technical conditions. Ashbourne's charts are revealing illustrations of exactly what has occurred in the market and the probability of what to expect.

Saturday, November 2, 2013

The Bull ... Halloween costume change?

Randall Ashbourne, an associate of Astrological Investing, posts a weekly market report on his web site, theidiotandthemoon.com The following is this weekend's Eye of RA report: Week beginning November 4, 2013

There is a chance the Bull died quietly last week.

For the moment, it is merely a possibility, rather than a probability.

However, using three different techniques, Wall Street's major index, the SP500, has hit important long-range projections and resistance.

We will examine the omens in some detail this weekend because the implications are likely to have an impact on stock markets worldwide.

I indicated last weekend that the middle hit of the Uranus square Pluto aspect brought with it an increased danger of turning the tide, though the full effect might not become obvious for several months.

In the coming week, Venus shifts into Capricorn, the Sun has its annual conjunction with Saturn, and Jupiter turns Retrograde.

While many astrology buffs tend to view the latter two of those as being highly negative, the truth is neither has a particularly reliable record of turning the markets decisively. I'll show you the chart of past performance in a moment.

Of more concern is the deceleration in the rally which began a year ago. It is not so obvious on weekly and monthly charts. The daily channel of the rally tells quite another story.

We'll also take a quick look at gold and the possibility it is now nearing a bounce level that could be worth a couple of hundred dollars an ounce.

Let's begin by looking at the track record of the Sun conjuncting Saturn and Jupiter turning Retrograde. On the chart below, the Sun's annual conjunction with Saturn is marked with red bars and the Jupiter Rx phases are marked with the blue bars.

While the astrological expectation might be that they're a negative influence, neither turns up regularly as a reliable turn indicator.

But, there are other reasons to worry now. Using three different techniques, Pollyanna - the SP500 - has made exact hits of price levels which have the potential to stop the Bull in its tracks.

Firstly, Miss Polly's long-range planetary price levels ...

Secondly, it has made an exact touch of the upper trend channel line. Past contact with this line since the Bear bottomed in 2009 has caused major reversals.

And thirdly, we see the potential for a top of real significance because the index has touched - and resiled from - an important Fibonacci price projection calculated as an extension from the first leg of the post-Bear rally.

Now, we have a difference between perception and reality. The perception Out There seems to be the Bull is running at full speed. The reality is that there signs of marked deceleration.

While Polly has hit the top of its long-range weekly channel, an examination of the rally leg which began a year ago shows something else. For the first 7 or 8 months of the rally, price stayed within the rising blue channel.  After the first dropout, it regained the channel. And that's something the index has been unable to achieve since.

So the danger continues to develop. There is a chance - a possibility - that the Bull died quietly on Wednesday. It seems unlikely. And it could be weeks, perhaps even a few months, before we will know for sure whether it's all over - or whether there will be another rally.

Topping is a process, not an event. But the danger signs are there for those who want to ignore the chattering and simply take notice of what the charts are warning.

Now, let's have another look at the price of gold. Despite the obvious manipulation, price continues to play to Sun-Pluto markers. There are two major views of this chart.

The gold bugs think the past week's performance is just a small breather before a huge rally higher; the gold bears view this as the start of a sharp new wave downwards.

There is an alternative. In Elliott Wave terms, a correction forms a 3-wave pattern known as an ABC. These patterns are usually obvious only with the wisdom of hindsight because the waves can break down into smaller abc patterns.

In the chart below, I have assumed that gold is still within a large-scale correction and has not yet made its final bottom. In this scenario, it will eventually take out the June lows. But, in all probability, not before it rallies.

This chart assumes that the rally from late June to late August was the "A" of an ABC. The decline into mid October was the "B". If that is so, then the final component ... the "C" ... still has further to run in Time and Price.

It means we have seen only the "a" and most of the "b" of the "C" leg. We should find out this week. If price continues down past the October 15 Low, it's also likely the June Low will be breached.

We need to watch for a potential turn northwards almost immediately or at prices very close to last week's Close. We can see the potential for a turn is provided by contact with the green Sun lines on the chart above.

If that does turn out to be the case, then we should assume some level of normalcy is at work ... and what is reasonably normal is that a C wave will tend to be a very similar length to the initial A wave. And that puts the target at around 1500 - a potential rise of $200 an ounce.

I'll wrap-up this edition by updating the Weekly Planets charts for Paris and Amsterdam and with a quick look at the Australian market.

Auntie, the ASX200, has hit new highs ... much lower than the 2007 peak! The first two rallies after the 2009 Bear bottom stalled out at the 50% retracement level. Last week we had what appears to be a "false break" of the 61.8% Fibonacci Rx line.

However, there's a technical condition evident here which cautions me against declaring the Bull to be dead. And it's the state of the long-range Big Bird oscillator (the blue line in the indicator panel). It agrees emphatically that the new price high is entirely legitimate and that it is highly likely even higher prices are not only possible, but probable, over the next few months.

The current resistance is the "obvious" level of the FiboRx line; it's not a weekly planetary level. If there is, ultimately, to be a break higher, I suspect 5670 to be a reasonable target ... since Auntie is very much a Neptunian index. 

France:


Holland:


Safe trading - RA

Randall Ashbourne
Astrological Investing's associate, Randall Ashbourne, author of the eBook, The Idiot and The Moon, and The Idiot and the Moon, Forecast 2013, writes a free weekly column titled, The Eye of Ra on his web site in  which he explains the potential impact of astrological aspects and the current state of technical conditions. Ashbourne's charts are revealing illustrations of exactly what has occurred in the market and the probability of what to expect.
Important reading:  Randall Ashbourne's The Idiot and The Moon, Forecast 2013
(Disclaimer: This article is not advice or a recommendation to trade stocks; it is merely educational material.)
Copyright: Randall Ashbourne - 2011-2013

Saturday, September 29, 2012

Alarm bells ring in the tech index

Randall Ashbourne, an associate of Astrological Investing, posts a weekly market report on his web site, theidiotandthemoon.com The following is this weekend's Eye of RA report: Week beginning October 1, 2012

With September and the 3rd Quarter now behind us, we'll spend a little time this weekend looking closely at two of the major American indices for signs of stress.

The danger of an unexpected Black Swan event remains in force over the coming week. This weekend's Harvest Moon provides a potential trigger for more negative energy - compounded by some major astrological energy shifts over the next few days.

Four planets change signs and Jupiter goes Retrograde.

Both Mercury and Saturn make the move from Libra into Scorpio; Venus moves from Leo into Virgo; and Mars changes from Scorpio into Sagittarius.

Long-term, the most significant shift is Saturn because it will spend the next couple of years travelling through the sign associated with Big Debt, Big Money. Let me explain first how this works in a personal horoscope, though I must stress the interpretation is broad-brush and does not apply to all individuals.

In a "natural" horoscope, Scorpio rules the 8th House - which is the house relating to "other people's money".

An individual undergoing a Saturn transit to the 8th is very likely to find access to other people's money cut off.

This is a time when banks refuse you a loan or a mortgage, when your debts become a major burden to service, and when the Tax Department audits your returns for several years and decides you owe them a LOT more than you've been trying to get away with.

Now, just like you and me, nations also have a "personal" horoscope so not every country is going to suffer the same symbolism. But, because of the long-range negativity of the Uranus-Pluto square already in effect across much of the world, we can expect the sovereign debt issues affecting countries like Greece to magnify significantly over the next couple of years.

Saturn's entry into Scorpio will bring those issues to a head. Banks will be affected, the Treasuries of nations will be affected, insurance companies will be affected. Anyone with large exposure to banks, financial stocks and insurance companies should take some time in the next few weeks to closely examine the technical conditions of their holdings.

The principle of Saturn in Scorpio is that anyone who has become too reliant on "other people's money" faces an unwelcome reckoning ... because the money tap is about to turned off. Saturn transits demand we take a conservative and responsible attitude to debt - or face the consequences.

Those governments which have been blustering and bluffing face a dose of reality. We must consider the transit is a long one; Saturn takes almost three years to travel through each sign. And the Mars shift to the boundless enthusiasm of Sagittarius may provide the opportunity for one last moment of mindless enthusiasm before even the most ardent optimists are challenged.

For several weeks now, we've been exploring the likely limits of the upside in various indices and watching for the first signs of negative divergence to appear in our oscillators to warn of major roadblocks.

And with September and the 3rd Quarter now behind us, that's what we'll be looking at this weekend, concentrating on two of America's major indices, since it's only US Federal Reserve intervention and manipulation which has been holding those markets aloft.

We will begin with Pollyanna, the SP500.
click to view larger image

The first thing we need to take into account is that the SP500 has followed the technical "rules" fairly closely since the Bear bottom in 2009 - finding either Support or Resistance at key Fibonacci levels while rising at an overall angle determined by a pitchfork anchored at key tops and bottoms.

The long-range Canary has endorsed the September high by making a higher peak compatible with the price high.
click to view larger image

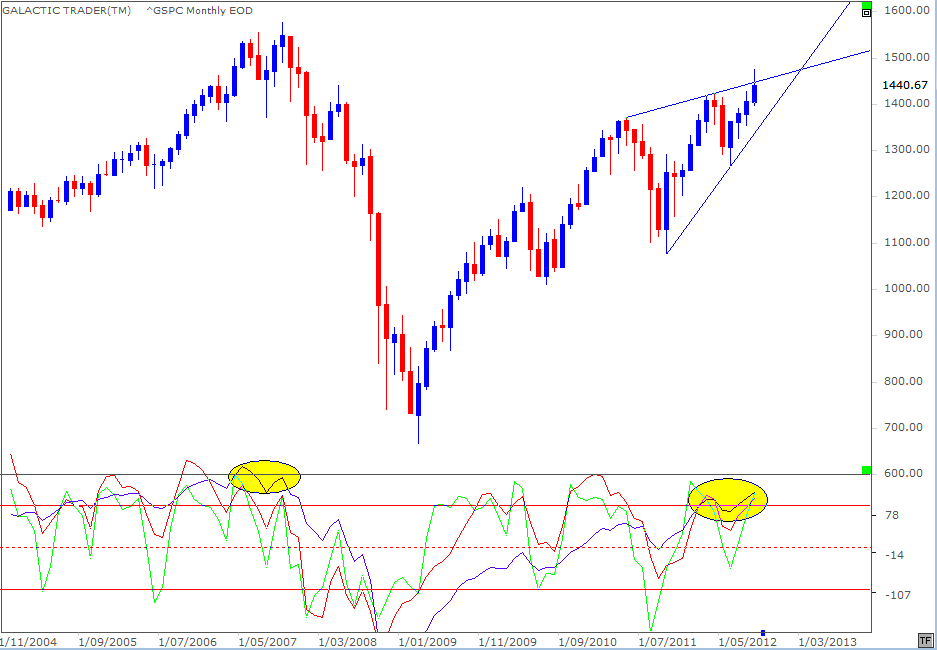
September also behaved perfectly with the rules of the Bi-BB system, which is explained in The Technical Section of the book. Unlike the long-range Canary however, the fast MACD doesn't like the new highs at all. I've used a couple of examples over the past weekends to show you how MACD divergence actually needs time to build and if you're a new reader, you might want to revisit the last couple of editions.

The MACD divergence has been building-up in this index for a very long time now.
click to view larger image

I also discussed, a few weeks back, the possibility that Pollyanna was marking out a termination pattern known as an Ending Diagonal and September's false break outside the upper boundary of that pattern increases the probability that it is what is happening ... and that the index is getting very, very close to breaking out or breaking down.
click to view larger image

And we've also been regularly reviewing my long-range Old Gods chart for the 500, where I've discussed the importance of the dotted Neptune line at 1468 - as well as the potential for the index to make a final exhaustion run to 1522 or 1562 before the collapse gets underway.

Now, let's turn our attention to the state of the Nasdaq 100.
click to view larger image

I've discussed a number of times the importance of 50% retracement and extension levels to some indices and a few weeks ago we looked at this chart, anticipating the NDX would face a major hurdle at the 2805 level.

However, that's not the most important thing on the chart. We have in the NDX what is missing in the 500's chart - a severe and increasing level of negative divergence in the long-range Canary (the blue oscillator line). All three versions of the Canary HATE the Nasdaq's new September high!

There is a very loud alarm klaxon going off in this index ... and it is even more obvious in the NDX weekly chart, below.
click to view larger image

Since the index deals with technology-related stocks, it's no surprise to discover that Uranus is the Old God most closely associated with its long-range targets, either as Support or Resistance. Uranus is delineated on the chart below with the orange lines.
click to view larger image

Last week found Support when price retested the Uranus barrier which had twice previously acted as Resistance. However, as with the previous chart, there is negative divergence from the height of the MACD signal line peaks, as well as the histogram peaks. This index is in danger territory. It is showing all the classic signs of getting very close to a major breakdown.

So, while we have no solid leads yet that Pollyanna is about to morph into Chicken Little on the SP500, we have very clear signals from the Nasdaq 100 that the American market internals are no longer stubbornly Bullish.
click to view larger image

The chart above is the DAX Weekly Planets. It failed to make it all the way to the Neptune line at 7490 and has gone from a Saturn (cyan) high to a Saturn low. However, with this index, it's the grey Neptune and orange Uranus lines which are the major targets.
click to view larger image

The FTSE Weekly Planets chart is next and needs no explanation.

And below is a really simple chart of the ASX200.
click to view larger image

I display this chart once again as an example of just how simple - and informative - a chart can be without having to rely on expensive software. It actually flies in the face of the omens from the NDX. The downtrend angle has been broken and the long-range Canary is suggesting further upside, so long as 4266 isn't breached by October's close.

Okay, I've spent more time than usual this weekend concentrating on the 500 and the NDX, since Wall Street and the Fed seem determined to follow the American Presidential Pattern, which normally sees an October slump followed by a fast rally into the November election period.

Next weekend, I'd hope to look at the Asian markets again - especially Shanghai, since what happens in China will be important. And I also hope to have another look at the main Canadian index since it has been quite a while since we reviewed the TSX60.

In the meantime ...

Safe trading - RA


Randall Ashbourne
Astrological Investing's associate, Randall Ashbourne, author of the eBook, The Idiot and The Moon, writes a free weekly column titled, The Eye of Ra on his web site in  which he explains the potential impact of astrological aspects and the current state of technical conditions. Ashbourne's charts are revealing illustrations of exactly what has occurred in the market and the probability of what to expect.
Important reading:  Randall Ashbourne's article, Jupiter's cycle and its effects on Wall Street and a posting of the weekly Eye of Ra report in this blog, titled A look at the Venus Retrograde effect
(Disclaimer: This article is not advice or a recommendation to trade stocks; it is merely educational material.)
Copyright: Randall Ashbourne - 2011-2012