


We have planets changing signs, changing directions, and making a series of intense, high-energy aspects with each other.
And since a lot of that energy is unleashed over the next week or so, it could be enough to generate a super storm.
Jupiter has now moved into Leo and is about to be joined by the Sun; Venus has moved into Cancer; Mercury is about to oppose Pluto and square Uranus; Saturn is changing to Direct motion while Uranus goes into Retrograde mode.
And the killer change is Mars finishing an unusually long journey through the diplomatic sign of Libra, shifting into Scorpio and heading for a conjunction with Saturn ... when the "drive" energy smashes into a brick wall.
Mars is the traditional ruler of Scorpio. Mars in his primary sign, Aries, is an all-action hero; more Ego than IQ. The Scorpio version is much, much deadlier ... a deep-thinking, deep-scheming, vengeful, poisonous piece of work who fights to the death.
I've discussed with you many times before how Pollyanna, the SP500, rises and falls within Martian channels between long-range Node price levels.
Other indices tend to do the same, though Uranus, Neptune or Pluto tend to be more reliable as horizontal price stoppers.
Anyway, let's have a look at where Polly is within her long-range Mars channels. In the chart below, I'm showing only the rising channels. We can see that the last Bear bottom was recorded with a small break of what I've labelled as the primary channel bottom.
Price rebounded from there to the next higher primary Mars line, which I've labelled as the channel top. We've had only one major breach outside of that primary channel ... the countertrend down marked with a yellow oval.

Okay, now let's move in for a close-up. The horizontal orange lines marked with 2003 and 1955 are primary Node prices. As I said, the SP500 tends to move in Martian channels between Node price levels.
So the $1955 to $2003 range is a major, long-range danger zone. The declining, dotted red lines are the Martian downtrend channels. In brief, a weekly close below the $1950s could well signal the start of a major correction in this index ... possibly even the start of a new Bear trend.

The ASX 200 has stalled yet again at the $5533 Saturn barrier on its Weekly Planets chart, after a failed attempt to breakout higher, falling a tad short of hitting the Uranus price line at $5565. We've had only a single weekly Close above this line since Auntie started playing with it 22 weeks ago. Breakout or breakdown, you old bat!

Now let's have a quick look at gold. At 2am New York time last Monday, the mysterious "somebody" suddenly dumped over a billion dollars worth of gold contracts onto the market. It was followed a few hours later by a multi-billion-dollar dump.
Obviously, it was yet another calculated move with only one aim ... to end the rally in gold prices. Nobody dumps a billion dollars worth of anything onto a thinly-traded 2am market expecting it will cause a price jump. It's designed solely to cause a selling panic when the markets open for real.

One suspects it was a co-ordinated move by big central banks. It's not the first time we've seen these out-of-hours, mega-billion dumps and it probably won't be the last.
However, it was not enough to totally trash the distinct possibility that a long-range bottom in the gold price was cemented with the double-bottom in June and December of 2013.
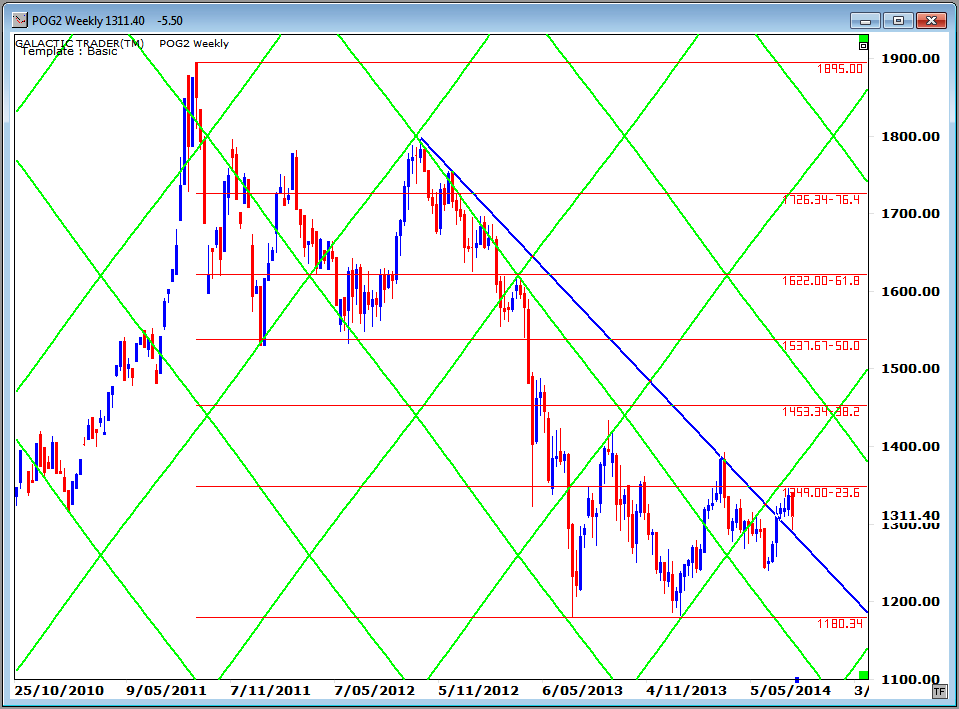
I raised the possibility some time ago that the trend had changed when gold moved out of its Sun downtrend channel. On the above chart, I add a blue technical downtrend line. It put a stop to the last rally, but it, too, has now been broken.
In fact, last week's plunge seems to be a retest of that line ... from the top side. If it holds, it is potentially very, very Bullish. We can't be too optimistic until price can break above the first Fibonacci Retracement barrier around $1350. If it can manage that, it will be doing so with quite extreme positive divergence readings in the Fast and Medium range Canaries on gold's monthly chart, indicating that the gold Bear is back in hibernation and a multi-year rally is underway.
Safe trading - RA
 (Disclaimer: This article is not advice or a recommendation to trade stocks; it is merely educational material.)
Copyright: Randall Ashbourne - 2011-2014
Astrological Investing's associate, Randall Ashbourne, author of the eBook, The Idiot and The Moon, and The Idiot and the Moon, Forecast 2014, writes a free weekly column titled, The Eye of Ra on his web site in which he explains the potential impact of astrological aspects and the current state of technical conditions. Ashbourne's charts are revealing illustrations of exactly what has occurred in the market and the probability of what to expect.
Important reading: Randall Ashbourne's The Idiot and The Moon, Forecast 2014
 Purchase Forecast 2014 and receive a special report on GOLD


0 comments:
Post a Comment
Note: Only a member of this blog may post a comment.