Showing posts with label Jupiter. Show all posts

Sunday, September 8, 2019

Can Planets Influence human Life?

(Excerpt edited from an article written by Kaye Shinker for Astrological Investing in reply to one of her students in 2009.)

OK  There is a long answer but here's a short list:
Mercury Retrograde 
Mercury's apparent forward, stationary, and backward movement as seen from our planet is always the astrologers best example of how muddled brains all over the world can get.  The best current example is the TARP program passed by the Congress and signed into law all during a Mercury retrograde. I discuss this phenomena in my Textbooks for Financial Astrology Book 1 Lesson 2.
Your average student astrologer will probably have a long list of Mercury retrograde events. Most are pretty funny.

Happy Solar Return and Natal Planetary Conjunctions
On the day you were born a pattern was set. Every year the Sun comes to the exact same position as it was on the day you were born - the transiting Sun is conjunct Natal Sun. So much energy focused on that particular day of the year can make you happy or depressed. So we manage and celebrate the day it by giving you ice cream and cake and sometimes we invite your friends over to sing songs - but if you are really lucky an astrologer will read your solar return chart. A Solar Return is a chart drawn up at the exact time the Sun returns to the exact same degree is was on the day you were born.  An astrologer using this chart can assess and predict the themes that will arise for you during your next “solar year”—the 12 months that happen from one birthday to the next.

You probably get used to the energy and moods of  the Moon since it returns to its natal position 13 times per year, however, Mercury returning to its natal position can often produce a really great idea, Venus can bring a note from an old friend and Mars can make you super energetic when they return to the position it occupied in your natal chart.

Jupiter returns to its natal position about every 12 years. Watch carefully for this event -  usually something really nice happens around that date! Jupiter's energy bring expansion, opportunity, luck and in general good vibrations.  You need to watch for the sextiles, squares, trines and oppositions of Jupiter and Venus to planets in your horoscope chart as well so you can anticipate that they will bring
 some special gift your way.

About every seven years Saturn really whacks you and pushes the book of life right in your face and says study up. Saturn is the planet brings astrologers clients. No one can explain your lessons or understand your Saturn transit better than an astrologer.

Saturn can be just down right mean. He can take away your love, your money and your health and throw it in the trash. He refuses to return it until you learn your lesson.  Saturn wants you to learn your lessons and learn them so well you won't forget. Right now Saturn is opposed my Sun and I am learning to live by my wits and write lengthy prose to a young astrologer named Leah, my student who asked me "Do planets influence our daily life?".  Hell ya! Saturn forces you to get up and get your act together.

The other planets Uranus, Neptune, and Pluto tremendously affect you and your peers about the same way. You should all get together, call it a study group;  you WILL learn your lessons whether you want to or not!

Eclipses
Then there are eclipses. They interrupt or rip the electrical field that protects the earth's atmosphere. In 2005 there was an eclipse visible over New Orleans.  In August everyone there learned a lesson as did the folks who were devastated by Rita.  If an eclipse aspects your natal planets the sensitive areas of your life that will be triggered.  Beginnings and endings occur and often we’ll begin a new stage in our life.

Everything I mentioned above influences companies large and small as well!  You can read about them in the Textbook for Financial Astrology.

Leah didn't really want that long of an answer  Sorry!

(Kaye Shinker passed away suddenly in November, 2011.  She is greatly missed.)

Sunday, February 7, 2016

Waiting for the dead cat to bounce

Randall Ashbourne, an associate of Astrological Investing, posts reports and articles on his web site at  theidiotandthemoon.com   The following is this weekend's Eye of RA report: Week beginning February 7, 2016 
It is now virtually certain that all major world stock markets are in the relatively early stages of a big bad Bear.  
We discussed the probability of that in the first two reports for this year, both of which can be accessed by scrolling down.
 
There is still a chance that Central Banks will try desperately to stop the drop, but they appear to have exhausted their ammunition.

The next major rally is, given the extreme levels of technical damage, most likely to be a dead cat bounce which will provide the last chance for many traders to exit Long positions before being wiped out.

That bounce may already be underway, with the mid to late January Lows marking a turning point for a upward-leaning grind that could run into May, perhaps even early June.

Venus conjuncted Pluto and squared Uranus last week, two strongly negative aspects. This week brings a trine to Jupiter. Given both planets are "benefic" and Earth signs are involved, we could see a level of stability return.

I did promise last month to include the current position of some Asian indices; we'll do that this week, as well as taking another look at Wall Street's SP500 and the ASX 200.

 The Nasdaq took a major hit last week, with some of the big name tech stocks rolling over badly. These had been helping to hold aloft the entire American market.

Pollyanna, the SP500, has not yet, I believe, actually confirmed it is now in a Bear market. But that scenario is now leaning heavily towards the probable, rather than the possible.

Below is the 500's long-range planetary price chart. The index is still trying to hold the Pluto level in the early 1870s. It is possible a rebound could take price all the way back to the 2080s. Still, long-term history shows it finds strong levels of both support and resistance at those orange Node lines.

The Weekly Planets chart for the ASX 200 is below, with the index opening and closing last week's trading within a band between grey Neptune now at 5012 and Uranus now at 4974.

There isn't much to stop a further drop if it dives again below the blue Saturns now converging at around 4949. And any rally is likely to find barriers in the 5184 to 5249 range.

India's Nifty is playing very closely to Pluto price lines. Traders can use these lines as potential targets, keeping a very close eye on daily charts for signs of positive or negative divergence starting to show whenever these targets are approached in actual trading.

Hong Kong has already fallen off its Bullish trend line ... something which has not yet happened decisively on the SP500 or ASX 200 ... and has also completed a backtest of the line. Big Bird, the 50CCI, is gasping in the dust of the mine floor.

There is a little positive divergence in the two faster Birds, giving at least some hope for a bounce "from the obvious" level of Fibonacci support.

It's a difficult call, though, since the index is currently stalled below long-range planetary price support. You'll note that in both charts, the next layer of major support doesn't come into force until around 16,000.

Singapore is holding up a little more strongly than the Hang Seng at this stage, still just hanging onto planetary support.

We can see the alternative levels of Fibonacci support and resistance in the chart below. Fibonacci levels and planetary prices will very often be quite close to each other.

The black lines are linked to the previous Bull High and Bear Low and the red ones run from the Bear Low to last year's High, and even a quick glance will show you both sets provide a reliable guide to the likely length of rallies and declines. Again, if you're actively trading in these dangerous conditions, use these as a big picture guide and watch the daily charts like a hawk for any potential turn as the prices are approached.

If this is a major, new Bear ... and it probably is ... the biggest, nastiest, fastest section of the crash is still ahead of us.

Safe trading - RA

Randall Ashbourne (Disclaimer: This article is not advice or a recommendation to trade stocks; it is merely educational material.)
Copyright: Randall Ashbourne - 2011-2016


The Idiot and the Moon, eBook, available for purchase


Sunday, July 12, 2015

High energy impact zone starts now

Randall Ashbourne, an associate of Astrological Investing, posts reports and articles on his web site at  theidiotandthemoon.com   The following is this weekend's Eye of RA report: Week beginning July 13, 2015 
We are now entering one of the astrological high-impact zones of the year.
In Forecast 2015, published in January as a free download, available in the Archives and in the Astrological Investing's shop, I outlined this period from mid-July to early-August with a heavy red border and indicated it was one of three periods likely to be significant for stock prices.

It has already been triggered by the passage of the Sun, but is about to get potentially even nastier.

Mars will oppose Pluto and square Uranus. Mars is symbolic of drive and energy, Pluto rules big power, big money and taxes, and Uranus is representative of "the little guy" demanding a fair go and radical reform.

We've discussed these many times in the past few years because of the long-running square aspect between Uranus and Pluto.

It'll start to get even more intense this week when Venus squares Saturn, an aspect the big guy, Jupiter, will repeat in early August.

And Venus, the ruler of money, material values and diplomatic relations, will soon go retrograde.

Let's not worry ourselves too much about trying to predict the outcome of the astrological transits and, instead, take a look at where we are, primarily with Wall Street's SP500.

In March, I warned that the 500 was about to start running into a series of primary, downtrending planet lines likely to heavily stall the rally.

Incidentally, the same thing will happen to the Australian stock market in the next couple of weeks, but I'll deal with that later in this edition. In the June edition, I indicated traders had to keep a close eye on a primary Pluto level of $2084 for the Pollyanna index (SP500).

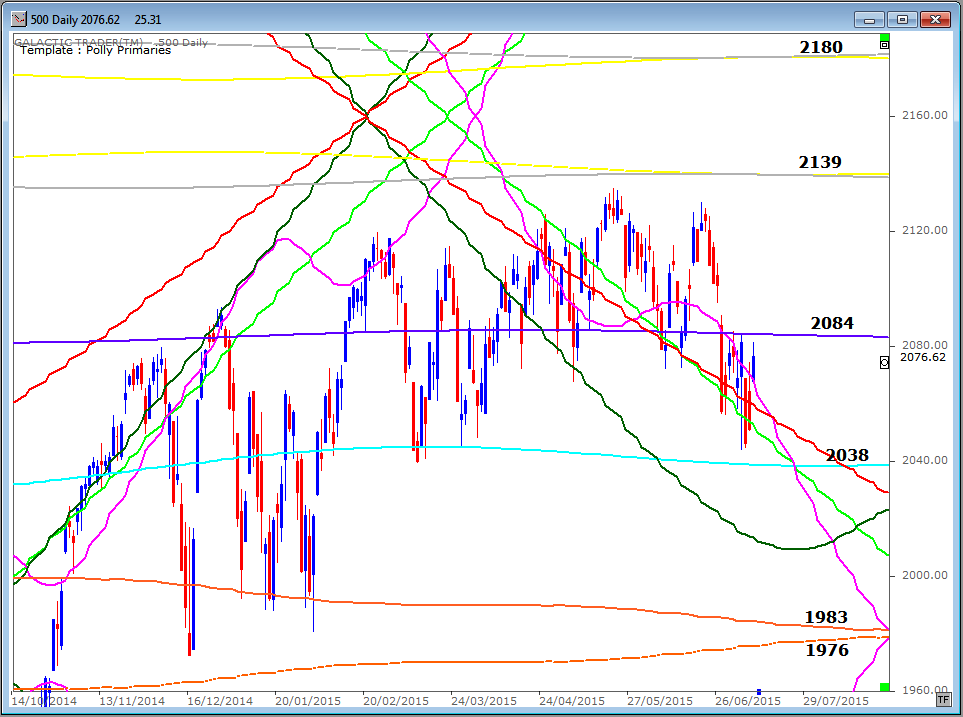
It lost the support of that line and is now on its third attempt to retest it from the downside. Strong recovery, especially on a weekly basis, could see Wall Street launch into a rally likely to take it to $2180 or higher. A failure to do so will see prices drop back down under the influence of the falling primary planet lines. 
Remember that we are now in the weakest portion of the stock market year and the "sell in May" theory may be taking effect, with a decline all the way to October.

The chart below shows Pollyanna's long-range planetary price lines and a continued decline could see it drop a lot further yet.
Forecast 2015 also listed the major Bradley Model turn dates for the year ... and this is what has been happening, so far. I always warn you it is the dates which are important, not the direction nor the amplitude of the trend change.

April 3 was two days off a low; May 22 was one day off the all-time closing high; June 8 was one day off a low. The next major turn date doesn't arrive until early October, though there are two minor dates in the next couple of weeks during this high-energy astrological zone.
Now, let's take a technical look at how Pollyanna is holding up. Below is the long-range monthly Bi-BB chart, using a fast MACD as the oscillator and showing a trend pitchfork.

For the past few years, the 500's prices have travelled very strongly within the upper tier of the monthly Bi-BBs. This very useful technique is outlined in The Technical Section of The Idiot & The Moon.

As well as that, Polly has been trying valiantly to ride along the top edge of the major, blue tyne of the pitchfork. We are starting to see signs of deterioration in the strength of that advance ... and with negative divergence in both the MACD signal lines and histograms.
The deterioration is also evident in a weekly chart, where the pitchfork's tynes are anchored at the first major correction after the Bear bottomed in 2009. The angle of the uptrend continues to hold, but price is finding it increasingly difficult to sustain ... and the Big Bird oscillator doesn't seem convinced that the current correction has completed.

In short, we all need to be very careful in these few weeks into early August.
That might be particularly true for the Australian market. It is now facing the same problem which has thwarted the Wall Street rallies in recent months ... a heavy set of downtrending inner planet lines almost immediately ahead.

If you take a quick eyeball at the left-hand side of the chart, you get an idea of what contact with these once-a-year downtrend lines can do to the index!
The trouble will come if the index rises into around $5700 by the end of the month. During all the volatility of the past couple of months, the ASX 200 has been routinely playing with blue Saturn price lines on its Weekly Planets chart.

The Big Bird oscillator isn't hopeful, at this stage ... and you can see the resistance around the $5700 level is also emphasised on this chart. In any case, these price targets have been working exceptionally well for weeks now ... for initiating Longs or Shorts!
Safe trading - RA
Randall Ashbourne (Disclaimer: This article is not advice or a recommendation to trade stocks; it is merely educational material.)
Copyright: Randall Ashbourne - 2011-2015


Read Randall Ashbourne's FREE report
THE IDIOT AND THE MOON FORECAST 2015
Astrological Investing's associate, Randall Ashbourne, is the author of the eBook, The Idiot and The Moon,  Ashbourne's Galactic Trader planetary charts are revealing illustrations of exactly what has occurred in the market and the probability of what to expect.

The Idiot and the Moon, eBook, available for purchase

Sunday, March 29, 2015

Heading into a major Bradley turn date

Randall Ashbourne, an associate of Astrological Investing, posts reports and articles on his web site at  theidiotandthemoon.com   The following is this weekend's Eye of RA report: Week beginning March 30, 2015  
The coming week, heading into various religious festivals, also brings the first significant Bradley Model turn date for 2015.

The Full Moon next weekend will be a lunar eclipse ... sister of the recent solar eclipse ... and the configuration will again trigger the broad implications of the long-running Uranus-Pluto square we've talked about many times in the past few years.

Uranus and Pluto have now completed exactitude of the square for the last time, but the "orb" of the aspect will continue to linger.

Jupiter, head honcho of the Old Gods, will also be strongly influential in the next few weeks, as it goes Direct and receives a trine from the Sun. Strong Jupiter periods tend to exaggerate either optimism or fear, so we can expect some explosive moves ... one way or the other.

The period finds Wall Street's SP500 index beginning to bump its highs against some major planetary resistance and it's that we'll spend a little time looking at in this edition.

There are also updates on the ASX 200, Germany's DAX and London's FTSE

About once a year, depending on the speed of rallies or downturns, the SP500 comes into contact with primary price lines from the inner planets ... the Sun, Mercury, Venus and Mars.

In our first chart, we'll look at how these tend to impact rally phases in the index. It's a weekly price chart showing only the Sun and Venus primary lines. Price tends to rise at an angle closely aligned to the annual movement of the planets.

Sometimes price stalls and goes sideways, until it picks up a boost from contact with the next set of rising price lines.

But, what goes up must come down, at least to some degree, and our next chart shows the Sun-Venus impact on the timing and speed of major downturns and significant Bear plunges.

Contact with these downtrend planetary price lines does not always produce a major downturn. But, when one is becoming due ...

Well, the impact can be dramatic.

In our third chart, I have included Mercury and Mars into the mix and we will take a close-up view to show the sort of danger the 500 now faces if it cannot burst above the resistance of the planetary downtrend lines. What it suggests is that Wall Street is now very close to hitting a major hurdle ... a set of planetary influences which almost always produce a multi-week correction.

Our next chart shows the more horizontal price lines of the outer planets and provides the major probable targets for rallies and declines. Regular readers will have become quite familiar with these and know they provide excellent Entry and Exit levels for trades ... if the oscillators on shorter-term charts are showing distinct potential for a trend turn.

Of the other major Western stock indices, Germany is the strongest. And just maybe too strong. Its northbound breakout in the past few months catapulted it above what should have been, based on historical behaviour, a strong resistance barrier.

And our Big Bird oscillator isn't really overjoyed by the move.

While the DAX has left its two previous Bull peaks way behind, the British market continues to struggle against the long-range planetary price lines which acted as a slaughter house for the earlier Bulls.

Allow a little leeway for the posted prices because they're "wavy" and exactitude depends entirely on timing for the monthly bars.

Australia is also faltering at a hurdle ... in the ASX 200's case, a double Fibonacci Retracement barrier. The index managed to break free of the doldrums in the past few months and put on a spurt.

There is some disagreement about exactly where the current blue Fibo Rx level lies because of data differences at the 2009 low ... but all levels of the blue lines displayed below have been important during the past few years and the data difference is not really major.

You'll note that on the chart above, the Big Bird oscillator is starting to sing off-key and that it is a double Fibonacci barrier.

Turning our attention to the ASX 200's Weekly Planets chart, we can note a primary Saturn barrier not far ahead at around 6050, with a Neptune level at 6082.

Weekly Big Bird is even more distinctly off-key than his monthly version as price battles to overcome the minor Saturn resistance around 5942.

And, yes, I've been terribly slack this year ... first time in years I've been able to enjoy the southern Summer and, literally, take some time out to smell the roses.

And they smell so much better than Pollyanna!

I will try to include the Indian/Asian indices in the next few weeks.

In the meantime, just keep a weather eye on the near-term charts, especially with the Bradley date approaching (all of which was covered in the Forecast in January) and as Pollyanna bumps her silly noggin against the inner planet downtrend lines.

Safe trading - RA
Randall Ashbourne (Disclaimer: This article is not advice or a recommendation to trade stocks; it is merely educational material.)
Copyright: Randall Ashbourne - 2011-2015


Read Randall Ashbourne's FREE report
THE IDIOT AND THE MOON FORECAST 2015
Astrological Investing's associate, Randall Ashbourne, is the author of the eBook, The Idiot and The Moon,  Ashbourne's Galactic Trader planetary charts are revealing illustrations of exactly what has occurred in the market and the probability of what to expect.
The Idiot and the Moon, Compleat & Utter Lunatic Idiot's Guide to Trading Stocks,

Sunday, November 30, 2014

Flamboyance or Fear in store this week

Randall Ashbourne, an associate of Astrological Investing, posts a weekly market report on his web site, theidiotandthemoon.com  The following is this weekend's Eye of RA report: Week beginning December 1, 2014 

 American stock indices changed little during last week's Thanksgiving-shortened trading.

India continues to hit new Highs, but now faces a technical challenge after the Nifty hit 8617 last week. That's a precise 100% extension of the first recovery rally from October 2008 to November 2010, anchoring the current rally from the December low of 2011.

Germany's DAX was also a strong performer last week, but many other indices mirrored the go-nowhere behaviour of Wall Street.

The SP500 is still trying to reach the planetary barrier at 2082 shown in last weekend's charts. Astrologically, we are heading into statistically negative Full Moon next weekend, but the key day in Euro-American markets is likely to be Thursday when the Sun trines Uranus, Venus trines Jupiter and Mars leaves Capricorn for Aquarius.

As we've talked about before, trines have a tendency to break barriers and Uranus, in particular, likes to break things. With the Sun and Venus both in Sagittarius interacting with Uranus and Jupiter, we would expect to see some exaggerated moves ... simply because Sadge, the FatBoy and El Weirdo never do anything with quiet good taste and discretion.

So, we're likely to see the professionals return to their desks this week, bouyantly optimistic about where it's all going ... or gripped by fear that they've run too far, too fast.

Thursday should give us a clue.

Safe trading - RA

Randall Ashbourne (Disclaimer: This article is not advice or a recommendation to trade stocks; it is merely educational material.)
Copyright: Randall Ashbourne - 2011-2014


Astrological Investing's associate, Randall Ashbourne, author of the eBook, The Idiot and The Moon, and The Idiot and the Moon, Forecast 2014, writes a free weekly column titled, The Eye of Ra on his web site in  which he explains the potential impact of astrological aspects and the current state of technical conditions. Ashbourne's charts are revealing illustrations of exactly what has occurred in the market and the probability of what to expect.

Sunday, July 20, 2014

Storm warnings in space

Randall Ashbourne, an associate of Astrological Investing, posts a weekly market report on his web site, theidiotandthemoon.com  The following is this weekend's Eye of RA report: Week beginning July 21,  2014 
The astrological weather patterns are about to make a dramatic change.

We have planets changing signs, changing directions, and making a series of intense, high-energy aspects with each other.

And since a lot of that energy is unleashed over the next week or so, it could be enough to generate a super storm.

Jupiter has now moved into Leo and is about to be joined by the Sun; Venus has moved into Cancer; Mercury is about to oppose Pluto and square Uranus; Saturn is changing to Direct motion while Uranus goes into Retrograde mode.

And the killer change is Mars finishing an unusually long journey through the diplomatic sign of Libra, shifting into Scorpio and heading for a conjunction with Saturn ... when the "drive" energy smashes into a brick wall.

Mars is the traditional ruler of Scorpio. Mars in his primary sign, Aries, is an all-action hero; more Ego than IQ. The Scorpio version is much, much deadlier ... a deep-thinking, deep-scheming, vengeful, poisonous piece of work who fights to the death.

I've discussed with you many times before how Pollyanna, the SP500, rises and falls within Martian channels between long-range Node price levels.

Other indices tend to do the same, though Uranus, Neptune or Pluto tend to be more reliable as horizontal price stoppers.

Anyway, let's have a look at where Polly is within her long-range Mars channels. In the chart below, I'm showing only the rising channels. We can see that the last Bear bottom was recorded with a small break of what I've labelled as the primary channel bottom.

Price rebounded from there to the next higher primary Mars line, which I've labelled as the channel top. We've had only one major breach outside of that primary channel ... the countertrend down marked with a yellow oval.


Okay, now let's move in for a close-up. The horizontal orange lines marked with 2003 and 1955 are primary Node prices. As I said, the SP500 tends to move in Martian channels between Node price levels.

So the $1955 to $2003 range is a major, long-range danger zone. The declining, dotted red lines are the Martian downtrend channels. In brief, a weekly close below the $1950s could well signal the start of a major correction in this index ... possibly even the start of a new Bear trend.


The ASX 200 has stalled yet again at the $5533 Saturn barrier on its Weekly Planets chart, after a failed attempt to breakout higher, falling a tad short of hitting the Uranus price line at $5565. We've had only a single weekly Close above this line since Auntie started playing with it 22 weeks ago. Breakout or breakdown, you old bat!


Now let's have a quick look at gold. At 2am New York time last Monday, the mysterious "somebody" suddenly dumped over a billion dollars worth of gold contracts onto the market. It was followed a few hours later by a multi-billion-dollar dump.

Obviously, it was yet another calculated move with only one aim ... to end the rally in gold prices. Nobody dumps a billion dollars worth of anything onto a thinly-traded 2am market expecting it will cause a price jump. It's designed solely to cause a selling panic when the markets open for real.


One suspects it was a co-ordinated move by big central banks. It's not the first time we've seen these out-of-hours, mega-billion dumps and it probably won't be the last.

However, it was not enough to totally trash the distinct possibility that a long-range bottom in the gold price was cemented with the double-bottom in June and December of 2013.


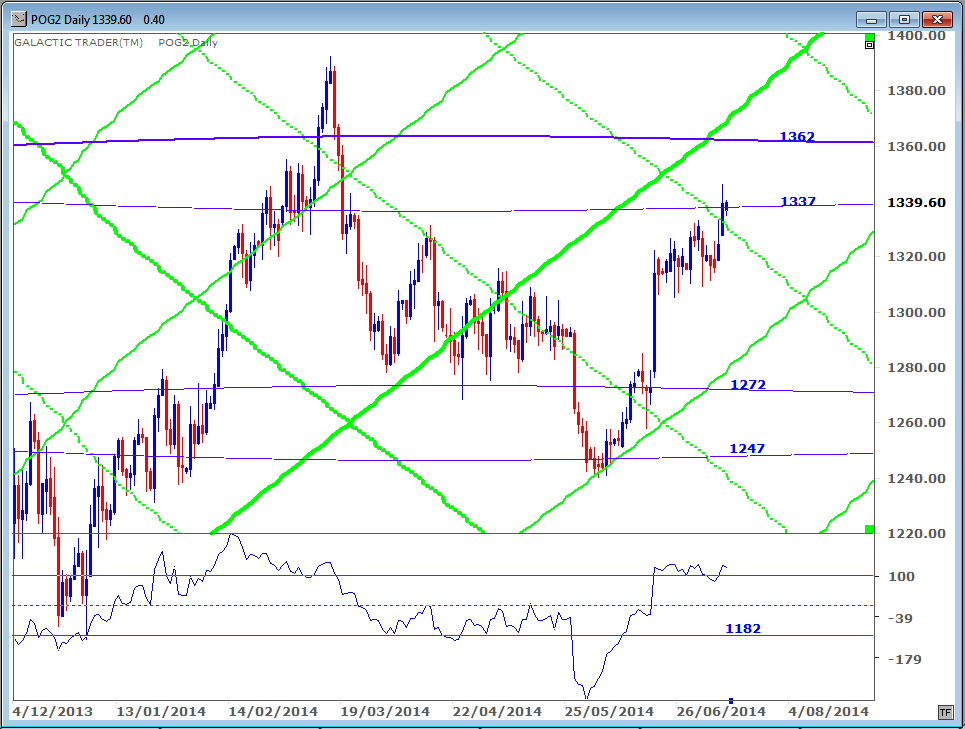
I raised the possibility some time ago that the trend had changed when gold moved out of its Sun downtrend channel. On the above chart, I add a blue technical downtrend line. It put a stop to the last rally, but it, too, has now been broken.
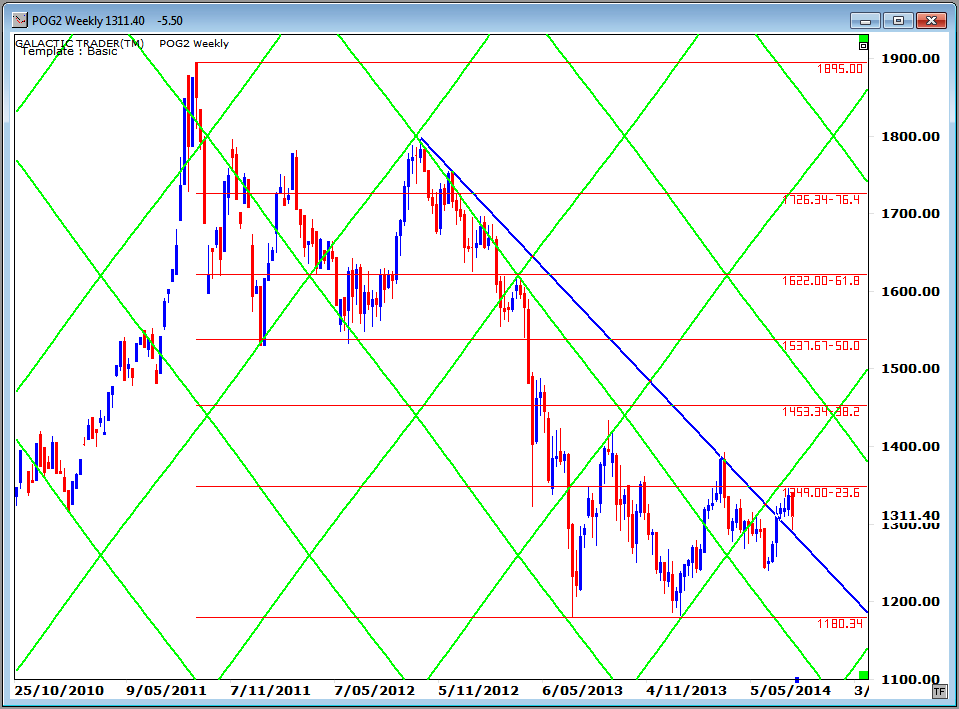
In fact, last week's plunge seems to be a retest of that line ... from the top side. If it holds, it is potentially very, very Bullish. We can't be too optimistic until price can break above the first Fibonacci Retracement barrier around $1350. If it can manage that, it will be doing so with quite extreme positive divergence readings in the Fast and Medium range Canaries on gold's monthly chart, indicating that the gold Bear is back in hibernation and a multi-year rally is underway.

Safe trading - RA

Randall Ashbourne (Disclaimer: This article is not advice or a recommendation to trade stocks; it is merely educational material.)
Copyright: Randall Ashbourne - 2011-2014


Astrological Investing's associate, Randall Ashbourne, author of the eBook, The Idiot and The Moon, and The Idiot and the Moon, Forecast 2014, writes a free weekly column titled, The Eye of Ra on his web site in  which he explains the potential impact of astrological aspects and the current state of technical conditions. Ashbourne's charts are revealing illustrations of exactly what has occurred in the market and the probability of what to expect.


Important reading:  Randall Ashbourne's The Idiot and The Moon, Forecast 2014  


  Purchase Forecast 2014 and receive a special report on GOLD 
 

Sunday, July 13, 2014

Jupiter in Leo ... the affected sectors

Randall Ashbourne, an associate of Astrological Investing, posts a weekly market report on his web site, theidiotandthemoon.com  The following is this weekend's Eye of RA report: Week beginning July 14,  2014 
The head honcho of the Old Gods ... Gee,Zeus, Jupiter, the Fatboy ... goes into the Fire sign, Leo, this week.

He'll be heading to the salon for a new "do" and shopping for a set of the emperor's new clothes.

I probably shouldn't be making fun of the guy who throws thunderbolts around when he's off his Adderall, but have you ever tried swapping jokes with Saturn?! Ugh.

Anyway, I received a note during the week from a reader wanting some further explanation of how Jupiter affects sector rotation ... the regular shift of money away from the popular to the unpopular.

I've touched on this a few times and you might want to take another look at the January 20 Eye of Ra in the Archives.

Basically, though, Jupiter increases either the demand, or the supply. The biggest impacts tend to be in the sectors ruled by the sign Jupiter is entering - Leo; the sign he's opposing - Aquarius; and the signs he's squaring - Taurus and Scorpio.

In January, I urged you all to look at gold and gold mining stocks for a possible long-range shift in the trend. So far, so good ... and that trend shift is giving fairly strong indications of being underway.

The other sectors ruled by Leo are: Amusement parks, gambling and casinos, games and toys, jewelry, recreational vehicles and stock brokers.

Aquarius rules: Aerospace and aircraft, computers and technology, radio and TV broadcasting, electrical equipment, satellites and stock market profits.

Taurus and Scorpio rule: Banks and insurance, debt and taxes, copper, bonds, financial institutions, cattle, candy and corn.

So, the idea is that we look at stocks in those sectors to see which ones appear to have been putting in a solid, long-range bottom OR are showing distinct signs of topping out.

Okay, a reminder that this week brings a Bradley major trend change date.

Let's see where we are ... starting with the Pollyanna index, Wall Street's SP500. She dropped to the Node line at 1952 last week, but bounced back into the Node range now priced from 1955 to a whisker above 2000.

The DJIA is riding a technical channel, unable to climb back inside the upper tier ... and with no new peak in the Big Bird canary since March 2013.

On the northern side of the lakes, Toronto is stalling at a long-range planetary price level. The index made a Bear bottom at a Pluto/Node zone and is now testing a higher level zone priced from the 15,100s to 15,900s.

On the other side of The Pond, London's FTSE continues in its range-bound torpor. It makes Midsommer Murders looks like a Michael Bay action movie.

Germany still can't keep its head above the long-range Pluto barrier in the early 10,000s.


Paris is swooning, though may have reached a bounce level.


And dear old Auntie, the ASX 200, hit 5532 again ... and reached for the smelling salts. Again.


I indicated recently I could see no instance on the gold charts where a rally stalled before hitting an upside Sun or Pluto line. And there still isn't one, since the price of gold made contact with both of them last week.

Safe trading - RA

Randall Ashbourne (Disclaimer: This article is not advice or a recommendation to trade stocks; it is merely educational material.)
Copyright: Randall Ashbourne - 2011-2014


Astrological Investing's associate, Randall Ashbourne, author of the eBook, The Idiot and The Moon, and The Idiot and the Moon, Forecast 2014, writes a free weekly column titled, The Eye of Ra on his web site in  which he explains the potential impact of astrological aspects and the current state of technical conditions. Ashbourne's charts are revealing illustrations of exactly what has occurred in the market and the probability of what to expect.


Important reading:  Randall Ashbourne's The Idiot and The Moon, Forecast 2014


  Purchase Forecast 2014 and receive a special report on GOLD