Randall Ashbourne, an associate of
Astrological Investing, posts a weekly market report on his web site,
theidiotandthemoon.com The following is this weekend's Eye of RA report: Week beginning April 1, 2013
 As I
promised last weekend, this edition updates the intermediate-range
Weekly Planets price targets for a number of Asian stock markets.
As I
promised last weekend, this edition updates the intermediate-range
Weekly Planets price targets for a number of Asian stock markets.
A couple of them - Malaysia and Indonesia - are way up there with the Wall Street indices.
Most world markets, however, have diverged significantly in a way not too dissimilar to what happened during the 1999-2000 Bubble top.
We'll have a look at a very long-range log chart for Miss Pollyanna, the SP500, in a moment. But, before we do, we'll have a little chat about the USA's horoscope for 2013.
And, I should also point out ... in terms of lies, damned lies and statistics ... that April is, on average, Pollyanna's strongest-performing month of the year; stronger even than the Santa Claus rally month of December.
But, let's talk first about America's 2013 birthday. Regardless of the exact time or date used to create the USA's birth chart as an independent nation, one thing is absolutely certain ... it has a Sun-Venus-Jupiter conjunction in the sign of Cancer.
Jupiter is still in Gemini, but is now tracking towards Cancer. Jupiter is "exalted" in Cancer. That is, the FatBoy is even grander, bigger and more benign than usual.
The Sun-Venus-Jupiter conjunction in the USA's natal chart explains a lot - both positive and negative about American traits and sociological history. And it also helps to explain why the country currently tends to believe it's immune from SinoEuropean contagion and is back in its "rightful" place as the leader of the world.
Hubris. In ancient Greek lore, it was basically the only real sin. Pity the modern Greeks and their Cypriot cousins forgot the old rules.
Below is a long-range log chart for Pollyanna, displaying a virtually perfect harmony with the trend line lessons and channels outlined in The Technical Section of
The Idiot & The Moon.
 |
| Click for larger image |
I've mentioned before that the period from 1999 until now shows a distinct similarity with what happened during the 1960s, the period marked with a yellow oval.
During that period, Wall Street had three Bull runs and three Bear crashes. The Bull peaks were successively higher and the Bear bottoms progressively lower. The current period is not an exact replica, but at an eyeball glance, it does look to be remarkably similar.
And that is a LOT of negative divergence building-up in the long-range oscillator.
The point is ... with Jupiter heading towards a conjunction with the USA's extraordinarily benign natal configuration, we can't totally rule out new highs in Pollyanna, and possibly a lot higher than we've believed likely. But ... when Polly exits stage left and Chicken Little grabs the spotlight again, the downside could cut very deep.
More about that in coming weeks. Let's take a look at some of the Asian indices, starting with the Shanghai Composite.
 |
| click for larger image |
A couple of editions ago, we had a chat about gaps. Shanghai created a couple of big ones on its weekly charts as it bounced strongly out of its last Low. The first of the gaps was filled with a strong decline 6 weeks ago and last week's downturn has gone very close to filling the one at 2233.
The state of the oscillator suggests there is no cause for panic or overt pessimism; it's the strongest it has been since early 2011 and its most recent peak displayed clear positive divergence.
 |
| click for larger image |
Hong Kong's Hang Seng Index is above. It is currently trying to hold the primary Saturn line around 22,000, after failing to reach the Neptune line at 24,000.
Singapore's Straits Times Index, below, is in a stronger position, still apparently striving to reach its Neptune target.
 |
| click for larger image |
The Singapore bounceback began within a Uranus/Pluto cluster of price lines and it may be trying to get to a similar planetary zone, now priced close to 3500 at its lower range.
Indonesia ...
 |
| click for larger image |
Jakarta is making all-time highs, though it's doing it with negative divergence just starting to show in the oscillator. That doesn't rule out new highs in the near future, but the wave structure is beginning to look complete, leaving the index ripe for a correction.
And Malaysia is looking similar ...
 |
| click for larger image |
Just at an eyeball glance, Kuala Lumpur has a tendency to make primary moves between Node price lines (orange), with weekly stops at Saturn prices. You can see why there has been a lot of stalling in the current price range; that's a first harmonic Node line the index is trying to breakout above ... from a bounce which began at a false break of the 1st harmonic line currently priced about 1300.
In other words, it has completed its full Node-to-Node price run and now needs to breakout or breakdown. And the price targets for both scenarios are listed.
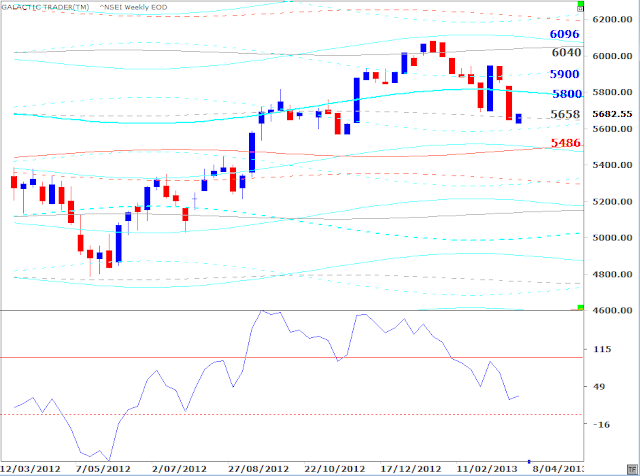
Mumbai is next ...
 |
| click for larger image |
Okay, so that brings most of my Asian readers up-to-date. The price targets on the Weekly Planets charts from last weekend will not have changed very much. You can always copy the image and draw-in your own price bar for the week if you need a visual guide of how your favorite index is doing.
Safe trading - RA
Astrological Investing's associate, Randall Ashbourne, author of the eBook, The Idiot and The Moon, and The Idiot and the Moon, Forecast 2013, writes a free weekly column titled, The Eye of Ra
on his web site in which he explains the potential impact of
astrological aspects and the current state of technical conditions.
Ashbourne's charts are revealing illustrations of exactly what has
occurred in the market and the probability of what to expect.
Important reading: Randall Ashbourne's The Idiot and The Moon, Forecast 2013 , Jupiter's cycle and its effects on Wall Street and a posting of the weekly Eye of Ra report in this blog, titled A look at the Venus Retrograde effect
(Disclaimer: This article is not advice or a recommendation to trade stocks; it is merely educational material.)
Copyright: Randall Ashbourne - 2011-2013
 The Idiot and the Moon, Forecast 2013
Major trend change dates for the full
year, plus a month-by-month breakdown of high-energy
trading dates and critical reversal dates.
An index-by-index analysis of Moon Trading
across major American, European, Asian and
Australian stock indices-
Identifies the
major indices where following the phases of
the Moon can dramatically cut profits, or
even result in large losses.
Old Gods & Gold ... a Eureka!
discovery about exactly what drives gold prices
during rallies and corrections and charts
showing highly-reliable target levels to both
the upside and downside.
These price charts are individually-tailored
to each index and cover Wall Street, Australia,
Canada, Hong Kong, Singapore, Shanghai, India,
England, Germany and France.
You
will not see these charts anywhere else on the
Internet!
And much more...It is NEVER too late in the year to have this monthly information!


