Showing posts with label Mars in Aries. Show all posts

Sunday, March 24, 2013

WP: USA, TSX, FTSE, DAX & ASX

Randall Ashbourne, an associate of Astrological Investing, posts a weekly market report on his web site, theidiotandthemoon.com The following is this weekend's Eye of RA report: Week beginning March 25, 2013

 Sun and Venus in Aries with Mars in Aries conjunct Ur sq PL
This weekend I'll update the Weekly Planets charts for a range of Western stock indices ... and do the same for Asian markets next weekend.

We have a highly critical week ahead going into the Easter break, with the Sun, Venus and Mars all making aspects to the Uranus-Pluto square.

We've discussed the implications of the Uranus-Pluto square at length over the past year or two.

Basically, it pits the forces of rebellion and radical change against the entrenched status quo protected by ruling elites. Pluto is big money and big power, big debt and big taxes; Uranus is the voice of "the people", though with the old weirdo in Arien mode these days, the voice is a little like Mao's dictum: Political power grows out of the barrel of a gun.

Squares are always an "action" aspect in astrological symbolism ... and even more inclined that way when the action signs, the Cardinal signs, are involved.

We've been seeing the signs everywhere since the aspect began; from the Arab Spring rebellions to the changes in China, from political angst virtually everywhere to banking crises almost everywhere.

And with Mars, now in its primary home sign Aries, being joined by the Sun and Venus, it adds a potentially explosive charge to the mix in the coming week.

So, we will take a look this weekend at some intermediate-range Weekly Planets charts for a range of Western indices. I'm not sure anyone can predict reliably what the Plutocrats have in mind for the Wall Street markets.

While the Dow has been making new highs and the SP500 keeps trying to, other markets ... and even the NDX ... display uncertainty.

Our first chart this weekend shows important planetary barriers which have a long-term impact on Pollyanna's prices.

click for larger image
Miss Polly has huge price gaps all over the place and you might want to consult last weekend's edition in the Archives if you missed it.

The media always promotes these surges as "investors piling back into the market". It's nonsense. "Investors" aren't sitting at their computers at 4.30am forcing a huge gap in opening prices. No, no ... that job falls to the computers run by the big banks.

Basically, the big banks which own the US Federal Reserve; and that would be the Fed that's printing $85 billion a month to deposit with its owners, while the political system struggles to make an annual cut of $85 billion to spending programs.

However, let's not concern ourselves with a political polemic. For the past couple of weeks, the SP500 has been stalled around a Jupiter-Neptune level ... and there are two primary (ie: strong) planetary lines not far overhead. The orange Node line is at 1572 and the cyan Saturn is at 1579. I would expect either of these to provoke a fierce reaction downwards if they're hit before there's a deeper correction.

click for larger image
The Nasdaq 100 remains below its peak from October last year - despite the optimisim of the DJI and Pollyanna. Both the signal line and histogram peaks in the fast MACD continue to send warning signals as the NDX continues to be stalled by an overhead Saturn.
click for larger image
Canada has been stalled for even longer than the Nasdaq - and, again, it's a combined Saturn/Uranus zone that's blocking a breakout.

And ditto with the DAX ...

click for larger image
London's FTSE is below. Note the difference in the state of the MACD. While the DAX is showing the same warning signals as the NDX, we're not seeing that build-up yet in the FTSE.

click for larger image
And the ASX 200 is below ...
click for larger image
I've mentioned in the past couple of weeks the negative divergence being displayed by the Canary on this index and regular readers will know this is a Neptunian index, so the false break and drop from the 5139 line isn't really an unexpected surprise.

And nor should be the price level which stopped the drop ...
click for larger image
It serves as a good example of applying, in real time, the technical lessons about gaps, Fib Rx and Fib Xt levels I went through last weekend.

I finished last weekend with these words: "You might not get a nice gold star from the teacher. Learn the lesson well, though, and you just might get a few gold bars - real ones ... that you earned for yourself!"

There are know-it-alls out there who'll happily bore you witless with their opinion that there is no such thing as "a Holy Grail" when it comes to making stock market profits. In fact, there are probably at least 100 of them. There isn't one that will guarantee you the exact top and precise bottom of every rally and decline.

But, I stand by what I said last weekend ... learn a few simple lessons really well and you'll learn how to make money.

Next weekend ... an update on Asia.

Safe trading - RA

Randall Ashbourne
Astrological Investing's associate, Randall Ashbourne, author of the eBook, The Idiot and The Moon, and The Idiot and the Moon, Forecast 2013, writes a free weekly column titled, The Eye of Ra on his web site in  which he explains the potential impact of astrological aspects and the current state of technical conditions. Ashbourne's charts are revealing illustrations of exactly what has occurred in the market and the probability of what to expect.
Important reading:  Randall Ashbourne's The Idiot and The Moon, Forecast 2013 , Jupiter's cycle and its effects on Wall Street and a posting of the weekly Eye of Ra report in this blog, titled A look at the Venus Retrograde effect
(Disclaimer: This article is not advice or a recommendation to trade stocks; it is merely educational material.)
Copyright: Randall Ashbourne - 2011-2013

The Idiot and the Moon, Forecast 2013
  • Major trend change dates for the full year, plus a month-by-month breakdown of high-energy trading dates and critical reversal dates.

  • An index-by-index analysis of Moon Trading across major American, European, Asian and Australian stock indices-

  • Identifies the major indices where following the phases of the Moon can dramatically cut profits, or even result in large losses.

  • Old Gods & Gold ... a Eureka! discovery about exactly what drives gold prices during rallies and corrections and charts showing highly-reliable target levels to both the upside and downside.

These price charts are individually-tailored to each index and cover Wall Street, Australia, Canada, Hong Kong, Singapore, Shanghai, India, England, Germany and France.

You will not see these charts anywhere else on the Internet!

And much more...


Saturday, March 9, 2013

Wall Street, Europe, India - and Mars

Randall Ashbourne, an associate of Astrological Investing, posts a weekly market report on his web site, theidiotandthemoon.com The following is this weekend's Eye of RA report: Week beginning March 11, 2013


Three things for the week ahead - the fishy New Moon, Mars entering Aries, and the final week of the current Mercury Retrograde period.

Those of you who have bought Forecast 2013 may wish to consult the chapter on market performance as Mars travels through Cardinal signs ... and, in particular, what has tended to happen with Mars in its primary home sign.

And it would also be worth consulting the Moon chapter, starting on Page 17, to see exactly how your favorite index performed during the lunar phases for the first few months of last year.

Since I published a variety of Asian markets charts last weekend, I thought I'd swap back to Europe and India in this edition.

Last weekend, I highlighted a couple of exact hits in the Asian indices on my Weekly Planets charts targets. I'll show you a couple of other exact hits in the NDX and ASX during the rallies over the past week.

This week kicks off with the statistical high period of a New Moon and with Mars changing signs into Aries, which launches a new Martian cycle through the zodiac over the next couple of years.

And we will be in the final week of the current 3-week Mercury Retrograde phase.

It's Mercury we'll start with this weekend. As the phase was coming up, I indicated that what tends to be normal is that markets will start a trend at the Rx date which changes course halfway through ... and by the time of the Mercury Direct date a few weeks later, prices are often back within 1% of where they were on the Rx date.

Click for larger image

You can see this tendency at work on the chart above where I've marked the Mercury Rx period late last year with black vertical lines; the Rx date starts a downward plunge ... which does a complete turnaround halfway between the two black lines ... to finish the phase with price back within the range of the bar at play on the Rx date.

Now, as I said, this is the "normal" behaviour of at least the Wall Street markets. It doesn't work every single time ... but we need to be aware of the possibility for markets to reverse course in the coming week; particularly since we enter the statistically negative phase between New Moon and Full Moon.

The other major astro event of the coming week is Mars moving out of Pisces into Aries, which means it will soon conjunct Uranus and square Pluto. We're almost certain to see more armed rebellions making headlines in the next few weeks.

If you happen, though, to come across any strident astrologers screeching about "the Mars-Uranus crash cycle", please consult last year's Archives.
Click for larger image

On the chart above, previous conjunctions between Mars and Uranus are marked with the thick red bars; the squares to Pluto are marked by the heavy blue bars.

Some of them occur sort-of, more-or-less, near highs ... and some of them don't do diddly. Conclusion - there is no reliable prediction that can be made about what will happen just because Mars is making Uranus/Pluto aspects.

Now, onto the Nasdaq 100 ...

Click for larger image

I indicated last weekend that I really had no idea whether Pollyanna and the NDX were going to breakout northwards, or break down. About the SP500, I said: "Overcoming that overhead Uranus/Pluto hurdle opens targets in the range from about 1548 to 1572."

Pollyanna's high for the week was at 1552.48, inside the lower end of the stated range. And I published the NDX Weekly Planets chart, showing the upside targets if it managed to finally breakout above the Uranus line now priced at 2773. The high for the NDX came in at 2812.73 - basically an exact hit on the 2812 target which has been marked on the Weekly Planets chart for the index for ages.

The ASX 200 put in a similar performance.

Click for larger image

The 5132 target has been marked on Auntie's charts for weeks - and she obliged last week, making a small overshoot to 5135.7 before backing off.

Obviously, in both cases, if the rally mode ignores the Merc Rx tendency, the next obvious targets are marked.

Now, since it has been a while since I updated the European charts ...

England:
Click for larger image
The FTSE finally broke through the 6412 level and came to a halt at a weekly Saturn line.

Click for larger image
Germany:
Click for larger image

The DAX cracked the Neptune ceiling - and like London, was stopped by Saturn. I would think, given the consolidation in the index within a Neptune/Uranus zone last year, that it probably wants to reach the overhead Uranians in the range from 8028 to 8169.

France:
Click for larger image

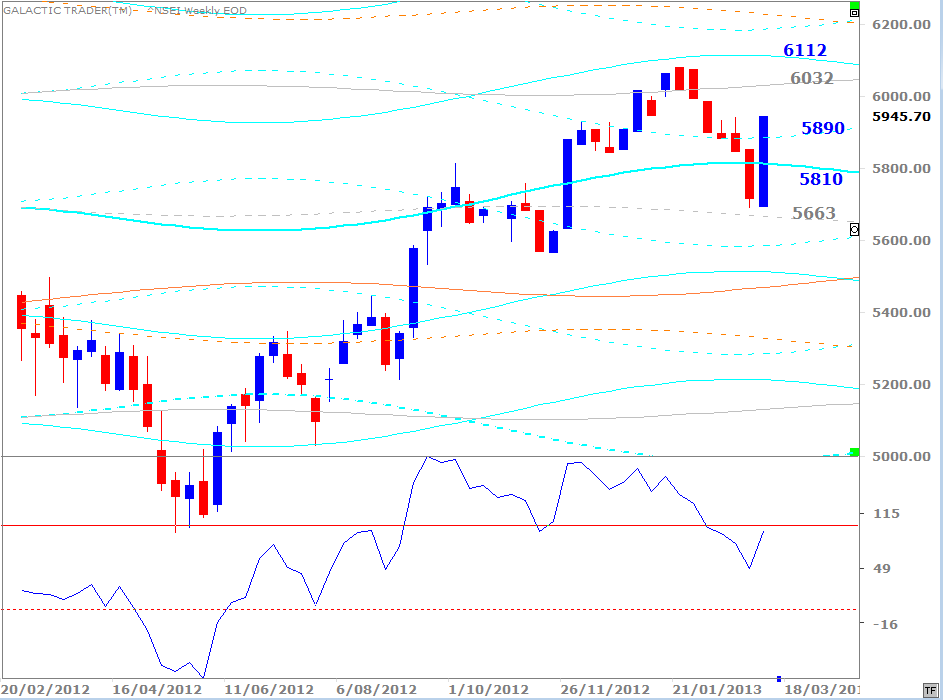
India:
Click for larger image

There is no need to explain these. I've given examples last weekend and this edition of just how precise these targets are. Those of you who have Forecast 2013 should also consult that section which details the exact long-range targets for the key American, European and Asian indices for this year.

Have a look, even if you're not Australian, at the ASX chart on Page 43, and compare where the index was in early January and where it closed this past week. Shocking, eh?!

And the DAX ... and the FTSE ... and the CAC ... and Pollyanna ... and the NDX. You'd have to be pretty pleased, surely, that those targets alone were worth the $20 price tag! And now that you KNOW they work, don't ignore the portents for the rest of the year!

Safe trading - RA

Randall Ashbourne
Astrological Investing's associate, Randall Ashbourne, author of the eBook, The Idiot and The Moon, and The Idiot and the Moon, Forecast 2013, writes a free weekly column titled, The Eye of Ra on his web site in  which he explains the potential impact of astrological aspects and the current state of technical conditions. Ashbourne's charts are revealing illustrations of exactly what has occurred in the market and the probability of what to expect.
Important reading:  Randall Ashbourne's The Idiot and The Moon, Forecast 2013 , Jupiter's cycle and its effects on Wall Street and a posting of the weekly Eye of Ra report in this blog, titled A look at the Venus Retrograde effect
(Disclaimer: This article is not advice or a recommendation to trade stocks; it is merely educational material.)
Copyright: Randall Ashbourne - 2011-2013

The Idiot and the Moon, Forecast 2013
  • Major trend change dates for the full year, plus a month-by-month breakdown of high-energy trading dates and critical reversal dates.

  • An index-by-index analysis of Moon Trading across major American, European, Asian and Australian stock indices-

  • Identifies the major indices where following the phases of the Moon can dramatically cut profits, or even result in large losses.

  • Old Gods & Gold ... a Eureka! discovery about exactly what drives gold prices during rallies and corrections and charts showing highly-reliable target levels to both the upside and downside.

These price charts are individually-tailored to each index and cover Wall Street, Australia, Canada, Hong Kong, Singapore, Shanghai, India, England, Germany and France.

You will not see these charts anywhere else on the Internet!

And much more...