Showing posts with label NASDAQ. Show all posts

Sunday, February 7, 2016

Waiting for the dead cat to bounce

Randall Ashbourne, an associate of Astrological Investing, posts reports and articles on his web site at  theidiotandthemoon.com   The following is this weekend's Eye of RA report: Week beginning February 7, 2016 
It is now virtually certain that all major world stock markets are in the relatively early stages of a big bad Bear.  
We discussed the probability of that in the first two reports for this year, both of which can be accessed by scrolling down.
 
There is still a chance that Central Banks will try desperately to stop the drop, but they appear to have exhausted their ammunition.

The next major rally is, given the extreme levels of technical damage, most likely to be a dead cat bounce which will provide the last chance for many traders to exit Long positions before being wiped out.

That bounce may already be underway, with the mid to late January Lows marking a turning point for a upward-leaning grind that could run into May, perhaps even early June.

Venus conjuncted Pluto and squared Uranus last week, two strongly negative aspects. This week brings a trine to Jupiter. Given both planets are "benefic" and Earth signs are involved, we could see a level of stability return.

I did promise last month to include the current position of some Asian indices; we'll do that this week, as well as taking another look at Wall Street's SP500 and the ASX 200.

 The Nasdaq took a major hit last week, with some of the big name tech stocks rolling over badly. These had been helping to hold aloft the entire American market.

Pollyanna, the SP500, has not yet, I believe, actually confirmed it is now in a Bear market. But that scenario is now leaning heavily towards the probable, rather than the possible.

Below is the 500's long-range planetary price chart. The index is still trying to hold the Pluto level in the early 1870s. It is possible a rebound could take price all the way back to the 2080s. Still, long-term history shows it finds strong levels of both support and resistance at those orange Node lines.

The Weekly Planets chart for the ASX 200 is below, with the index opening and closing last week's trading within a band between grey Neptune now at 5012 and Uranus now at 4974.

There isn't much to stop a further drop if it dives again below the blue Saturns now converging at around 4949. And any rally is likely to find barriers in the 5184 to 5249 range.

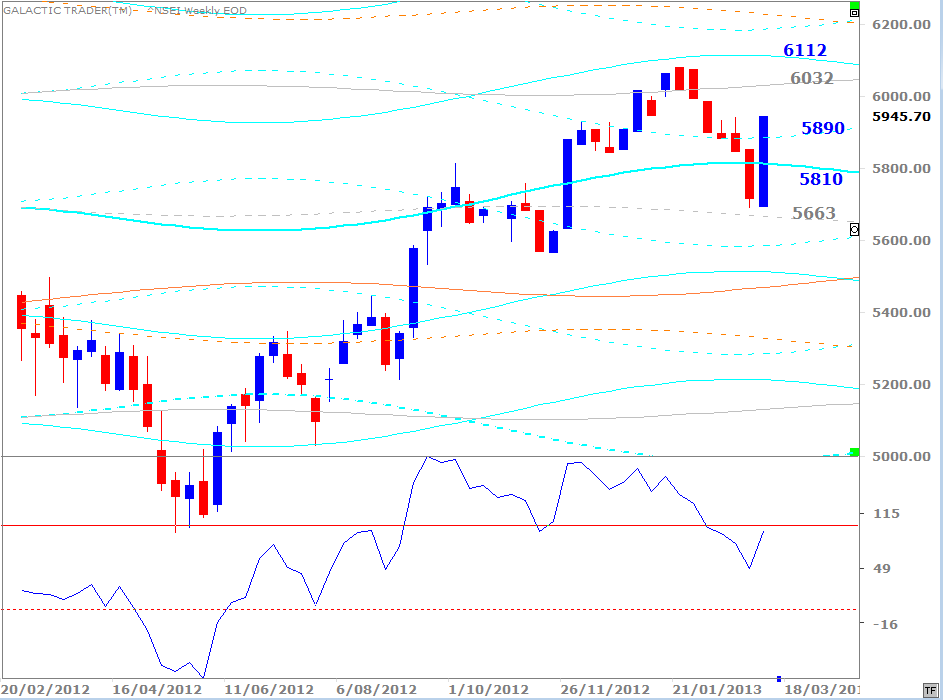
India's Nifty is playing very closely to Pluto price lines. Traders can use these lines as potential targets, keeping a very close eye on daily charts for signs of positive or negative divergence starting to show whenever these targets are approached in actual trading.

Hong Kong has already fallen off its Bullish trend line ... something which has not yet happened decisively on the SP500 or ASX 200 ... and has also completed a backtest of the line. Big Bird, the 50CCI, is gasping in the dust of the mine floor.

There is a little positive divergence in the two faster Birds, giving at least some hope for a bounce "from the obvious" level of Fibonacci support.

It's a difficult call, though, since the index is currently stalled below long-range planetary price support. You'll note that in both charts, the next layer of major support doesn't come into force until around 16,000.

Singapore is holding up a little more strongly than the Hang Seng at this stage, still just hanging onto planetary support.

We can see the alternative levels of Fibonacci support and resistance in the chart below. Fibonacci levels and planetary prices will very often be quite close to each other.

The black lines are linked to the previous Bull High and Bear Low and the red ones run from the Bear Low to last year's High, and even a quick glance will show you both sets provide a reliable guide to the likely length of rallies and declines. Again, if you're actively trading in these dangerous conditions, use these as a big picture guide and watch the daily charts like a hawk for any potential turn as the prices are approached.

If this is a major, new Bear ... and it probably is ... the biggest, nastiest, fastest section of the crash is still ahead of us.

Safe trading - RA

Randall Ashbourne (Disclaimer: This article is not advice or a recommendation to trade stocks; it is merely educational material.)
Copyright: Randall Ashbourne - 2011-2016


The Idiot and the Moon, eBook, available for purchase


Sunday, April 14, 2013

Gold ... and WPs for Western indices

Randall Ashbourne, an associate of Astrological Investing, posts a weekly market report on his web site, theidiotandthemoon.com The following is this weekend's Eye of RA report: Week beginning April 15, 2013

Gold and weekly planets for Western indices


Gold plunged dramatically on Friday, ostensibly because Cyprus needs to unload $525 million of its gold reserves to help pay for the island's bail-out.

The plunge came only a day after Goldman Sachs urged customers to Short gold, with a target of $1450.

In the background is Germany's order to repatriate its French and USA bullion back to home soil.

Reportedly, the US Federal Reserve has told the Germans it will take 7 years to ship the 300 tons.  That's a bit odd, given the number of ships sitting idle. And it makes you wonder whether Pussy Galore could be bothered raiding Fort Knox these days.

Still, we should probably leave the conspiracy theories alone. The Spooky Stuff is quite weird enough ... and we'll be taking a look at some of that in relation to gold in a moment or two.

Meanwhile, the Wall Street stock indices play out the normal April strength while most other major world indices have been correcting for weeks.

In the coming week, the Sun, Venus and Mars all move out of Aries and into Taurus. Venus, ruler of boodle, is the only one of them literally at home in Taurus, which is a far more stable energy than the volatility of Arien fire.

I'll publish updates of planetary charts for a few of the Western indices in this edition, but we'll deal first with gold. Last week was marked in Forecast 2013 as a potential major turning point for gold prices.

And it turned out to be one where major planetary support at 1518 was broken with ease.

click to view larger image


I mentioned last weekend that I am indebted to American astrologer, Pat Hardy, for sharing this chart of gold, timed for the first sale of the modern era when legal restrictions on Americans owning gold were lifted. Pat runs the Energies, Trends, Cycles website at: http://www.pathardytrends.com

She produced this "birth" chart for gold trades after getting access to the hand-written logs from the floor of the Chicago Mercantile Exchange.

You'll probably have to do a bit of scrolling here to understand what I'm talking about, especially if your knowledge of astrology is scant. The inner wheel contains the planets for the first trade and the outer wheel shows the current position of transiting planets.

In the slice of the pie marked with a 2, note that Uranus, the Sun, Mars and Venus were all in Aries last week opposing gold's natal Pluto at 09.13 Libra (the 8th House). Uranus in hard aspect to Pluto - a theme we've been talking about for a long time now, though in a broader context.

In the original birth chart, the Sun and Pluto are squared ... so transiting oppositions to Pluto also square gold's natal Sun at 09.33 Capricorn. And, of course, the transiting Pluto, is conjuncting that Sun. Short version ... it's all a big deal; there's a lot of volatile energy and since Uranus is in the transit mix there will be "surprise" breakouts AND breakdowns and "normal" support/resistance levels will be sliced through like warm butter.

And the volatility is not over yet, because with the Sun, Venus and Mars now moving into Taurus, they'll all oppose gold's natal Uranus at 01.52 Scorpio (9th House).

However, there is also other symbolism at work - and that relates to the position of transiting Jupiter and Saturn. Jupiter is currently finishing a transit of gold's 4th House and will move into the 5th, which is the house with general rulership of gold and, specifically, of financial speculation. It's the gambler's house ... and the FatBoy just lurvs a good roll of the dice and spin of the wheel!

Transiting Saturn is at 09.21 Scorpio in the 9th House, moving towards a conjunction with gold's Midheaven. Now, in the chart of an individual there is a time to put yourself Out There and a time when progress in the outer world is extremely difficult. The difficult time is when Saturn travels through what Grant Lewi used to call "the obscure sector" - the first quadrant of the chart from the Ascendant to the start of the 4th House.

Once it moves past the 4th House, it is a time when we make rapid progress in the world ... and, with most people, Saturn conjuncting the Midheaven means a major career peak. The reality is it's a time when we get the recognition we deserve. For a few, that can mean ... Do not pass go, do not collect $200, Go directly to jail. Saturn's like that. Hey, we're talking about an Old God who ate his own babies!

Anyway, my point here is that both Jupiter and Saturn are past "the obscure sector" and rising in gold's natal chart. While Saturn conjunct the MC gives you the public position you deserve, Jupiter conjuncting the MC suddenly brings an unbelievable rise out-of-the-blue.

So, while the current transits to gold's natal Sun/Pluto square ... and to Uranus ... predict high-levels of volatility and sudden moves, the overall symbolism from the Jupiter/Saturn transit positions means it is very unlikely gold's bull run is finished.

And now that we've reviewed les Spookies, let's look at the technical conditions, starting with the big picture view. Below is a log-scale chart of greenback gold. See the big spike on the left as American investors piled into gold once the legal restrictions were lifted.

click to view larger image

From about the middle of the chart, we see the modern Bull run. The first significant correction lost 22% in 5 months; the second lost 29.5% in 7 months. And for the past 19 months we've been in a sideways shuffle/correction which, at Friday's close, brought down the price by 21.7%. We've had an overbalance of Time, but not of Price - not so far!

The Canary, in this case a medium-range 20CCI, has plunged to a trough level not seen for a very long time - and I've put in a grey line so you can more easily see how this trough compares with previous ones. Taking a cue from the oscillator alone, this plunge is not finished.

So, what about the planetary charts? Well, below is a weekly. The lines currently priced at 1542 and 1518 have been important before, both as Resistance and as Support.

click to view larger image
Goldman Sachs mentioned a Short target of 1450 - and there is a planetary line at that level, albiet not a particularly strong one.

Next chart is the daily ...
click to view larger image

And the interesting thing about the daily is that despite the depth of the price plunge, the Canary has not fallen so deeply as its previous trough.

It means the probability of a bounceback is strong - but may not last long.

Okay ... onto the stock markets. Firstly, the SP500.
click to view larger image

We've had a breakout above the orange Node line at 1572. I had thought it would hold for a larger correction, as most other major indices have endured. But, Pollyanna is still all goo-goo/ga-ga. It's not shown on this chart, but the breakout arrived on Wednesday when overnight trade forced a gap Open above the line.

If it's a false break, Chicken Little will be back real soon. If it's not, then the index may be embarked on a run between Uranus/Pluto planetary barriers. This long-running Santa rally began with a touch of the Uranus/Pluto zone I've marked with a yellow oval at the bottom of the chart.

Along the way, it stalled at and then had a false break of Uranus/Pluto and corrected down into Saturn ... Twice; Both of which I've marked with circled 1s and 2s. So, the target for a third repeat performance would be 1608 to 1610.

click to view larger image

The Nasdaq 100 Weekly Planet chart is above. What we'd thought was a potential Head&Shoulders pattern developing may now have morphed into something else (as they often do!). The fast MACD though, either in its signal line peaks or the height of its histograms, grows increasingly unhappy with the rally.

Over to Germany ...
click to view larger image
And onto the FTSE ...
click to view larger image
And, finally, Auntie ... the ASX 200

click to view larger image

Safe trading - RA

Randall Ashbourne
Astrological Investing's associate, Randall Ashbourne, author of the eBook, The Idiot and The Moon, and The Idiot and the Moon, Forecast 2013, writes a free weekly column titled, The Eye of Ra on his web site in  which he explains the potential impact of astrological aspects and the current state of technical conditions. Ashbourne's charts are revealing illustrations of exactly what has occurred in the market and the probability of what to expect.
Important reading:  Randall Ashbourne's The Idiot and The Moon, Forecast 2013 , Jupiter's cycle and its effects on Wall Street and a posting of the weekly Eye of Ra report in this blog, titled A look at the Venus Retrograde effect
(Disclaimer: This article is not advice or a recommendation to trade stocks; it is merely educational material.)
Copyright: Randall Ashbourne - 2011-2013

The Idiot and the Moon, Forecast 2013
  • Major trend change dates for the full year, plus a month-by-month breakdown of high-energy trading dates and critical reversal dates.

  • An index-by-index analysis of Moon Trading across major American, European, Asian and Australian stock indices-

  • Identifies the major indices where following the phases of the Moon can dramatically cut profits, or even result in large losses.

  • Old Gods & Gold ... a Eureka! discovery about exactly what drives gold prices during rallies and corrections and charts showing highly-reliable target levels to both the upside and downside.

These price charts are individually-tailored to each index and cover Wall Street, Australia, Canada, Hong Kong, Singapore, Shanghai, India, England, Germany and France.

You will not see these charts anywhere else on the Internet!

And much more...

It is NEVER too late in the year to have this monthly information!


Sunday, March 17, 2013

A lesson in gaps, FibRx and FibXt

The Real Spooky Stuff
Randall Ashbourne, an associate of Astrological Investing, posts a weekly market report on his web site, theidiotandthemoon.com The following is this weekend's Eye of RA report: Week beginning March 18, 2013
Hello, boys and girls ... this weekend we're going back to school, putting aside most of The Spooky Stuff to revisit some lessons about the techie stuff.

Oh, don't groan! We all know you peek inside the fortune teller's tent for a weekly planetary fix ... but you're becoming too addicted to the mystical and mysterious.

It's time for a dose of the real world, though we will have a brief look at some of the astrological transits coming up.

Last weekend, I showed you the normal behaviour of the Wall Street markets during Mercury Retrograde phases, which occur for about 3 weeks 3 times a year.

This one did not follow the usual pattern and, instead, most markets rallied throughout the period after a quick dive right at the start.

It is possible that markets will now change direction, along with Mercury. The DJIA has broken above its 2007 peaks and the SP500 is very close to doing so - but the Nasdaq stalled out many weeks ago.

This coming week, the Sun and Venus move out of Pisces into Aries and we enter the 1Q-FM lunar phase. The sign change puts the Sun and Venus into a coming conjunction with Uranus and a square to Pluto - and these two have a more reliable track record of forcing a mood shift than does Mars conjunct Uranus.

Last weekend, I published a chart showing the history of Mars conjuncting Uranus and squaring Pluto and warned you off listening to anyone who started raving on about "the Mars-Uranus crash cycle".

The Sun and Venus each conjunct Uranus once a year ... and the impact is, usually, more reliable as a potential trend turner than Mars.
Click to view larger image

In the chart above, Sun-Uranus conjunctions are the red bars; Venus-Uranus conjunctions are the blue bars ... and there are 7 of them, not counting the one coming this week.

Which is interesting, because 4 of them are right at tops, or very close to, and 2 of them are at, or very close to, bottoms. Have a look; there are 5 or 6 trend changes out of a possible 7 instances. Not a tendency to be ignored lightly.

Now let's have a quick look at Miss Pollyanna's Merc Rx performance ...
Click to view larger image

Ignore, for the moment, the boxed prices. I used this chart last weekend to show the spurt-and-reverse tendency which is normal during the Merc Rx phases. The current phase started out that way ... for just one day. It does create the danger that the Merc Rx rally will be undone as the planet goes Direct again, especially with the money-and-values planet, Venus, moving out of the comfortable territory of Pisces.

If you remember the Greek mythology, Saturn cut Uranus's dangly bits off and threw them into the ocean - causing a bit of froth and bubble until Venus popped forth, where Neptune created a special chariot for her to be drawn safely back to shore. So, Venus and Neppy are good buddies and Venus tends to be at her best while travelling through Pisces.

But, look ... enough of les Spookies for this week. What I want you to look at are the price gaps. Firstly, look at the last 3 bars. There was a gap open on Thursday which jumped above Wednesday's close. On Friday, that gap was filled. There are three other downside gaps which remain. There may even be four. I can't remember exactly when I started keeping a manual chart of the index to overcome the NYSE's lies about the real Open price on any given day.

Now, why is it important to know where the gaps are?

Let's look at the Nasdaq 100 ... which, does NOT tell dirty little lies about its real Open price.
Click to view larger image

Now, when clear gaps open up in a price chart, regardless of whether it's an index or an individual stock, they are ALWAYS filled and often retested, at some point in the future.

I've put a black horizontal to mark a gap which opened to the downside on the NDX when it went into dive mode last September and marked the relevant gap with an X. We can see the stalling action over the past couple of weeks has been filling and retesting that gap.

There is a lower black horizontal and X on the chart ... and we can see how it was closed and tested a few weeks later. Now, these are not, of course, the only gaps on the NDX chart - and many have yet to be filled.

I go through this exercise because it is a valuable lesson in the techie side of things.

We'll turn our attention now to that dead Italian guy ... and the maths lessons he picked up from Arab scholars, who got it from Alexander's Greeks, who undoubtedly picked it up from Indian gurus in those brief periods Alex's boys weren't being trampled by war elephants.
Click to view larger image
Okay, so having looked at where we are with the FibXT levels, let's review the Fibonacci Retracement tool. On the left, we again see the Bear bottom and the top of the first rally leg. There's a lot of stalling at the 236 Rx and the correction finally stops at the 382 level.

So, we would expect - once the entire Bull run is finished - that there will be a minimum FibRx down to the then 236 or 382 level. IF the current rally leg is finished and in need of an intermediate correction, there is a chance the downside is as low as about 1350. To get a more refined handle on the depth of any correction, I'd be more inclined to adopt the safer option of drawing the Fib Rx levels from the bottom in 2011, rather than using the 2009 Bear Low.

So that, boys and girls, concludes the lesson in gaps, Fib Rx and FibXt. It is, I hope you will agree, every bit as interesting and a whole lot more reliable than ... oh, Mercury Rx, for example!

As I keep saying - astrological expectations do NOT over-ride technical conditions. Everyone who wants to trade safely, reliably and profitably needs to give more weight to learning a few tech-head skills than the mystical stuff I often waffle on about!

But ... *ahem* ...

Click to view larger image

Why, yes ... it IS my Weekly Planets chart for the NDX. Last week the Saturn was still at 2812 - again the Nasdaq 100's High for the week. One is not so much a zombie that one can live on tech-head brains alone, y'know!
Click to view larger image
And Auntie, my home index, the ASX200. Negative divergence still building in the oscillator, too.

Okay, that's it for the week! Don't wander off whining that I haven't put up Weekly Planets charts for the rest of the indices. Time for you to do your own damn homework and go play with price gaps, Fibonacci numbers, and Canaries singing sweetly or croaking hoarsely.

You might not get a nice gold star from the teacher. Learn the lesson well, though, and you just might get a few gold bars - real ones ... that you earned for yourself!


Safe trading - RA

Randall Ashbourne
Astrological Investing's associate, Randall Ashbourne, author of the eBook, The Idiot and The Moon, and The Idiot and the Moon, Forecast 2013, writes a free weekly column titled, The Eye of Ra on his web site in  which he explains the potential impact of astrological aspects and the current state of technical conditions. Ashbourne's charts are revealing illustrations of exactly what has occurred in the market and the probability of what to expect.
Important reading:  Randall Ashbourne's The Idiot and The Moon, Forecast 2013 , Jupiter's cycle and its effects on Wall Street and a posting of the weekly Eye of Ra report in this blog, titled A look at the Venus Retrograde effect
(Disclaimer: This article is not advice or a recommendation to trade stocks; it is merely educational material.)
Copyright: Randall Ashbourne - 2011-2013

The Idiot and the Moon, Forecast 2013
  • Major trend change dates for the full year, plus a month-by-month breakdown of high-energy trading dates and critical reversal dates.

  • An index-by-index analysis of Moon Trading across major American, European, Asian and Australian stock indices-

  • Identifies the major indices where following the phases of the Moon can dramatically cut profits, or even result in large losses.

  • Old Gods & Gold ... a Eureka! discovery about exactly what drives gold prices during rallies and corrections and charts showing highly-reliable target levels to both the upside and downside.

These price charts are individually-tailored to each index and cover Wall Street, Australia, Canada, Hong Kong, Singapore, Shanghai, India, England, Germany and France.

You will not see these charts anywhere else on the Internet!

And much more...


Saturday, March 9, 2013

Wall Street, Europe, India - and Mars

Randall Ashbourne, an associate of Astrological Investing, posts a weekly market report on his web site, theidiotandthemoon.com The following is this weekend's Eye of RA report: Week beginning March 11, 2013


Three things for the week ahead - the fishy New Moon, Mars entering Aries, and the final week of the current Mercury Retrograde period.

Those of you who have bought Forecast 2013 may wish to consult the chapter on market performance as Mars travels through Cardinal signs ... and, in particular, what has tended to happen with Mars in its primary home sign.

And it would also be worth consulting the Moon chapter, starting on Page 17, to see exactly how your favorite index performed during the lunar phases for the first few months of last year.

Since I published a variety of Asian markets charts last weekend, I thought I'd swap back to Europe and India in this edition.

Last weekend, I highlighted a couple of exact hits in the Asian indices on my Weekly Planets charts targets. I'll show you a couple of other exact hits in the NDX and ASX during the rallies over the past week.

This week kicks off with the statistical high period of a New Moon and with Mars changing signs into Aries, which launches a new Martian cycle through the zodiac over the next couple of years.

And we will be in the final week of the current 3-week Mercury Retrograde phase.

It's Mercury we'll start with this weekend. As the phase was coming up, I indicated that what tends to be normal is that markets will start a trend at the Rx date which changes course halfway through ... and by the time of the Mercury Direct date a few weeks later, prices are often back within 1% of where they were on the Rx date.

Click for larger image

You can see this tendency at work on the chart above where I've marked the Mercury Rx period late last year with black vertical lines; the Rx date starts a downward plunge ... which does a complete turnaround halfway between the two black lines ... to finish the phase with price back within the range of the bar at play on the Rx date.

Now, as I said, this is the "normal" behaviour of at least the Wall Street markets. It doesn't work every single time ... but we need to be aware of the possibility for markets to reverse course in the coming week; particularly since we enter the statistically negative phase between New Moon and Full Moon.

The other major astro event of the coming week is Mars moving out of Pisces into Aries, which means it will soon conjunct Uranus and square Pluto. We're almost certain to see more armed rebellions making headlines in the next few weeks.

If you happen, though, to come across any strident astrologers screeching about "the Mars-Uranus crash cycle", please consult last year's Archives.
Click for larger image

On the chart above, previous conjunctions between Mars and Uranus are marked with the thick red bars; the squares to Pluto are marked by the heavy blue bars.

Some of them occur sort-of, more-or-less, near highs ... and some of them don't do diddly. Conclusion - there is no reliable prediction that can be made about what will happen just because Mars is making Uranus/Pluto aspects.

Now, onto the Nasdaq 100 ...

Click for larger image

I indicated last weekend that I really had no idea whether Pollyanna and the NDX were going to breakout northwards, or break down. About the SP500, I said: "Overcoming that overhead Uranus/Pluto hurdle opens targets in the range from about 1548 to 1572."

Pollyanna's high for the week was at 1552.48, inside the lower end of the stated range. And I published the NDX Weekly Planets chart, showing the upside targets if it managed to finally breakout above the Uranus line now priced at 2773. The high for the NDX came in at 2812.73 - basically an exact hit on the 2812 target which has been marked on the Weekly Planets chart for the index for ages.

The ASX 200 put in a similar performance.

Click for larger image

The 5132 target has been marked on Auntie's charts for weeks - and she obliged last week, making a small overshoot to 5135.7 before backing off.

Obviously, in both cases, if the rally mode ignores the Merc Rx tendency, the next obvious targets are marked.

Now, since it has been a while since I updated the European charts ...

England:
Click for larger image
The FTSE finally broke through the 6412 level and came to a halt at a weekly Saturn line.

Click for larger image
Germany:
Click for larger image

The DAX cracked the Neptune ceiling - and like London, was stopped by Saturn. I would think, given the consolidation in the index within a Neptune/Uranus zone last year, that it probably wants to reach the overhead Uranians in the range from 8028 to 8169.

France:
Click for larger image

India:
Click for larger image

There is no need to explain these. I've given examples last weekend and this edition of just how precise these targets are. Those of you who have Forecast 2013 should also consult that section which details the exact long-range targets for the key American, European and Asian indices for this year.

Have a look, even if you're not Australian, at the ASX chart on Page 43, and compare where the index was in early January and where it closed this past week. Shocking, eh?!

And the DAX ... and the FTSE ... and the CAC ... and Pollyanna ... and the NDX. You'd have to be pretty pleased, surely, that those targets alone were worth the $20 price tag! And now that you KNOW they work, don't ignore the portents for the rest of the year!

Safe trading - RA

Randall Ashbourne
Astrological Investing's associate, Randall Ashbourne, author of the eBook, The Idiot and The Moon, and The Idiot and the Moon, Forecast 2013, writes a free weekly column titled, The Eye of Ra on his web site in  which he explains the potential impact of astrological aspects and the current state of technical conditions. Ashbourne's charts are revealing illustrations of exactly what has occurred in the market and the probability of what to expect.
Important reading:  Randall Ashbourne's The Idiot and The Moon, Forecast 2013 , Jupiter's cycle and its effects on Wall Street and a posting of the weekly Eye of Ra report in this blog, titled A look at the Venus Retrograde effect
(Disclaimer: This article is not advice or a recommendation to trade stocks; it is merely educational material.)
Copyright: Randall Ashbourne - 2011-2013

The Idiot and the Moon, Forecast 2013
  • Major trend change dates for the full year, plus a month-by-month breakdown of high-energy trading dates and critical reversal dates.

  • An index-by-index analysis of Moon Trading across major American, European, Asian and Australian stock indices-

  • Identifies the major indices where following the phases of the Moon can dramatically cut profits, or even result in large losses.

  • Old Gods & Gold ... a Eureka! discovery about exactly what drives gold prices during rallies and corrections and charts showing highly-reliable target levels to both the upside and downside.

These price charts are individually-tailored to each index and cover Wall Street, Australia, Canada, Hong Kong, Singapore, Shanghai, India, England, Germany and France.

You will not see these charts anywhere else on the Internet!

And much more...


Saturday, February 16, 2013

Bumping against long-term planets

Randall Ashbourne, an associate of Astrological Investing, posts a weekly market report on his web site, theidiotandthemoon.com The following is this weekend's Eye of RA report: Week beginning February 18, 2013
For the past four days Miss Pollyanna, the SP500, has been bumping her head against a multi-decade ceiling.

Sure, the price of the index isn't quite as high as it reached in 2000 and 2007, but that's because the planetary lines which capped those Bull runs have shifted.

This week ... next week probably at the latest ... the vacuous troll has to make up her mind whether she's going to breakout or breakdown.

I indicated last weekend that if a correction does start now, it's probably not The Big One. While reaching the planetary barriers does increase the chances of a significant correction happening, the intermediate oscillators still suggest there will be another run northwards when the correction is done.

The coming week brings on the usually-negative 1Q-FM lunar phase; the Sun will shift signs into Pisces and it will conjunct Neptune; Saturn goes Retrograde; and, next weekend, we get the first Mercury Retrograde phase for the year.

What is "normal" for a Merc Rx phase is that markets tend to start a move which reverses course halfway through the Rx period.

And it's a time we all need to concentrate. It's not unusual to make small mistakes with big impacts during Mercury Rx ... such as hitting the Buy button when you really meant to hit the Sell button.

This weekend's edition will be a short one ... and we'll start with the SP500:
Click for larger view

And here's Polly's problem. The top purple line in the chart above is a long-range Pluto - the one which acted as a brick wall to the two previous Bull runs. Immediately above it is a yellow Uranus line.

Note where this Santa Claus rally started - similar Uranus/Pluto lines around the 1340 area. The first upleg stalled at another Uranus/Pluto configuration, but caught a Saturn rebound.

So, there is a strong chance this has been a run between Uranus/Pluto zones and Miss Polly is about to go into a swoon. You can see why I think this week, or next, the index has to breakout, or breakdown.

Our next chart is an update of the NDX, Nasdaq 100, chart I showed last weekend, indicating the main tech index could be sent south by contact with a falling Sun line.
Click for larger view

Monday's price action set that up, but the pullback stopped at the Uranus line which had been providing Resistance for several weeks.

The NDX ended the week with a close just above Uranus. But the oscillators are heading south and there are downside gaps waiting to be filled. I've inserted white horizontals and price tags on the two main gaps.

While Wall Street is back close to its old Bull peaks, the ASX 200 made its own milestone last week - closing above the 50% recovery barrier for the first time since the bottom of the Bear plunge in 2009.

And there appears to be more room to run ...
I'd thought that primary Saturn line at 4985 would provide stronger Resistance; it'll be interesting to see if it converts to Support during the next correction. More next weekend ...

Safe trading - RA

Randall Ashbourne
Astrological Investing's associate, Randall Ashbourne, author of the eBook, The Idiot and The Moon, and The Idiot and the Moon, Forecast 2013, writes a free weekly column titled, The Eye of Ra on his web site in  which he explains the potential impact of astrological aspects and the current state of technical conditions. Ashbourne's charts are revealing illustrations of exactly what has occurred in the market and the probability of what to expect.
Important reading:  Randall Ashbourne's The Idiot and The Moon, Forecast 2013 , Jupiter's cycle and its effects on Wall Street and a posting of the weekly Eye of Ra report in this blog, titled A look at the Venus Retrograde effect
(Disclaimer: This article is not advice or a recommendation to trade stocks; it is merely educational material.)
Copyright: Randall Ashbourne - 2011-2013

The Idiot and the Moon, Forecast 2013
  • Major trend change dates for the full year, plus a month-by-month breakdown of high-energy trading dates and critical reversal dates.

  • An index-by-index analysis of Moon Trading across major American, European, Asian and Australian stock indices-

  • Identifies the major indices where following the phases of the Moon can dramatically cut profits, or even result in large losses.

  • Old Gods & Gold ... a Eureka! discovery about exactly what drives gold prices during rallies and corrections and charts showing highly-reliable target levels to both the upside and downside.

These price charts are individually-tailored to each index and cover Wall Street, Australia, Canada, Hong Kong, Singapore, Shanghai, India, England, Germany and France.

You will not see these charts anywhere else on the Internet!

And much more...

Sunday, November 25, 2012

A high-energy astro union of aspects

Randall Ashbourne, an associate of Astrological Investing, posts a weekly market report on his web site, theidiotandthemoon.com The following is this weekend's Eye of RA report: Week beginning November 26, 2012

The first couple of days this week are likely to be volatile as Americans get past Thanksgiving and return to their trading desks.

There are three major astrological aspects on Monday and Tuesday, followed by a lunar eclipse Full Moon as Wall Street opens on Wednesday.

And the little winged-heel guy, Mercury, goes Direct again - having delivered the "perfect" sequence of events during his Rx phase.

We discussed early in the month what is the "normal" behaviour for a Merc Rx period ... the Retrograde date starts a trend, which changes course halfway through, and that by the Direct-again date, prices tend to be back within 1% of where they started the whole phase.

Friday's jump back to the 1410-ish level marked on the SP500's long-range planet price chart ticked all the boxes.

But now things get interesting again. First cab off the rank is a Sun trine to Uranus, quickly followed by a Venus conjunction with Saturn and then a Mars conjunction with Pluto.

Then there's a lunar eclipse Full Moon in Gemini ... and just a normal Moon in Gemini usually brings wide-range days in both directions.

That's a lot of astro energy at play within a very short timeframe.

Let me chat a little about the nature of that energy. Most astrologers work on the assumption that a trine aspect is largely benevolent and interpret the symbolism as an "easy flow" of energy.

The trouble is that an easy flow of energy can be a very bad influence. The real nature of the trine aspect is the sudden removal of all obstacles. Now, this is a damn fine thing if you've been out of work for months, having trouble finding a new job. You suddenly get one ... and it'll frequently be a much better job than the one you lost or left.

However, if you happen to be facing fraud charges ... or anxiously avoiding an audit by the tax office ... the trine can suddenly pull the rug out from under you and you fall hard onto your butt in a deep pile of dung.

And then we have the Venus/Saturn conjunction in Scorpio, the sign which relates to debt, death and taxes. Venus in Scorpio is not the kind of girl you bring home to meet Mum. She's an evil, scheming, manipulative bitch who'll hump your brains out ... and then eat them. While you're still alive.

And that's her good side!

Saturn in Scorpio is even worse. On a mundane level, Saturn is "The Government" and since Scorpio relates to debt and taxes, it represents a timeframe when the business of government will relate strongly to those issues. It means time is running out for governments to continue short-term, quick-fix solutions to problems like sovereign debt and the American "fiscal cliff".

And since Mars conjuncts Pluto in the sign of Capricorn, that's a reiteration of the overall theme. Mars and Pluto rule Scorpio, where Saturn currently travels, and they're meeting in Cappy, which is Saturn's home ground. So, we get this sense that the astro pressure is about to be ramped up dramatically when it comes to money (Venus), government (Saturn) and death, debt and taxes (Mars and Pluto).

When we couple those themes with the Sun trine to Uranus and the volatility implied by a Gemini lunar eclipse Full Moon, it is possible things could get real scary, real fast.

However, let me remind you again of the house rule here ... astrological expectations do not over-ride technical conditions. So, let's look at some charts.

click to view larger image


Firstly, I want to check the historical behaviour of Venus conjunct Saturn aspects - marked with red bars on the chart above. By itself, it's not conclusive and reliable as a turning point ... which is basically the same conclusion we reached with the so-called "Mars/Uranus crash cycle" chart we looked at again last weekend.

But, what happens when we look at the four - Venus conjunct Saturn, Sun trine Uranus, and Mars conjunct Pluto and square Uranus?

click to view larger image

In the chart above, Venus/Saturn is red, Sun/Uranus dark blue; Mars/Uranus pink and Mars/Pluto light blue. Three of these were present in the formation of the two previous Bull peaks. Three of them were nearby during the two previous Bear bottoms ... and near the bottom of last year's August/October plunge.

So, the concern here is not one single aspect ... it's the combination of the punch jammed into a narrow timeframe.

Our next chart is Pollyana's performance during the Mercury Rx phase.

click to view larger image

As usual, the official figures from the NYSE won't reflect the silly gap on Friday's half-day, when markets are easily manipulated. The danger is that this is a set-up and not the real start of the annual Santa Claus rally. Yes, I'm still more than mildly concerned by the lack of a positive divergence signal in the oscillators as Miss Pollyanna made her low on the 16th.

The bounceback is even more obvious on the monthly bars in the 500's long-range planetary price chart.
click to view larger image

It's interesting to look at a monthly chart of the FTSE from a technical point of view. While Polly is playing to the planets, the FTSE can't seem to break through the topside of a triangle ... at least not in a sustained way.
click to view larger image

I'll wrap up this weekend's edition with a few Weekly Planets charts and hopefully get back to a wider look at other indices next weekend when it'll be time to look at the likely ranges for December.

Just bear in mind that the Mercury Rx phase did it's "normal" thing virtually perfectly ... but that we have a combination of astro aspects happening over the next few days which have a tendency to be present when markets are marking out important turning points.

NASDAQ 100 Weekly Planets:
click to view larger image

DAX Weekly Planets:


click to view larger image

ASX 200 Weekly Planets:

click to view larger image


Safe trading - RA


Randall Ashbourne
Astrological Investing's associate, Randall Ashbourne, author of the eBook, The Idiot and The Moon, writes a free weekly column titled, The Eye of Ra on his web site in  which he explains the potential impact of astrological aspects and the current state of technical conditions. Ashbourne's charts are revealing illustrations of exactly what has occurred in the market and the probability of what to expect.
Important reading:  Randall Ashbourne's article, Jupiter's cycle and its effects on Wall Street and a posting of the weekly Eye of Ra report in this blog, titled A look at the Venus Retrograde effect
(Disclaimer: This article is not advice or a recommendation to trade stocks; it is merely educational material.)
Copyright: Randall Ashbourne - 2011-2012