Randall Ashbourne, an associate of
Astrological Investing, posts a weekly market report on his web site,
theidiotandthemoon.com The following is this weekend's Eye of RA report: Week beginning July 29, 2013
The alarm
bells are now ringing continuously, and at full volume ... warning that
stock markets are on the verge of another sharp decline.
For the moment, it is unlikely the Bull run has reached its final High. But that peak may be less than 5% away from Friday's closing price on Pollyanna - Wall Street's SP500 index.
Some markets may already have entered another correction mode; it could be delayed another few days for Wall Street.
Even if that is the case, however, Miss Polly is probably less than 2% away from an intermediate peak.
In plain-speak ... there is probably very little upside left for either the completion of this upleg OR the 5-year Bull run which has been underway since 2009.
We will spend most of this edition looking closely at the state of the SP500, as the proxy for the major world indices; and at the ASX200, as a proxy for the resource-heavy markets.
And we are in the middle of an astrological high-energy zone, with 5 major planetary aspects now in play ... Sun square Saturn and Mars opposed Pluto this weekend, Venus trine Pluto and Mars square Uranus occurring mid-week, and Sun trine Uranus next weekend.
A little more about the potential impact of those as we go through some charts
In recent weeks I've been using various charts to illustrate some lessons in positive and negative divergence, from The Technical Section of
The Idiot & The Moon.
And we'll continue that this weekend, starting with Pollyanna's daily chart. While Price has gone higher, our favorite oscillator, the Big Bird, has been singing increasingly out of tune.
It's a warning the 500 may already have reached the top of its bounce from the low of its recent multi-week correction. I'm not convinced that is the case, but I'll deal with the details of that a little later.
What is much worse than daily Big Bird starting to screech, is that weekly Big Bird, in the chart below, is falling off its perch - warning that the next correction is likely to fall through the rising trendline which has underpinned the rise from last year.
However, in the long-range monthly chart below there are still only preliminary, early-warning signs that the Bull is fading, but probably not yet terminally ill.
Note that in the run-up to the 2007 peaks, Big Bird's peaks also rose - right up until the topping "process" which took place from May to October of that year, when the Bird started to diverge significantly. And it is now starting to give similar signals.
So, while the short-term and intermediate-range signals are now starting to screech horribly, and there is now considerably increased danger of another major correction starting, it is still too early to be calling the final top of the Bull with a high degree of certainty.
Those of you holding Long positions in American indices, or in stocks which tend to follow the indices, do need to have an escape plan on standby to protect your profits and your capital.
In part, because the final peak may be less than 5% higher than Friday's close. And the downside, even for a multi-week correction, is higher.
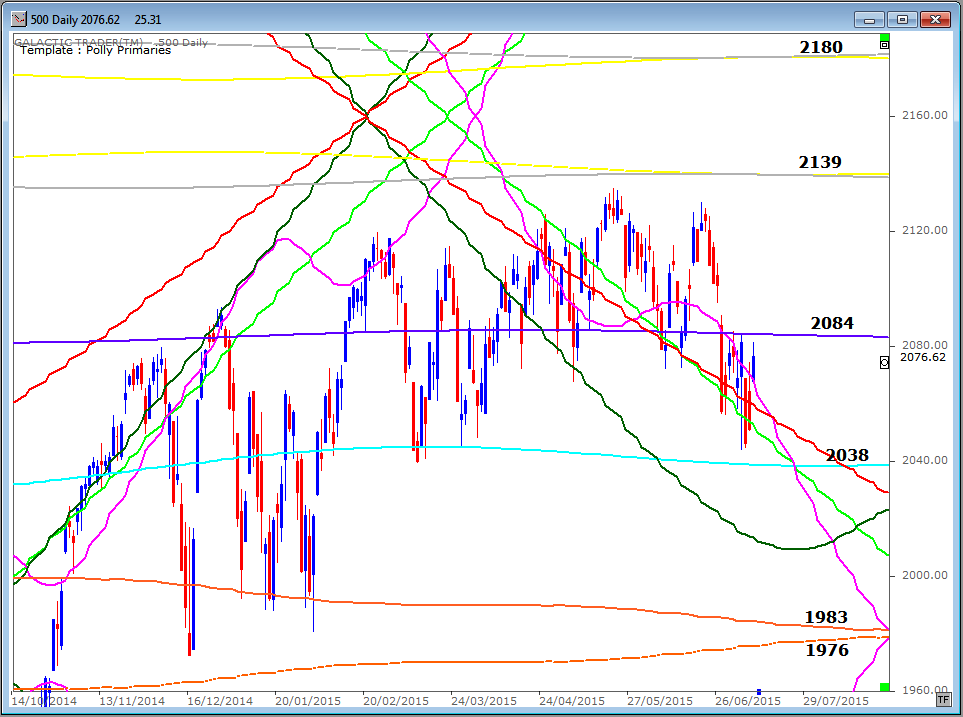
Most of you have been with me now long enough to understand my Weekly Planets and Long Range Planets charts for various indices. Below is a variation on Pollyanna's long-range. These are major planetary Support/Resistance levels for the index and I use daily bars, rather than the normal monthly candles, so that their importance to the price action becomes even more obvious.
It is possible, perhaps even probable, that the 500 still has enough spurt left for another brief upleg before we hit the danger period of the August/September timeframe - traditionally the two weakest months of the year for the American indices.
But, the maximum reach for the final minor wave up in this rising leg is probably only 1.6% away. The peak of the entire post-2009 rally may be only 4.7% away.
There are three obvious target zones for another downside correction -
and we're talking only about an intermediate-length correction, not a
full-on resumption of Bear mode.
Now, I spent a little time
last weekend trying to explain why it is that astrologers sometimes get
in wrong trying to time a market turn in conjunction with major
planetary aspects. And it is simply that to be certain of a turn, the
Price of an index or stock MUST meet exactly with the Time and price
level of the aspect.
The chart below shows all the important
levels for the 5 aspects I mentioned near the start of this edition.
Note that Friday's bar for the 500 dropped down to where the falling,
dashed green line intersects the dashed, light blue line. This is the
exact Time/Price crossing point for the Sun square Saturn aspect
happening this weekend.
While the Time is not exact because the
aspect is happening while the market is closed, we can see there was a
reaction - a strong bounce. There is a planetary resistance cluster
around 1700 - a cluster the index could not get through last week. If it
does, there's a zone relatively free of resistance until 1720ish. And
that one is more than a cluster; it's an important long-range level from
the earlier chart.
Now, while it is possible that Pollyanna and other indices have already entered another correction mode, there are a couple of reasons I'm not utterly convinced ... even though there is no question daily and weekly Big Birds are very, very unhappy with current prices.
And it's simply that the "odds" are against it. For a start, it's the final week of the month and that's normally positive.
In terms of
The Moods of The Moon, we now enter the 3Q-NM phase, which is statistically positive.
To the left is one of the illustrations from
Forecast 2013, detailing exactly how Pollyanna behaved during The Moods of The Moon throughout 2012.
Only four of the 3Q-NM periods last year were negative - and none of them occurred during this part of the year.
So ...
A Friday candle which went down to the exact Sun/Saturn crossing price, but bounced back - apparently rejecting the level.
The traditionally positive period that occurs regularly at the end of a month into the first days of the next month.
We are in the rising lunar phase between Full Moon and New Moon, specifically the 7 days from three-quarter Moon to New Moon, which tends to be positive in the middle of the year - even though that is the weak "season" for stock prices.
For these reasons, I tend to think the bounceback is not quite done.
I could be wrong, of course. It wouldn't be the first time and it won't be the last. Still, I'm inclined to go with what I think the odds are. Even so, I doubt there is very much upside - short-term, or now even long-term.
So, that's where I think we are with the SP500 and how it behaves will affect most Western indices, especially the Europeans.
Now let's take a look at my home index, the ASX200, which might also be a guide to markets like Canada and Brazil. Here, we see a potential problem. While Polly on Friday went down into Sun/Saturn and bounced, Auntie on Friday stuck her head above the level, but closed below it.
Again I caution that this was not a PRECISE meeting of Time and Price because the astrological aspect did not become exact until after Friday. But, it is another klaxon going off loudly. In the chart below, the oscillator is the 20CCI - a medium-range Bird. And it ain't happy!
We also need to be aware that the 5050 price is an important Weekly Planet level for the ASX200 and was one of our primary targets for a bounceback once the recent correction ended. Again, the oscillator used in the chart below is the medium Bird. And it's NOT unhappy.
So we do have some contradiction evident between the two charts. If the index does manage to overcome the 5050 barrier in the next few days, there are no aspect price crossing points in reasonable range; only the important Neptune level in the 5140s. If the index drops, we would need to watch the reaction closely if it goes into the Sun-Uranus price crossing in the 4920s next weekend.
In terms of months ahead, rather than the next few weeks, I would make the same comment I made about Pollyanna. I do not, at this stage, hear major alarm bells starting to become strident. In the chart below the oscillator is Big Bird ... and he is only just starting to display potential divergence.
The last price peak saw Big Bird confirm its validity. It's the next price peak we have to worry about. The Support/Resistance levels on the chart below are purely technical. Yes, they'll be very close to Fibonacci or planetary levels. It's just an example of how we can know important price levels well in advance just by anchoring a few horizontal lines at levels which have been important in the past.
The boxed numbers are the amounts the index lost during the three biggest corrections since the last Bear collapse ended.
And I would repeat the point I made about Pollyanna. Again, one of
The Moods of The Moon tables from
Forecast 2013.
While Miss Polly had four negative 3Q-NM phases last year, the Auntie had only three.
None in this part of the year.
So, while Auntie's behaviour in failing to break above the Sun square Saturn price crossing level on Friday is a cause for some concern, I am not convinced even this small upleg is quite finished.
The statistical odds are against it ... and there is no obvious screeching from the weekly or monthly Birds.
Even so, Auntie is a Neptunian index and if it does break out northwards early this week, the 5148 level is only 2% away.
I think then it's reasonably clear that even if the buoyant phase of the monthly lunar cycle plays out statistically, there is not a huge amount of near-term upside left on the table.
Especially, given the shrillness of the alarm bells now going off in the daily and weekly charts for the SP500.
Next weekend ... some more targets for The Top in a few more of the major stock indices.
Safe trading - RA
Astrological Investing's associate, Randall Ashbourne, author of the eBook, The Idiot and The Moon, and The Idiot and the Moon, Forecast 2013, writes a free weekly column titled, The Eye of Ra
on his web site in which he explains the potential impact of
astrological aspects and the current state of technical conditions.
Ashbourne's charts are revealing illustrations of exactly what has
occurred in the market and the probability of what to expect.
Important reading: Randall Ashbourne's The Idiot and The Moon, Forecast 2013 , Jupiter's cycle and its effects on Wall Street and a posting of the weekly Eye of Ra report in this blog, titled A look at the Venus Retrograde effect
(Disclaimer: This article is not advice or a recommendation to trade stocks; it is merely educational material.)
Copyright: Randall Ashbourne - 2011-2013
 The Idiot and the Moon, Forecast 2013 Sale price 1/2 off!
Major trend change dates for the full
year, plus a month-by-month breakdown of high-energy
trading dates and critical reversal dates.
An index-by-index analysis of Moon Trading
across major American, European, Asian and
Australian stock indices-
Identifies the
major indices where following the phases of
the Moon can dramatically cut profits, or
even result in large losses.
Old Gods & Gold ... a Eureka!
discovery about exactly what drives gold prices
during rallies and corrections and charts
showing highly-reliable target levels to both
the upside and downside.
These price charts are individually-tailored
to each index and cover Wall Street, Australia,
Canada, Hong Kong, Singapore, Shanghai, India,
England, Germany and France.
You
will not see these charts anywhere else on the
Internet!
And much more...
It is NEVER too late in the year to have this monthly information!
Sale Price $10.00





 (Disclaimer: This article is not advice or a recommendation to trade stocks; it is merely educational material.)


