
Showing posts with label planetary pricelines. Show all posts

Sunday, July 12, 2015

High energy impact zone starts now

Randall Ashbourne, an associate of Astrological Investing, posts reports and articles on his web site at  theidiotandthemoon.com   The following is this weekend's Eye of RA report: Week beginning July 13, 2015 
We are now entering one of the astrological high-impact zones of the year.
In Forecast 2015, published in January as a free download, available in the Archives and in the Astrological Investing's shop, I outlined this period from mid-July to early-August with a heavy red border and indicated it was one of three periods likely to be significant for stock prices.

It has already been triggered by the passage of the Sun, but is about to get potentially even nastier.

Mars will oppose Pluto and square Uranus. Mars is symbolic of drive and energy, Pluto rules big power, big money and taxes, and Uranus is representative of "the little guy" demanding a fair go and radical reform.

We've discussed these many times in the past few years because of the long-running square aspect between Uranus and Pluto.

It'll start to get even more intense this week when Venus squares Saturn, an aspect the big guy, Jupiter, will repeat in early August.

And Venus, the ruler of money, material values and diplomatic relations, will soon go retrograde.

Let's not worry ourselves too much about trying to predict the outcome of the astrological transits and, instead, take a look at where we are, primarily with Wall Street's SP500.

In March, I warned that the 500 was about to start running into a series of primary, downtrending planet lines likely to heavily stall the rally.

Incidentally, the same thing will happen to the Australian stock market in the next couple of weeks, but I'll deal with that later in this edition. In the June edition, I indicated traders had to keep a close eye on a primary Pluto level of $2084 for the Pollyanna index (SP500).

It lost the support of that line and is now on its third attempt to retest it from the downside. Strong recovery, especially on a weekly basis, could see Wall Street launch into a rally likely to take it to $2180 or higher. A failure to do so will see prices drop back down under the influence of the falling primary planet lines. 
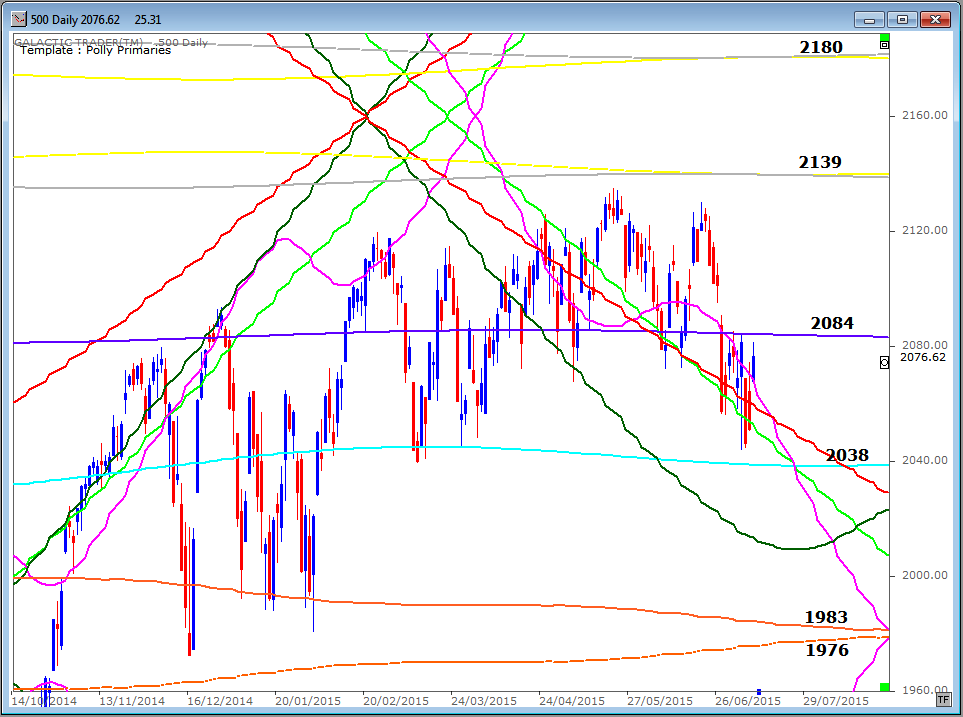
Remember that we are now in the weakest portion of the stock market year and the "sell in May" theory may be taking effect, with a decline all the way to October.

The chart below shows Pollyanna's long-range planetary price lines and a continued decline could see it drop a lot further yet.
Forecast 2015 also listed the major Bradley Model turn dates for the year ... and this is what has been happening, so far. I always warn you it is the dates which are important, not the direction nor the amplitude of the trend change.

April 3 was two days off a low; May 22 was one day off the all-time closing high; June 8 was one day off a low. The next major turn date doesn't arrive until early October, though there are two minor dates in the next couple of weeks during this high-energy astrological zone.
Now, let's take a technical look at how Pollyanna is holding up. Below is the long-range monthly Bi-BB chart, using a fast MACD as the oscillator and showing a trend pitchfork.

For the past few years, the 500's prices have travelled very strongly within the upper tier of the monthly Bi-BBs. This very useful technique is outlined in The Technical Section of The Idiot & The Moon.

As well as that, Polly has been trying valiantly to ride along the top edge of the major, blue tyne of the pitchfork. We are starting to see signs of deterioration in the strength of that advance ... and with negative divergence in both the MACD signal lines and histograms.
The deterioration is also evident in a weekly chart, where the pitchfork's tynes are anchored at the first major correction after the Bear bottomed in 2009. The angle of the uptrend continues to hold, but price is finding it increasingly difficult to sustain ... and the Big Bird oscillator doesn't seem convinced that the current correction has completed.

In short, we all need to be very careful in these few weeks into early August.
That might be particularly true for the Australian market. It is now facing the same problem which has thwarted the Wall Street rallies in recent months ... a heavy set of downtrending inner planet lines almost immediately ahead.

If you take a quick eyeball at the left-hand side of the chart, you get an idea of what contact with these once-a-year downtrend lines can do to the index!
The trouble will come if the index rises into around $5700 by the end of the month. During all the volatility of the past couple of months, the ASX 200 has been routinely playing with blue Saturn price lines on its Weekly Planets chart.

The Big Bird oscillator isn't hopeful, at this stage ... and you can see the resistance around the $5700 level is also emphasised on this chart. In any case, these price targets have been working exceptionally well for weeks now ... for initiating Longs or Shorts!
Safe trading - RA
Randall Ashbourne (Disclaimer: This article is not advice or a recommendation to trade stocks; it is merely educational material.)
Copyright: Randall Ashbourne - 2011-2015


Read Randall Ashbourne's FREE report
THE IDIOT AND THE MOON FORECAST 2015
Astrological Investing's associate, Randall Ashbourne, is the author of the eBook, The Idiot and The Moon,  Ashbourne's Galactic Trader planetary charts are revealing illustrations of exactly what has occurred in the market and the probability of what to expect.

The Idiot and the Moon, eBook, available for purchase

Sunday, May 31, 2015

Headwinds, Mercury Rx, Bradley date

Randall Ashbourne, an associate of Astrological Investing, posts reports and articles on his web site at  theidiotandthemoon.com   The following is this weekend's Eye of RA report: Week beginning June 1, 2015 

There has been little worth talking about since the last edition in April.

I indicated then that the SP500 faced strong headwinds as it ran into primary planet downtrend lines and that even if it overcame those, there was a stack of resistance to overcome in "the next 20 to 30 points"

At that time, the Pollyanna index was at $2102. It ended last week at $2107 ... after putting in some sort of top at $2134. 

June kicks off with Mercury halfway through a Retrograde phase and it's not unusual for a trend change to develop at that halfway mark.

We also have another of the year's major Bradley Model turn dates approaching, around June 8. The details of the Bradley dates were provided in Forecast 2015, which you can read, or re-read, in the Archives.

In this edition, we'll take a look at exactly how Pollyanna has been coping with the long-range planetary price lines.

And, also, how the greenback gold price is holding up.

In the April edition, I showed how the 500 had started to bump into primary downtrend lines. The track record of contact with these lines was dealt with in the March 30 edition.

We expected that price would get caught up in that downtrending planetary jumble. And it did ...
In the past couple of weeks, the index has tried to break northwards from the downward pressure, but has been unable to reach as high as strong, horizontal resistance provided by Uranus and Neptune price lines around 2140.

The Pluto line at 2084 has provided support in the past during this churning, sideways grind and should be watched closely in the days ahead.

The grind has been going on for months and it's likely that this month will see the issue resolved with either a breakout or a breakdown.

Many commentators are leaning heavily towards a breakdown. The only problem with that is when people are expecting a breakdown, the market usually bursts northwards.

In The Technical Section of The Idiot & The Moon, I showed you how to create a simple, hand-drawn trendline and use that as the basis for creating channels which can be used to forecast future price moves.

The basis is that indices and individual stocks have a strong tendency to repeat a particular angle over-and-over again and that by taking parallels of the original line you can create a reliable roadmap.

As we can see, it has been quite useful in determining the angle which is repeatedly in play for this long Bull run.


The 500 closed out last week falling off one instance of that rising angle ... and with the green Fast Bird dropping deeply, warning of the potential for more downside to come in the short-term.

Obviously, further price gains in the index are getting more and more difficult. Negative divergence continues to build in many monthly oscillators and the danger of a large correction continues to grow.

The ASX 200 has been stalled for the past 3 months at a double Fibonacci barrier and its recent price highs have arrived with negative divergence in the Big Bird oscillator. The oscillator has not yet declined below the +100 upper red line in the indicator panel and the May monthly price bar has ended in mid-range, indicating a high level of indecision between both buyers and sellers.

Now let's take a look at the price of gold measured in US dollars, starting with the daily Sun/Pluto chart.

The minor Pluto price line at $1185 continues to provide reasonably strong support, which is even more obvious when viewed on a weekly chart ...
We can see this line first came into play in June 2013. What is interesting is that each subsequent visit to this line, and the stronger, lower one around $1155, has been met with higher troughs in the Big Bird oscillator. That's positive divergence, a sign that internal strength continues to build, despite the constant shenanigans with the price, especially on the futures market.

And that positive divergence is even more obvious on a monthly Bi-BB chart, using a fast MACD as the oscillator. Pressure for a major gold price rally has been building. It's certainly worth keeping a close eye on individual gold mining stocks, especially those with a relatively low cost-of-production. 
Well, I think that's enough for this edition. As I said in The Idiot & The Moon, the smartest thing you can do in trading is shut-up and shut out the constant barrage of noise. This sideways churning is probably driving a lot of people totally nuts ... and that's not a good state of mind for making rational decisions.

Still, it has been going on now for so long that a big move, one way or the other, is becoming imminent.
Safe trading - RA
Randall Ashbourne (Disclaimer: This article is not advice or a recommendation to trade stocks; it is merely educational material.)
Copyright: Randall Ashbourne - 2011-2015


Read Randall Ashbourne's FREE report
THE IDIOT AND THE MOON FORECAST 2015
Astrological Investing's associate, Randall Ashbourne, is the author of the eBook, The Idiot and The Moon,  Ashbourne's Galactic Trader planetary charts are revealing illustrations of exactly what has occurred in the market and the probability of what to expect.
The Idiot and the Moon, Compleat & Utter Lunatic Idiot's G