


Randall Ashbourne, an associate of Astrological Investing, posts reports and articles on his web site at theidiotandthemoon.com The following is this weekend's Eye of RA report: Week beginning January 3, 2016

2015 has ended with very few worldwide stock indices holding onto the gains they made early in the year.v
Many commentators, even the optimistic ones, expect more trouble and few gains to be made in the coming 12 months.
From a contrarian point of view, there are ... perhaps ... too many people calling an end to the Bull run and a return of the Bear; the market rarely does what the majority expect and forecast.
Still, even the best Elliott Wave analysts now believe the end of this very long-running Bull market (at least for the American indices) is only a rally or two away from starting.
It is distinctly possible that some stock markets are already in its grip. Over the next week, I will try to bring you up to date on all the major markets ... starting today with Wall Street's SP500 and Australia's ASX200.
My apologies for my prolonged absence during the past few months. I am still ill and no longer have the energy to write regular columns.
Bear markets tend to be defined in line with the percentage crash from their Highs. The Australian stock market has been one of the world's real laggards in terms of its Bull run since the last Bear terminated in 2009.
The ASX200 made a double top at $5996 last March and April. In the next 4 months, it crashed a tad more than 17.5% from the High and has made four "tests" of that crash level, with December finally making a bounce from the obvious ... contact with a rising trendline.

The Idiot remains on a monthly Sell signal. Big Bird, the 50 CCI oscillator marked with a blue line in the lower panel, has plunged below the +100 level. There remains some hope for a rally in the first part of 2016; we have a bounce from the long-range trendline, Big Bird appears to have made a Zero Line Rejection (ie: it has bounced higher from the red, dotted zero line which tends to indicate a reliable bounce) and Fast Bird, the green line, has spiked above Medium Bird (the red).
Now let's take a look at the Pollyanna index, the SP500, using the alternative Bi-BB method recommended in The Idiot & The Moon. The August mini-crash took the index down 12.5% from its High. The fast MACD remains in clear Sell mode.

Nor is Pollyanna's Big Bird singing a happy song. In the chart below, take special note of what happened to this index when that blue oscillator line plunged below the red +100 line after the two previous Bull peaks. The alarm bells are screaming. Very loudly.

Thankfully, we have some tools which can be used to help us trade these volatile markets. The ASX200, for example, has been making regular stops and reversals at two sets of Fibonacci Retracement levels ... the blue ones from the 2007 peak to 2009 low, the red ones from the strong Bull market leading into that 2007 High.
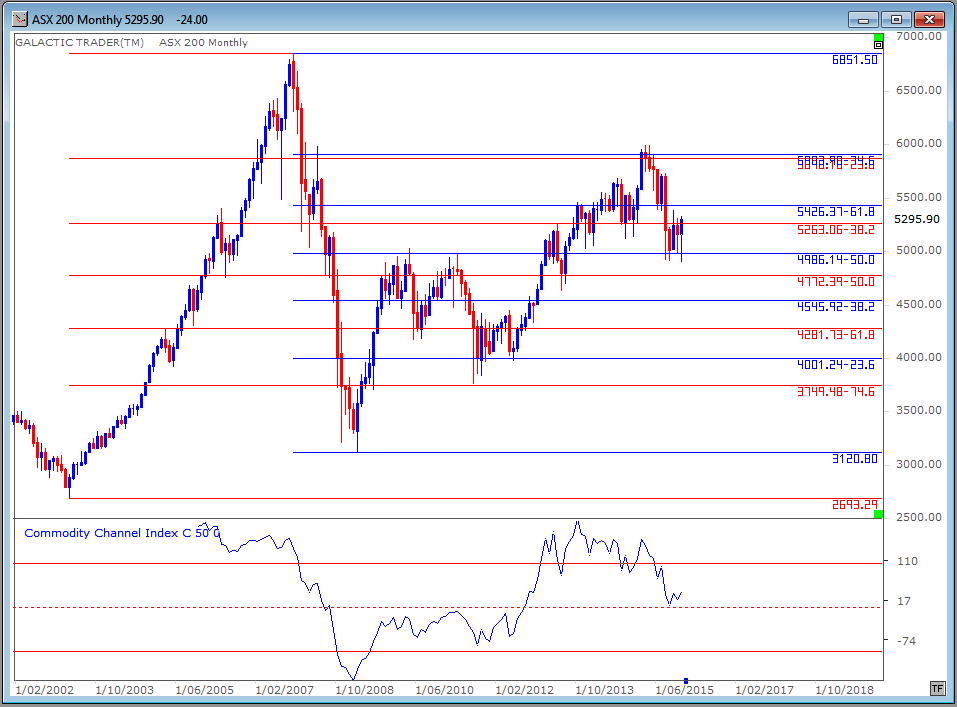
These are long-range markers and should be used to inform any short or medium term trades you may be considering. In other words, if your daily and weekly charts are starting to show oscillator or momentum weakness as the price rises into any of these Fibonacci Rx targets you need to be very careful about staying Long ... and also need to move your Loss Stops much closer to the current price action at the time.
And we also have my long-range planetary price charts which can be used effectively for price targets ... up or down. The ASX 200 is quite simple. You know from past columns and the book that it is an index with a very strong relationship to Neptune.
Those price lines are marked with both grey and orange lines on the chart below and while there are often overshoots, the reliability of using Neptune prices as targets for moves in both directions, I think is too profitable, and too regular, to be ignored. Again, use these long-range targets to inform your decisions when daily and weekly charts are showing positive or negative divergence and the strong chance of a looming trend change.

And the same is true of the SP500.

In Forecast 2015, I published a basic Elliott Wave diagram, where a Bull run is made up of 5 large waves, with (1), (3) and (5) being the major rally phases and (2) and (4) being the downtrend waves. I marked last year with a red arrow, indicating we were nearing the end of 5 intermediate waves within a long-range 3 rally and that would normally be followed by a major wave 4 correction.
That appears to have happened fairly accurately. If it remains so, we start 2016 at about where I have placed the black arrow. In short, the good times are running out of room and time.
Do NOT go to sleep at the wheel any time during 2016.

Safe trading - RA
 (Disclaimer: This article is not advice or a recommendation to trade stocks; it is merely educational material.)
Copyright: Randall Ashbourne - 2011-2016


 )
)
