Showing posts with label ASX200. Show all posts

Saturday, March 12, 2016

Dead cat bounce nears its likely peak

Randall Ashbourne, an associate of Astrological Investing, posts reports and articles on his web site at  theidiotandthemoon.com   The following is this weekend's Eye of RA report: Week beginning March 13, 2016 
In the last Eye of Ra, on February 7, I predicted a dead cat bounce in major stock markets was imminent.

Five weekends later, we need to go into ultra-cautious mode yet again because that bounce is probably very close to hitting its peak ... in Price, though maybe not in Time.

In the last edition, I indicated the bounce may already be underway, with the mid to late January lows marking a turning point.

That was the case in some markets, with others hanging on another few days, until February 10, to hit a final low before the bounce took off.

I also indicated it was probable that Central Banks would try desperately to stop the drop ... and we also saw that happen with the European Central Bank taking unbelievable risks with a decision to prop up corporate bonds.

This edition will be relatively short. I'll give you the all-important planetary price targets for the SP500, but use the ASX 200 as an example of why the bounce may be running out of Price, but not of Time

As usual, Wall Street has been leading the pack higher. The Pollyanna index, the SP500, ended last week only about 5% off its 2015 peak.

There is still a slim chance that we have not entered into Bear territory and that Wall Street could make new all-time Highs in the next few months. But, it is very slim.

More likely is that Pollyanna will start to roll over again, possibly around Wednesday after Jupiter trines Pluto.


The most obvious price target is $2049, a Saturn price line on the index's long-range planetary price chart. I think there is enough positive momentum in the daily, weekly and monthly charts to get Pollyanna to those levels.

In fact, it's the positive momentum, especially in weekly and monthly charts of various indices, that suggests markets are not going to hit a certain price point and then collapse and go into crash mode.

Most Bears seem to be trying to call a "top-and-crash" at every single overhead resistance level and then stand there wondering what went wrong when prices just power through that supposed resistance.

Simply, they're reading the wrong charts. Or reading the right ones wrongly.

Below is the Weekly Planets chart for the ASX 200.

It shows the 200 is about to run into heavy resistance. But the need to be wary of being overly Bearish ... here and now ... is the slow build-up of positive divergence in the Big Bird oscillator. It's distinctly possible it will need some Time to be sufficiently debased to warn of another imminent Bear leg down.

The next chart shows price is still reaching for a Fibonacci 38.2% retracement of the first downleg. It's worrying that it hasn't climbed back as far as Pollyanna, but you can see how the Fast Bird (green) and Medium Bird (red) lines mirror the Big Bird's efforts to make higher peaks at lower prices.


And if that's not sufficient to warn the Bears to be just a little cautious in growling so adamantly, take note of the higher troughs in both Fast and Medium Birds on the monthly chart below. Monthly divergence. That's not something easily wiped away ... and is why I said in the introduction to this edition, we may well be nearing the peak of the bounce in terms of Price, but not of Time.


Markets have an annoying habit of trying to fool the majority of investors.

So, that's it for this edition. We did get the strong dead cat bounce I spoke about last time. There is a slim chance it will morph into a totally-surprising final upleg of the Bull market.

I urge you to do what I always suggest:

Use the monthly and weekly charts for the long and medium range targets ... up or down. And WHEN price gets near to those targets, THEN turn your attention to daily and intraday charts for signs from the momentum of the oscillators that a trend change is starting to get really close.

Safe trading - RA

Randall Ashbourne (Disclaimer: This article is not advice or a recommendation to trade stocks; it is merely educational material.)
Copyright: Randall Ashbourne - 2011-2016


The Idiot and the Moon, eBook, available for purchase

Saturday, January 2, 2016

2016 ... beware of the Bear


Randall Ashbourne, an associate of Astrological Investing, posts reports and articles on his web site at  theidiotandthemoon.com   The following is this weekend's Eye of RA report: Week beginning January 3, 2016
Best wishes to everyone for a happy and prosperous 2016, though if you're counting on stocks to provide either happiness or prosperity, you'll need to be very nimble.
2015 has ended with very few worldwide stock indices holding onto the gains they made early in the year.v

Many commentators, even the optimistic ones, expect more trouble and few gains to be made in the coming 12 months.

From a contrarian point of view, there are ... perhaps ... too many people calling an end to the Bull run and a return of the Bear; the market rarely does what the majority expect and forecast.

Still, even the best Elliott Wave analysts now believe the end of this very long-running Bull market (at least for the American indices) is only a rally or two away from starting.

It is distinctly possible that some stock markets are already in its grip. Over the next week, I will try to bring you up to date on all the major markets ... starting today with Wall Street's SP500 and Australia's ASX200.

My apologies for my prolonged absence during the past few months. I am still ill and no longer have the energy to write regular columns.

Bear markets tend to be defined in line with the percentage crash from their Highs. The Australian stock market has been one of the world's real laggards in terms of its Bull run since the last Bear terminated in 2009.

The ASX200 made a double top at $5996 last March and April. In the next 4 months, it crashed a tad more than 17.5% from the High and has made four "tests" of that crash level, with December finally making a bounce from the obvious ... contact with a rising trendline.


The Idiot remains on a monthly Sell signal. Big Bird, the 50 CCI oscillator marked with a blue line in the lower panel, has plunged below the +100 level. There remains some hope for a rally in the first part of 2016; we have a bounce from the long-range trendline, Big Bird appears to have made a Zero Line Rejection (ie: it has bounced higher from the red, dotted zero line which tends to indicate a reliable bounce) and Fast Bird, the green line, has spiked above Medium Bird (the red).

Now let's take a look at the Pollyanna index, the SP500, using the alternative Bi-BB method recommended in The Idiot & The Moon. The August mini-crash took the index down 12.5% from its High. The fast MACD remains in clear Sell mode.

Nor is Pollyanna's Big Bird singing a happy song. In the chart below, take special note of what happened to this index when that blue oscillator line plunged below the red +100 line after the two previous Bull peaks. The alarm bells are screaming. Very loudly.

Thankfully, we have some tools which can be used to help us trade these volatile markets. The ASX200, for example, has been making regular stops and reversals at two sets of Fibonacci Retracement levels ... the blue ones from the 2007 peak to 2009 low, the red ones from the strong Bull market leading into that 2007 High.


These are long-range markers and should be used to inform any short or medium term trades you may be considering. In other words, if your daily and weekly charts are starting to show oscillator or momentum weakness as the price rises into any of these Fibonacci Rx targets you need to be very careful about staying Long ... and also need to move your Loss Stops much closer to the current price action at the time.

And we also have my long-range planetary price charts which can be used effectively for price targets ... up or down. The ASX 200 is quite simple. You know from past columns and the book that it is an index with a very strong relationship to Neptune.

Those price lines are marked with both grey and orange lines on the chart below and while there are often overshoots, the reliability of using Neptune prices as targets for moves in both directions, I think is too profitable, and too regular, to be ignored. Again, use these long-range targets to inform your decisions when daily and weekly charts are showing positive or negative divergence and the strong chance of a looming trend change.


And the same is true of the SP500.


In Forecast 2015, I published a basic Elliott Wave diagram, where a Bull run is made up of 5 large waves, with (1), (3) and (5) being the major rally phases and (2) and (4) being the downtrend waves. I marked last year with a red arrow, indicating we were nearing the end of 5 intermediate waves within a long-range 3 rally and that would normally be followed by a major wave 4 correction.

That appears to have happened fairly accurately. If it remains so, we start 2016 at about where I have placed the black arrow. In short, the good times are running out of room and time.

Do NOT go to sleep at the wheel any time during 2016.


Safe trading - RA
Randall Ashbourne (Disclaimer: This article is not advice or a recommendation to trade stocks; it is merely educational material.)
Copyright: Randall Ashbourne - 2011-2016


The Idiot and the Moon, eBook, available for purchase

Sunday, April 14, 2013

Gold ... and WPs for Western indices

Randall Ashbourne, an associate of Astrological Investing, posts a weekly market report on his web site, theidiotandthemoon.com The following is this weekend's Eye of RA report: Week beginning April 15, 2013

Gold and weekly planets for Western indices


Gold plunged dramatically on Friday, ostensibly because Cyprus needs to unload $525 million of its gold reserves to help pay for the island's bail-out.

The plunge came only a day after Goldman Sachs urged customers to Short gold, with a target of $1450.

In the background is Germany's order to repatriate its French and USA bullion back to home soil.

Reportedly, the US Federal Reserve has told the Germans it will take 7 years to ship the 300 tons.  That's a bit odd, given the number of ships sitting idle. And it makes you wonder whether Pussy Galore could be bothered raiding Fort Knox these days.

Still, we should probably leave the conspiracy theories alone. The Spooky Stuff is quite weird enough ... and we'll be taking a look at some of that in relation to gold in a moment or two.

Meanwhile, the Wall Street stock indices play out the normal April strength while most other major world indices have been correcting for weeks.

In the coming week, the Sun, Venus and Mars all move out of Aries and into Taurus. Venus, ruler of boodle, is the only one of them literally at home in Taurus, which is a far more stable energy than the volatility of Arien fire.

I'll publish updates of planetary charts for a few of the Western indices in this edition, but we'll deal first with gold. Last week was marked in Forecast 2013 as a potential major turning point for gold prices.

And it turned out to be one where major planetary support at 1518 was broken with ease.

click to view larger image


I mentioned last weekend that I am indebted to American astrologer, Pat Hardy, for sharing this chart of gold, timed for the first sale of the modern era when legal restrictions on Americans owning gold were lifted. Pat runs the Energies, Trends, Cycles website at: http://www.pathardytrends.com

She produced this "birth" chart for gold trades after getting access to the hand-written logs from the floor of the Chicago Mercantile Exchange.

You'll probably have to do a bit of scrolling here to understand what I'm talking about, especially if your knowledge of astrology is scant. The inner wheel contains the planets for the first trade and the outer wheel shows the current position of transiting planets.

In the slice of the pie marked with a 2, note that Uranus, the Sun, Mars and Venus were all in Aries last week opposing gold's natal Pluto at 09.13 Libra (the 8th House). Uranus in hard aspect to Pluto - a theme we've been talking about for a long time now, though in a broader context.

In the original birth chart, the Sun and Pluto are squared ... so transiting oppositions to Pluto also square gold's natal Sun at 09.33 Capricorn. And, of course, the transiting Pluto, is conjuncting that Sun. Short version ... it's all a big deal; there's a lot of volatile energy and since Uranus is in the transit mix there will be "surprise" breakouts AND breakdowns and "normal" support/resistance levels will be sliced through like warm butter.

And the volatility is not over yet, because with the Sun, Venus and Mars now moving into Taurus, they'll all oppose gold's natal Uranus at 01.52 Scorpio (9th House).

However, there is also other symbolism at work - and that relates to the position of transiting Jupiter and Saturn. Jupiter is currently finishing a transit of gold's 4th House and will move into the 5th, which is the house with general rulership of gold and, specifically, of financial speculation. It's the gambler's house ... and the FatBoy just lurvs a good roll of the dice and spin of the wheel!

Transiting Saturn is at 09.21 Scorpio in the 9th House, moving towards a conjunction with gold's Midheaven. Now, in the chart of an individual there is a time to put yourself Out There and a time when progress in the outer world is extremely difficult. The difficult time is when Saturn travels through what Grant Lewi used to call "the obscure sector" - the first quadrant of the chart from the Ascendant to the start of the 4th House.

Once it moves past the 4th House, it is a time when we make rapid progress in the world ... and, with most people, Saturn conjuncting the Midheaven means a major career peak. The reality is it's a time when we get the recognition we deserve. For a few, that can mean ... Do not pass go, do not collect $200, Go directly to jail. Saturn's like that. Hey, we're talking about an Old God who ate his own babies!

Anyway, my point here is that both Jupiter and Saturn are past "the obscure sector" and rising in gold's natal chart. While Saturn conjunct the MC gives you the public position you deserve, Jupiter conjuncting the MC suddenly brings an unbelievable rise out-of-the-blue.

So, while the current transits to gold's natal Sun/Pluto square ... and to Uranus ... predict high-levels of volatility and sudden moves, the overall symbolism from the Jupiter/Saturn transit positions means it is very unlikely gold's bull run is finished.

And now that we've reviewed les Spookies, let's look at the technical conditions, starting with the big picture view. Below is a log-scale chart of greenback gold. See the big spike on the left as American investors piled into gold once the legal restrictions were lifted.

click to view larger image

From about the middle of the chart, we see the modern Bull run. The first significant correction lost 22% in 5 months; the second lost 29.5% in 7 months. And for the past 19 months we've been in a sideways shuffle/correction which, at Friday's close, brought down the price by 21.7%. We've had an overbalance of Time, but not of Price - not so far!

The Canary, in this case a medium-range 20CCI, has plunged to a trough level not seen for a very long time - and I've put in a grey line so you can more easily see how this trough compares with previous ones. Taking a cue from the oscillator alone, this plunge is not finished.

So, what about the planetary charts? Well, below is a weekly. The lines currently priced at 1542 and 1518 have been important before, both as Resistance and as Support.

click to view larger image
Goldman Sachs mentioned a Short target of 1450 - and there is a planetary line at that level, albiet not a particularly strong one.

Next chart is the daily ...
click to view larger image

And the interesting thing about the daily is that despite the depth of the price plunge, the Canary has not fallen so deeply as its previous trough.

It means the probability of a bounceback is strong - but may not last long.

Okay ... onto the stock markets. Firstly, the SP500.
click to view larger image

We've had a breakout above the orange Node line at 1572. I had thought it would hold for a larger correction, as most other major indices have endured. But, Pollyanna is still all goo-goo/ga-ga. It's not shown on this chart, but the breakout arrived on Wednesday when overnight trade forced a gap Open above the line.

If it's a false break, Chicken Little will be back real soon. If it's not, then the index may be embarked on a run between Uranus/Pluto planetary barriers. This long-running Santa rally began with a touch of the Uranus/Pluto zone I've marked with a yellow oval at the bottom of the chart.

Along the way, it stalled at and then had a false break of Uranus/Pluto and corrected down into Saturn ... Twice; Both of which I've marked with circled 1s and 2s. So, the target for a third repeat performance would be 1608 to 1610.

click to view larger image

The Nasdaq 100 Weekly Planet chart is above. What we'd thought was a potential Head&Shoulders pattern developing may now have morphed into something else (as they often do!). The fast MACD though, either in its signal line peaks or the height of its histograms, grows increasingly unhappy with the rally.

Over to Germany ...
click to view larger image
And onto the FTSE ...
click to view larger image
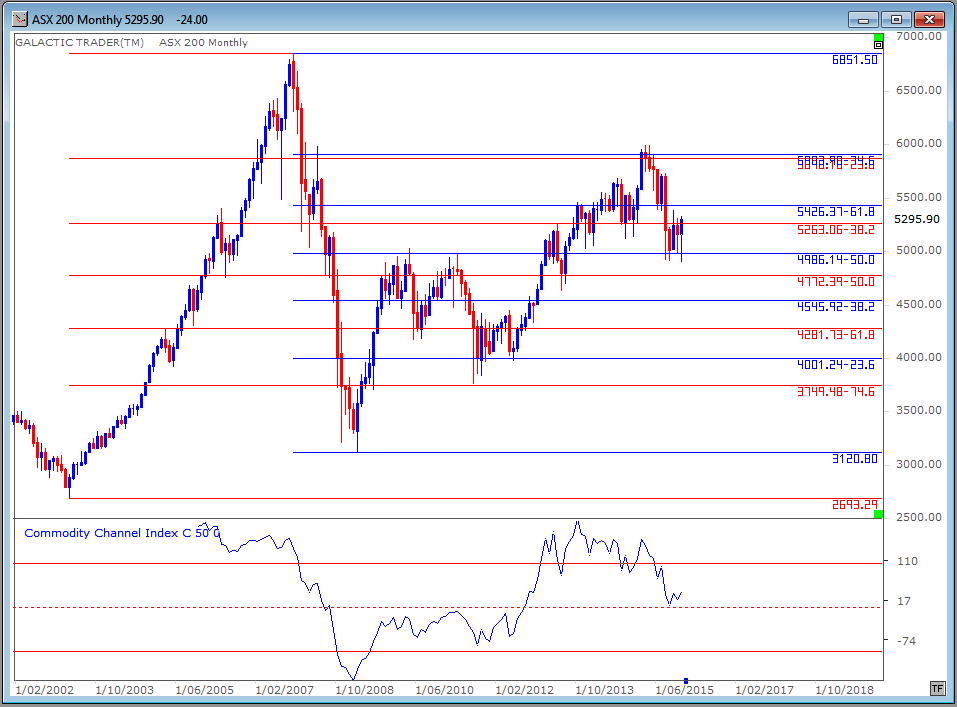
And, finally, Auntie ... the ASX 200

click to view larger image

Safe trading - RA

Randall Ashbourne
Astrological Investing's associate, Randall Ashbourne, author of the eBook, The Idiot and The Moon, and The Idiot and the Moon, Forecast 2013, writes a free weekly column titled, The Eye of Ra on his web site in  which he explains the potential impact of astrological aspects and the current state of technical conditions. Ashbourne's charts are revealing illustrations of exactly what has occurred in the market and the probability of what to expect.
Important reading:  Randall Ashbourne's The Idiot and The Moon, Forecast 2013 , Jupiter's cycle and its effects on Wall Street and a posting of the weekly Eye of Ra report in this blog, titled A look at the Venus Retrograde effect
(Disclaimer: This article is not advice or a recommendation to trade stocks; it is merely educational material.)
Copyright: Randall Ashbourne - 2011-2013

The Idiot and the Moon, Forecast 2013
  • Major trend change dates for the full year, plus a month-by-month breakdown of high-energy trading dates and critical reversal dates.

  • An index-by-index analysis of Moon Trading across major American, European, Asian and Australian stock indices-

  • Identifies the major indices where following the phases of the Moon can dramatically cut profits, or even result in large losses.

  • Old Gods & Gold ... a Eureka! discovery about exactly what drives gold prices during rallies and corrections and charts showing highly-reliable target levels to both the upside and downside.

These price charts are individually-tailored to each index and cover Wall Street, Australia, Canada, Hong Kong, Singapore, Shanghai, India, England, Germany and France.

You will not see these charts anywhere else on the Internet!

And much more...

It is NEVER too late in the year to have this monthly information!


Saturday, April 6, 2013

Old Gods ... and gold

Randall Ashbourne, an associate of Astrological Investing, posts a weekly market report on his web site, theidiotandthemoon.com The following is this weekend's Eye of RA report: Week beginning April 8, 2013
Mars, gold, and gods A few weeks ago I urged those of you who had bought Forecast 2013 to check the state of your favorite stock index against the target prices contained in the section starting on Page 41.

If you did - and took notice of the material in the earlier chapter, Mars ... the mover of markets, which outlines a general tendency for markets to rise strongly with Mars travelling between Capricorn and Aries - you probably locked in some significant profits.

American readers would have known in advance that the 1572 level on the SP500 marked a price tag that had the potential to turn the index down. Which it started to do last week after hitting $1573.66.

Australian traders would have known that 5126 was a very key price target likely to produce a correction. The ASX200 peaked at 5163 almost four weeks ago.

DAX traders were forewarned of an upside target level priced at 7993 at the start of the year when Forecast 2013 was available. The index overshot to 8074 a month ago.

FTSE traders knew the levels of 6387 and 6550 were likely to be major turning points. The high for the year so far was 6534, recorded early last month.

Forecast 2013 contains a special section on what moves the price of gold - and that's what we'll be taking a closer look at this weekend.

Before we do that, however, I'll paste a small excerpt from Forecast 2013 relating to my home market, the ASX 200. To begin, I'll republish the chart used in the Forecast.
click to view larger image
And this is the relevant part of the text associated with the original chart:

"The ASX200 is a Neptune index. While its intermediate trends find Support or Resistance at other significant planetary lines, it is Neptune which provides the most striking barriers, upside and downside, during the long-range moves.

The dashed line which provided massive Resistance, broken only temporarily, at the 2010 and 2011 peaks is priced around 4770 for 2013.

Breakout above that level opens the next target area in the 5100s. The earlier IC chart showed positive divergence present in the 50CCI and it is obvious on the Neptune chart, using the 20CCI (intermediate-range).

Again, taking the state of the oscillator in isolation from all other factors, the ASX has clearly embarked on a bid to retest its former highs and there is a strong indication that while it might stall at 4770, there would be no alarm bells going off unless it hit the 5100s with clear negative divergence in the oscillator."

 And this is that chart now: - 

click to view larger image


I go through this exercise for a number of reasons. One is ... you MUST use a reliable oscillator and become as comfortable with it as an old glove. Not a whole stack of oscillators! That just leads to confusion and indecision. In December/January, I was able to use this long-range Old Gods chart for Auntie, in combination with an oscillator, to predict the index would go to the 5100s and we would then need to check the performance of the oscillator for signs of negative divergence.

Well, Auntie hit the level ... pretty damn exactly. The second thing we take from the chart is that the oscillator, in this case a 20 CCI, or what I call an intermediate-range Canary, actually confirmed the validity of the High. That is ... NO negative divergence. It means that sometime this year, it is likely there will be another attempt to breakout above the 5130ish level. We'll continue to monitor the Canary when that happens to see if it's still singing sweetly, or is starting to squark horribly.

Auntie is not alone in hitting the Forecast targets.

Now, there is a special section in Forecast 2013 where I reveal, I think for the first time anywhere, the two Old Gods responsible for rallies and declines in the price of gold.

And I say again to those of you who bought the Forecast ... your homework for this weekend is to reread the chapter starting on Page 61 - Old Gods ... and gold! 

click to view larger image
I'm not going to reveal here exactly who the Old Gods of gold are, or the mythology surrounding them. However, Forecast 2013 readers should have known in advance where the price turning points in gold would be ... and that the sharp, sudden drop into Thursday's low was likely to produce a bounce, if not a complete trend change.

And the reason it may be more significant than a simple bounce is predicted in the transit table on Page 75, which has the next few trading days specially marked as a potential trend changer.

I would like to record my gratitude to American astrologer, Pat Hardy, for sharing with me - and you - an accurate birth chart for the modern era of gold trading.

Pat runs the Energies, Trends, Cycles website at: http://www.pathardytrends.com

For many years, she produced a financial newsletter and understands perfectly the need to have an accurate birth time for any person or entity. So, she delved closely into the records, after gaining access to the logs from the floor of the Chicago Mercantile Exchange, which traded both London and NY Comex gold.

And the very first gold trade of the modern American era took place in Chicago … which suddenly produces a chart that makes a lot more sense than the New York chart most commonly used.

Okay, I'm nearing the end of this weekend's waffle. I know many readers will be mildly miffed that I'm not updating Weekly Planets charts or talking about transits.

But, if I have a duty of care, it is to those people who bought the book and/or the Forecast and this edition is tailored specifically for them.

For the most part, stock indices have been hitting key upside target levels predicted in the Forecast and we are now within a general timeframe, and at price levels, where key markets could be reversing direction.

As I indicated by using the ASX200 as an example, the state of the Canaries is not screaming alarm bells and it does seem probable that there will be another test of recent Highs, perhaps even another breakout. In the meantime, though, gold has hit one of its key downside levels - though there's a stronger one at 1518.

I know some readers get thrown by whipsaw signals from the daily Idiot when markets go into a sideways correction. Let me remind all of you that The Idiot is a three-timeframe system and you may need to re-read the first chapter of the book to remind yourself of the rules.

And one of the other reasons for the format of this edition is to remind you of another important lesson. STOP talking too much! STOP reading every Tom, Dick and Harriet with an opinion about where things are going. TURN OFF the bloody television talk shows.

And spend more time consulting your own, simple charts - preferably using just The Idiot and a single, reliable oscillator.

The point of trading is to make money - safely and reliably - and without driving yourself crazy in the analysis!


Safe trading - RA

Randall Ashbourne
Astrological Investing's associate, Randall Ashbourne, author of the eBook, The Idiot and The Moon, and The Idiot and the Moon, Forecast 2013, writes a free weekly column titled, The Eye of Ra on his web site in  which he explains the potential impact of astrological aspects and the current state of technical conditions. Ashbourne's charts are revealing illustrations of exactly what has occurred in the market and the probability of what to expect.
Important reading:  Randall Ashbourne's The Idiot and The Moon, Forecast 2013 , Jupiter's cycle and its effects on Wall Street and a posting of the weekly Eye of Ra report in this blog, titled A look at the Venus Retrograde effect
(Disclaimer: This article is not advice or a recommendation to trade stocks; it is merely educational material.)
Copyright: Randall Ashbourne - 2011-2013

The Idiot and the Moon, Forecast 2013
  • Major trend change dates for the full year, plus a month-by-month breakdown of high-energy trading dates and critical reversal dates.

  • An index-by-index analysis of Moon Trading across major American, European, Asian and Australian stock indices-

  • Identifies the major indices where following the phases of the Moon can dramatically cut profits, or even result in large losses.

  • Old Gods & Gold ... a Eureka! discovery about exactly what drives gold prices during rallies and corrections and charts showing highly-reliable target levels to both the upside and downside.

These price charts are individually-tailored to each index and cover Wall Street, Australia, Canada, Hong Kong, Singapore, Shanghai, India, England, Germany and France.

You will not see these charts anywhere else on the Internet!

And much more...

It is NEVER too late in the year to have this monthly information!


Sunday, March 17, 2013

A lesson in gaps, FibRx and FibXt

The Real Spooky Stuff
Randall Ashbourne, an associate of Astrological Investing, posts a weekly market report on his web site, theidiotandthemoon.com The following is this weekend's Eye of RA report: Week beginning March 18, 2013
Hello, boys and girls ... this weekend we're going back to school, putting aside most of The Spooky Stuff to revisit some lessons about the techie stuff.

Oh, don't groan! We all know you peek inside the fortune teller's tent for a weekly planetary fix ... but you're becoming too addicted to the mystical and mysterious.

It's time for a dose of the real world, though we will have a brief look at some of the astrological transits coming up.

Last weekend, I showed you the normal behaviour of the Wall Street markets during Mercury Retrograde phases, which occur for about 3 weeks 3 times a year.

This one did not follow the usual pattern and, instead, most markets rallied throughout the period after a quick dive right at the start.

It is possible that markets will now change direction, along with Mercury. The DJIA has broken above its 2007 peaks and the SP500 is very close to doing so - but the Nasdaq stalled out many weeks ago.

This coming week, the Sun and Venus move out of Pisces into Aries and we enter the 1Q-FM lunar phase. The sign change puts the Sun and Venus into a coming conjunction with Uranus and a square to Pluto - and these two have a more reliable track record of forcing a mood shift than does Mars conjunct Uranus.

Last weekend, I published a chart showing the history of Mars conjuncting Uranus and squaring Pluto and warned you off listening to anyone who started raving on about "the Mars-Uranus crash cycle".

The Sun and Venus each conjunct Uranus once a year ... and the impact is, usually, more reliable as a potential trend turner than Mars.
Click to view larger image

In the chart above, Sun-Uranus conjunctions are the red bars; Venus-Uranus conjunctions are the blue bars ... and there are 7 of them, not counting the one coming this week.

Which is interesting, because 4 of them are right at tops, or very close to, and 2 of them are at, or very close to, bottoms. Have a look; there are 5 or 6 trend changes out of a possible 7 instances. Not a tendency to be ignored lightly.

Now let's have a quick look at Miss Pollyanna's Merc Rx performance ...
Click to view larger image

Ignore, for the moment, the boxed prices. I used this chart last weekend to show the spurt-and-reverse tendency which is normal during the Merc Rx phases. The current phase started out that way ... for just one day. It does create the danger that the Merc Rx rally will be undone as the planet goes Direct again, especially with the money-and-values planet, Venus, moving out of the comfortable territory of Pisces.

If you remember the Greek mythology, Saturn cut Uranus's dangly bits off and threw them into the ocean - causing a bit of froth and bubble until Venus popped forth, where Neptune created a special chariot for her to be drawn safely back to shore. So, Venus and Neppy are good buddies and Venus tends to be at her best while travelling through Pisces.

But, look ... enough of les Spookies for this week. What I want you to look at are the price gaps. Firstly, look at the last 3 bars. There was a gap open on Thursday which jumped above Wednesday's close. On Friday, that gap was filled. There are three other downside gaps which remain. There may even be four. I can't remember exactly when I started keeping a manual chart of the index to overcome the NYSE's lies about the real Open price on any given day.

Now, why is it important to know where the gaps are?

Let's look at the Nasdaq 100 ... which, does NOT tell dirty little lies about its real Open price.
Click to view larger image

Now, when clear gaps open up in a price chart, regardless of whether it's an index or an individual stock, they are ALWAYS filled and often retested, at some point in the future.

I've put a black horizontal to mark a gap which opened to the downside on the NDX when it went into dive mode last September and marked the relevant gap with an X. We can see the stalling action over the past couple of weeks has been filling and retesting that gap.

There is a lower black horizontal and X on the chart ... and we can see how it was closed and tested a few weeks later. Now, these are not, of course, the only gaps on the NDX chart - and many have yet to be filled.

I go through this exercise because it is a valuable lesson in the techie side of things.

We'll turn our attention now to that dead Italian guy ... and the maths lessons he picked up from Arab scholars, who got it from Alexander's Greeks, who undoubtedly picked it up from Indian gurus in those brief periods Alex's boys weren't being trampled by war elephants.
Click to view larger image
Okay, so having looked at where we are with the FibXT levels, let's review the Fibonacci Retracement tool. On the left, we again see the Bear bottom and the top of the first rally leg. There's a lot of stalling at the 236 Rx and the correction finally stops at the 382 level.

So, we would expect - once the entire Bull run is finished - that there will be a minimum FibRx down to the then 236 or 382 level. IF the current rally leg is finished and in need of an intermediate correction, there is a chance the downside is as low as about 1350. To get a more refined handle on the depth of any correction, I'd be more inclined to adopt the safer option of drawing the Fib Rx levels from the bottom in 2011, rather than using the 2009 Bear Low.

So that, boys and girls, concludes the lesson in gaps, Fib Rx and FibXt. It is, I hope you will agree, every bit as interesting and a whole lot more reliable than ... oh, Mercury Rx, for example!

As I keep saying - astrological expectations do NOT over-ride technical conditions. Everyone who wants to trade safely, reliably and profitably needs to give more weight to learning a few tech-head skills than the mystical stuff I often waffle on about!

But ... *ahem* ...

Click to view larger image

Why, yes ... it IS my Weekly Planets chart for the NDX. Last week the Saturn was still at 2812 - again the Nasdaq 100's High for the week. One is not so much a zombie that one can live on tech-head brains alone, y'know!
Click to view larger image
And Auntie, my home index, the ASX200. Negative divergence still building in the oscillator, too.

Okay, that's it for the week! Don't wander off whining that I haven't put up Weekly Planets charts for the rest of the indices. Time for you to do your own damn homework and go play with price gaps, Fibonacci numbers, and Canaries singing sweetly or croaking hoarsely.

You might not get a nice gold star from the teacher. Learn the lesson well, though, and you just might get a few gold bars - real ones ... that you earned for yourself!


Safe trading - RA

Randall Ashbourne
Astrological Investing's associate, Randall Ashbourne, author of the eBook, The Idiot and The Moon, and The Idiot and the Moon, Forecast 2013, writes a free weekly column titled, The Eye of Ra on his web site in  which he explains the potential impact of astrological aspects and the current state of technical conditions. Ashbourne's charts are revealing illustrations of exactly what has occurred in the market and the probability of what to expect.
Important reading:  Randall Ashbourne's The Idiot and The Moon, Forecast 2013 , Jupiter's cycle and its effects on Wall Street and a posting of the weekly Eye of Ra report in this blog, titled A look at the Venus Retrograde effect
(Disclaimer: This article is not advice or a recommendation to trade stocks; it is merely educational material.)
Copyright: Randall Ashbourne - 2011-2013

The Idiot and the Moon, Forecast 2013
  • Major trend change dates for the full year, plus a month-by-month breakdown of high-energy trading dates and critical reversal dates.

  • An index-by-index analysis of Moon Trading across major American, European, Asian and Australian stock indices-

  • Identifies the major indices where following the phases of the Moon can dramatically cut profits, or even result in large losses.

  • Old Gods & Gold ... a Eureka! discovery about exactly what drives gold prices during rallies and corrections and charts showing highly-reliable target levels to both the upside and downside.

These price charts are individually-tailored to each index and cover Wall Street, Australia, Canada, Hong Kong, Singapore, Shanghai, India, England, Germany and France.

You will not see these charts anywhere else on the Internet!

And much more...


Sunday, November 25, 2012

A high-energy astro union of aspects

Randall Ashbourne, an associate of Astrological Investing, posts a weekly market report on his web site, theidiotandthemoon.com The following is this weekend's Eye of RA report: Week beginning November 26, 2012

The first couple of days this week are likely to be volatile as Americans get past Thanksgiving and return to their trading desks.

There are three major astrological aspects on Monday and Tuesday, followed by a lunar eclipse Full Moon as Wall Street opens on Wednesday.

And the little winged-heel guy, Mercury, goes Direct again - having delivered the "perfect" sequence of events during his Rx phase.

We discussed early in the month what is the "normal" behaviour for a Merc Rx period ... the Retrograde date starts a trend, which changes course halfway through, and that by the Direct-again date, prices tend to be back within 1% of where they started the whole phase.

Friday's jump back to the 1410-ish level marked on the SP500's long-range planet price chart ticked all the boxes.

But now things get interesting again. First cab off the rank is a Sun trine to Uranus, quickly followed by a Venus conjunction with Saturn and then a Mars conjunction with Pluto.

Then there's a lunar eclipse Full Moon in Gemini ... and just a normal Moon in Gemini usually brings wide-range days in both directions.

That's a lot of astro energy at play within a very short timeframe.

Let me chat a little about the nature of that energy. Most astrologers work on the assumption that a trine aspect is largely benevolent and interpret the symbolism as an "easy flow" of energy.

The trouble is that an easy flow of energy can be a very bad influence. The real nature of the trine aspect is the sudden removal of all obstacles. Now, this is a damn fine thing if you've been out of work for months, having trouble finding a new job. You suddenly get one ... and it'll frequently be a much better job than the one you lost or left.

However, if you happen to be facing fraud charges ... or anxiously avoiding an audit by the tax office ... the trine can suddenly pull the rug out from under you and you fall hard onto your butt in a deep pile of dung.

And then we have the Venus/Saturn conjunction in Scorpio, the sign which relates to debt, death and taxes. Venus in Scorpio is not the kind of girl you bring home to meet Mum. She's an evil, scheming, manipulative bitch who'll hump your brains out ... and then eat them. While you're still alive.

And that's her good side!

Saturn in Scorpio is even worse. On a mundane level, Saturn is "The Government" and since Scorpio relates to debt and taxes, it represents a timeframe when the business of government will relate strongly to those issues. It means time is running out for governments to continue short-term, quick-fix solutions to problems like sovereign debt and the American "fiscal cliff".

And since Mars conjuncts Pluto in the sign of Capricorn, that's a reiteration of the overall theme. Mars and Pluto rule Scorpio, where Saturn currently travels, and they're meeting in Cappy, which is Saturn's home ground. So, we get this sense that the astro pressure is about to be ramped up dramatically when it comes to money (Venus), government (Saturn) and death, debt and taxes (Mars and Pluto).

When we couple those themes with the Sun trine to Uranus and the volatility implied by a Gemini lunar eclipse Full Moon, it is possible things could get real scary, real fast.

However, let me remind you again of the house rule here ... astrological expectations do not over-ride technical conditions. So, let's look at some charts.

click to view larger image


Firstly, I want to check the historical behaviour of Venus conjunct Saturn aspects - marked with red bars on the chart above. By itself, it's not conclusive and reliable as a turning point ... which is basically the same conclusion we reached with the so-called "Mars/Uranus crash cycle" chart we looked at again last weekend.

But, what happens when we look at the four - Venus conjunct Saturn, Sun trine Uranus, and Mars conjunct Pluto and square Uranus?

click to view larger image

In the chart above, Venus/Saturn is red, Sun/Uranus dark blue; Mars/Uranus pink and Mars/Pluto light blue. Three of these were present in the formation of the two previous Bull peaks. Three of them were nearby during the two previous Bear bottoms ... and near the bottom of last year's August/October plunge.

So, the concern here is not one single aspect ... it's the combination of the punch jammed into a narrow timeframe.

Our next chart is Pollyana's performance during the Mercury Rx phase.

click to view larger image

As usual, the official figures from the NYSE won't reflect the silly gap on Friday's half-day, when markets are easily manipulated. The danger is that this is a set-up and not the real start of the annual Santa Claus rally. Yes, I'm still more than mildly concerned by the lack of a positive divergence signal in the oscillators as Miss Pollyanna made her low on the 16th.

The bounceback is even more obvious on the monthly bars in the 500's long-range planetary price chart.
click to view larger image

It's interesting to look at a monthly chart of the FTSE from a technical point of view. While Polly is playing to the planets, the FTSE can't seem to break through the topside of a triangle ... at least not in a sustained way.
click to view larger image

I'll wrap up this weekend's edition with a few Weekly Planets charts and hopefully get back to a wider look at other indices next weekend when it'll be time to look at the likely ranges for December.

Just bear in mind that the Mercury Rx phase did it's "normal" thing virtually perfectly ... but that we have a combination of astro aspects happening over the next few days which have a tendency to be present when markets are marking out important turning points.

NASDAQ 100 Weekly Planets:
click to view larger image

DAX Weekly Planets:


click to view larger image

ASX 200 Weekly Planets:

click to view larger image


Safe trading - RA


Randall Ashbourne
Astrological Investing's associate, Randall Ashbourne, author of the eBook, The Idiot and The Moon, writes a free weekly column titled, The Eye of Ra on his web site in  which he explains the potential impact of astrological aspects and the current state of technical conditions. Ashbourne's charts are revealing illustrations of exactly what has occurred in the market and the probability of what to expect.
Important reading:  Randall Ashbourne's article, Jupiter's cycle and its effects on Wall Street and a posting of the weekly Eye of Ra report in this blog, titled A look at the Venus Retrograde effect
(Disclaimer: This article is not advice or a recommendation to trade stocks; it is merely educational material.)
Copyright: Randall Ashbourne - 2011-2012