Showing posts with label SP500. Show all posts

Sunday, February 7, 2016

Waiting for the dead cat to bounce

Randall Ashbourne, an associate of Astrological Investing, posts reports and articles on his web site at  theidiotandthemoon.com   The following is this weekend's Eye of RA report: Week beginning February 7, 2016 
It is now virtually certain that all major world stock markets are in the relatively early stages of a big bad Bear.  
We discussed the probability of that in the first two reports for this year, both of which can be accessed by scrolling down.
 
There is still a chance that Central Banks will try desperately to stop the drop, but they appear to have exhausted their ammunition.

The next major rally is, given the extreme levels of technical damage, most likely to be a dead cat bounce which will provide the last chance for many traders to exit Long positions before being wiped out.

That bounce may already be underway, with the mid to late January Lows marking a turning point for a upward-leaning grind that could run into May, perhaps even early June.

Venus conjuncted Pluto and squared Uranus last week, two strongly negative aspects. This week brings a trine to Jupiter. Given both planets are "benefic" and Earth signs are involved, we could see a level of stability return.

I did promise last month to include the current position of some Asian indices; we'll do that this week, as well as taking another look at Wall Street's SP500 and the ASX 200.

 The Nasdaq took a major hit last week, with some of the big name tech stocks rolling over badly. These had been helping to hold aloft the entire American market.

Pollyanna, the SP500, has not yet, I believe, actually confirmed it is now in a Bear market. But that scenario is now leaning heavily towards the probable, rather than the possible.

Below is the 500's long-range planetary price chart. The index is still trying to hold the Pluto level in the early 1870s. It is possible a rebound could take price all the way back to the 2080s. Still, long-term history shows it finds strong levels of both support and resistance at those orange Node lines.

The Weekly Planets chart for the ASX 200 is below, with the index opening and closing last week's trading within a band between grey Neptune now at 5012 and Uranus now at 4974.

There isn't much to stop a further drop if it dives again below the blue Saturns now converging at around 4949. And any rally is likely to find barriers in the 5184 to 5249 range.

India's Nifty is playing very closely to Pluto price lines. Traders can use these lines as potential targets, keeping a very close eye on daily charts for signs of positive or negative divergence starting to show whenever these targets are approached in actual trading.

Hong Kong has already fallen off its Bullish trend line ... something which has not yet happened decisively on the SP500 or ASX 200 ... and has also completed a backtest of the line. Big Bird, the 50CCI, is gasping in the dust of the mine floor.

There is a little positive divergence in the two faster Birds, giving at least some hope for a bounce "from the obvious" level of Fibonacci support.

It's a difficult call, though, since the index is currently stalled below long-range planetary price support. You'll note that in both charts, the next layer of major support doesn't come into force until around 16,000.

Singapore is holding up a little more strongly than the Hang Seng at this stage, still just hanging onto planetary support.

We can see the alternative levels of Fibonacci support and resistance in the chart below. Fibonacci levels and planetary prices will very often be quite close to each other.

The black lines are linked to the previous Bull High and Bear Low and the red ones run from the Bear Low to last year's High, and even a quick glance will show you both sets provide a reliable guide to the likely length of rallies and declines. Again, if you're actively trading in these dangerous conditions, use these as a big picture guide and watch the daily charts like a hawk for any potential turn as the prices are approached.

If this is a major, new Bear ... and it probably is ... the biggest, nastiest, fastest section of the crash is still ahead of us.

Safe trading - RA

Randall Ashbourne (Disclaimer: This article is not advice or a recommendation to trade stocks; it is merely educational material.)
Copyright: Randall Ashbourne - 2011-2016


The Idiot and the Moon, eBook, available for purchase


Saturday, January 2, 2016

2016 ... beware of the Bear


Randall Ashbourne, an associate of Astrological Investing, posts reports and articles on his web site at  theidiotandthemoon.com   The following is this weekend's Eye of RA report: Week beginning January 3, 2016
Best wishes to everyone for a happy and prosperous 2016, though if you're counting on stocks to provide either happiness or prosperity, you'll need to be very nimble.
2015 has ended with very few worldwide stock indices holding onto the gains they made early in the year.v

Many commentators, even the optimistic ones, expect more trouble and few gains to be made in the coming 12 months.

From a contrarian point of view, there are ... perhaps ... too many people calling an end to the Bull run and a return of the Bear; the market rarely does what the majority expect and forecast.

Still, even the best Elliott Wave analysts now believe the end of this very long-running Bull market (at least for the American indices) is only a rally or two away from starting.

It is distinctly possible that some stock markets are already in its grip. Over the next week, I will try to bring you up to date on all the major markets ... starting today with Wall Street's SP500 and Australia's ASX200.

My apologies for my prolonged absence during the past few months. I am still ill and no longer have the energy to write regular columns.

Bear markets tend to be defined in line with the percentage crash from their Highs. The Australian stock market has been one of the world's real laggards in terms of its Bull run since the last Bear terminated in 2009.

The ASX200 made a double top at $5996 last March and April. In the next 4 months, it crashed a tad more than 17.5% from the High and has made four "tests" of that crash level, with December finally making a bounce from the obvious ... contact with a rising trendline.


The Idiot remains on a monthly Sell signal. Big Bird, the 50 CCI oscillator marked with a blue line in the lower panel, has plunged below the +100 level. There remains some hope for a rally in the first part of 2016; we have a bounce from the long-range trendline, Big Bird appears to have made a Zero Line Rejection (ie: it has bounced higher from the red, dotted zero line which tends to indicate a reliable bounce) and Fast Bird, the green line, has spiked above Medium Bird (the red).

Now let's take a look at the Pollyanna index, the SP500, using the alternative Bi-BB method recommended in The Idiot & The Moon. The August mini-crash took the index down 12.5% from its High. The fast MACD remains in clear Sell mode.

Nor is Pollyanna's Big Bird singing a happy song. In the chart below, take special note of what happened to this index when that blue oscillator line plunged below the red +100 line after the two previous Bull peaks. The alarm bells are screaming. Very loudly.

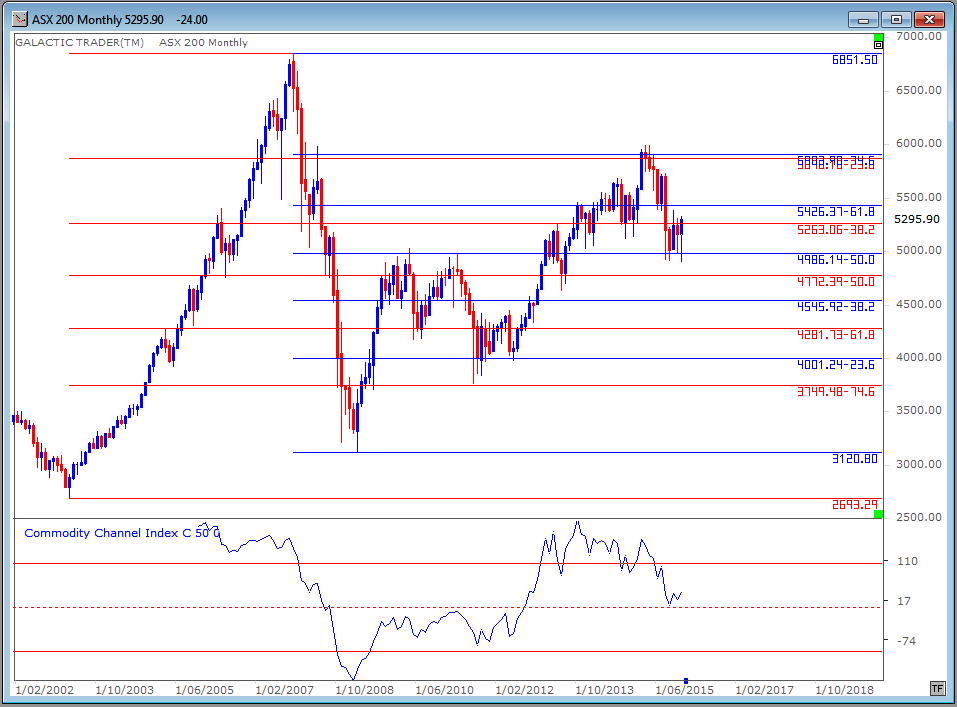
Thankfully, we have some tools which can be used to help us trade these volatile markets. The ASX200, for example, has been making regular stops and reversals at two sets of Fibonacci Retracement levels ... the blue ones from the 2007 peak to 2009 low, the red ones from the strong Bull market leading into that 2007 High.


These are long-range markers and should be used to inform any short or medium term trades you may be considering. In other words, if your daily and weekly charts are starting to show oscillator or momentum weakness as the price rises into any of these Fibonacci Rx targets you need to be very careful about staying Long ... and also need to move your Loss Stops much closer to the current price action at the time.

And we also have my long-range planetary price charts which can be used effectively for price targets ... up or down. The ASX 200 is quite simple. You know from past columns and the book that it is an index with a very strong relationship to Neptune.

Those price lines are marked with both grey and orange lines on the chart below and while there are often overshoots, the reliability of using Neptune prices as targets for moves in both directions, I think is too profitable, and too regular, to be ignored. Again, use these long-range targets to inform your decisions when daily and weekly charts are showing positive or negative divergence and the strong chance of a looming trend change.


And the same is true of the SP500.


In Forecast 2015, I published a basic Elliott Wave diagram, where a Bull run is made up of 5 large waves, with (1), (3) and (5) being the major rally phases and (2) and (4) being the downtrend waves. I marked last year with a red arrow, indicating we were nearing the end of 5 intermediate waves within a long-range 3 rally and that would normally be followed by a major wave 4 correction.

That appears to have happened fairly accurately. If it remains so, we start 2016 at about where I have placed the black arrow. In short, the good times are running out of room and time.

Do NOT go to sleep at the wheel any time during 2016.


Safe trading - RA
Randall Ashbourne (Disclaimer: This article is not advice or a recommendation to trade stocks; it is merely educational material.)
Copyright: Randall Ashbourne - 2011-2016


The Idiot and the Moon, eBook, available for purchase

Monday, January 12, 2015

The Idiot & The Moon - 2015, Overview, January 11, 2015

Randall Ashbourne, an associate of Astrological Investing, posts reports and articles on his web site at  theidiotandthemoon.com  The following is a  link to download his January 11, 2015 Overview of the markets.
"Uranus lay down with Gaea..."
The Great War of the Gods is winding down. Midway through March, Uranus will make the last of its squares to Pluto.

The two Old Gods have been squaring-off with each other since 2008, symbolising a battle
between freedom and control...

In January, 2009, I wrote an essay published on www.astrologicalinvesting.com titled: "The War of the Gods".   (click to read article)

Well, here we are now at the start of 2015, 6 years later, and the world has changed... quite dramatically.

Click to download the January 2015 Overview in PDF format, which includes:
  • Timing of major transits for 2015
  • Bradley Model forecast for 2015
  • Where the market is headed according to Elliot Wave optimists 
  • Charts using Galactic Trader 4 software showing price targets
  • Long-range technical charts for the SP500
Good luck. I wish you all a happy, healthy and prosperous 2015.

Safe trading - RA

Randall Ashbourne (Disclaimer: This article is not advice or a recommendation to trade stocks; it is merely educational material.)
Copyright: Randall Ashbourne - 2011-2015


Astrological Investing's associate, Randall Ashbourne, is the author of the eBook, The Idiot and The Moon,  Ashbourne's Galactic Trader planetary charts are revealing illustrations of exactly what has occurred in the market and the probability of what to expect.


Important Reading:  The Idiot & the Moon, by Randall Ashbourne 

Saturday, January 11, 2014

Wall Street's rally: no sign of The Top yet

Randall Ashbourne, an associate of Astrological Investing, posts a weekly market report on his web site, theidiotandthemoon.com The following is this weekend's Eye of RA report: Week beginning January 13, 2013

The stock market leaders - the Dow, the 500, the Nasdaq and the DAX - all hit their highs on December 31 or January 2.

That was the exact timeframe of the first major Bradley trend change date for 2014.

Prices have been in corrective mode since, but so far there is nothing scary in either the price action or the state of the oscillators.

The coming week is relatively quiet in terms of astrological aspects. Midweek, we get the Full Moon and a Venus square to Mars.

Neither of those normally has enough oomph to produce a major change in the trend.

Gold ended the week making another attempt to break the overhead barrier of a secondary Pluto line, priced around the 1248 level. Those charts are in Forecast 2014. 

The daily Big Bird oscillator has spiked higher, indicating an above-average chance that price will continue its northbound run.

There is another secondary Pluto price line at 1272, but the target for this run is probably higher still - into the 1300s.

The Idiot has now gone to a gold Buy signal on both daily and weekly timeframes. 

Gold bouncing strongly higher while stock prices basically flatline is a somewhat contradictory message, leaving one or the other vulnerable to a sharp drop.

However, for the moment, there are few signs of an imminent plunge in stocks.

The monthly Bi-BB chart of the SP500 is our first chart this weekend. For almost a year price has continually made a touch of the upper band, with breaks above it tending to produce the expected stalling.

And that may be what we have again. Price ended last week exactly where it started the year. The fast MACD endorses the validity of the long-running rally by recording its own new peak in line with the price. The MACD histogram is wavering, but not screeching.

A weekly version of the same technique does indicate the rally is starting to weaken internally. Note there is now a reasonably significant level of negative divergence between the higher prices over the past 3 weeks and the slump in the current state of both the MACD signal line peak and the histograms.

It's not so strong that it rules out an attempt at new highs on Wall Street; simply a warning that the danger of a rollover is growing.

Warm regards, best wishes and ... Safe trading - RA

Randall Ashbourne
Astrological Investing's associate, Randall Ashbourne, author of the eBook, The Idiot and The Moon, and The Idiot and the Moon, Forecast 2014, writes a free weekly column titled, The Eye of Ra on his web site in  which he explains the potential impact of astrological aspects and the current state of technical conditions. Ashbourne's charts are revealing illustrations of exactly what has occurred in the market and the probability of what to expect.
Important reading:  Randall Ashbourne's The Idiot and The Moon, Forecast 2014
(Disclaimer: This article is not advice or a recommendation to trade stocks; it is merely educational material.)
Copyright: Randall Ashbourne - 2011-2013

Friday, December 6, 2013

Price levels for breakout or breakdown

Randall Ashbourne, an associate of Astrological Investing, posts a weekly market report on his web site, theidiotandthemoon.com The following is this weekend's Eye of RA report: Week beginning December 9, 2013
Will Wall Street rally go into Santa mode.
Wall Street in Santa mode?
We have a couple of significant astrological transits this week which could help determine whether the Wall Street rally goes into Santa mode.

On Tuesday, Mercury trines Uranus and on Thursday, Jupiter makes a trine to Saturn.

They're particularly significant for Pollyanna, the SP500, because the index has been range-bound within those planetary barriers for the past three weeks.

I'll show the relevant chart and the key price levels to watch on Tuesday and Thursday in the main body of this weekend's edition.

A trine represents an easy flow of energy. Effectively, the impact is the rapid removal of obstacles. And that's why we may well see breakout ... or breakdown ... this week.

Of the two, it's the Jupiter/Saturn aspect which is the more important because these two are regarded as the business planets. The trine, which is in effect for several months, suggests a period of steady and sustained expansion, which may be why we're seeing some better economic data.

But trines can represent a high point in the cycle, when the "easy flow" of energy really translates as "it doesn't get any better than this".

That's why it'll be important to monitor the price levels on Tuesday and Thursday to see how the 500 reacts.

Our first chart this weekend shows Mercury and Uranus price levels (pink and yellow) and the Jupiter/Saturn levels (dark blue and light blue).

Pollyanna's prices crept into this high-intensity zone three weeks ago and has been testing the barriers. That's why I think we could see a breakout, or a breakdown, this week.

If the index is going higher, it should decisively clear 1808.57 on Tuesday ... as well as 1811.63 on Thursday. If the index hits those prices, pretty much precisely, on those days and begins to rapidly back away from them, it'll be another warning sign.

But we also need to watch the downside levels ... 1791.32 on Tuesday and 1788.27 on Thursday. A decisive Close below those levels is likely to signal strong, further correction.

Most major world indices have been in a significant correction mode for several weeks. It is largely only Wall Street and Germany which have been hitting all-time Highs.

Pollyanna's drop last week bounced again from the red line parallel of the rally channel the index launched into a year ago.

Below is a close-up view of that chart. Negative divergence continues to build in the Big Bird oscillator, which hasn't recorded a new peak since October.

Anyway, the Mercury-Uranus and Jupiter-Saturn price levels are likely to provide the key to the next intermediate-term move.

Last weekend's "potential for a golden bounce" died virtually immediately when the midnight cowboys did another paper gold dump.

There is all sorts of speculation about exactly who is behind these moves. Most experienced players believe it's a central bank game, especially since some of those banks are now raising the spectre of charging people to keep money in savings accounts, rather than paying interest to depositors.

We're entering a new and dangerous phase of the Uranus/Pluto square, especially with Uranus due to go into Direct motion again on December 17.

The central banks seem to be trying to make gold dangerous ... and saving money even more dangerous, since it'll be decimated by both fees and inflation. In short, they want us to spend ... or buy stocks. And they'll just hit the go-faster button on the printing presses.

But that's a discussion for another day. Gold needs to reclaim the Pluto price zone from 1249 to 1270 before there's another chance to bounce substantially.


I'm in the process of researching and writing Forecast 2014, which I hope will be available in the first few days of January. After next weekend, the Eye of Ra will probably take a break until then so I can concentrate on finalising that report.

Safe trading - RA

Astrologicalinvesting.com note:  Randall Ashbourne's Forecast 2014 will be available to purchase in January 2014 at 
www.astrologicalinvesting.com  as well as www.theidiotandthemoon.com 

Randall Ashbourne
Astrological Investing's associate, Randall Ashbourne, author of the eBook, The Idiot and The Moon, and The Idiot and the Moon, Forecast 2013, writes a free weekly column titled, The Eye of Ra on his web site in  which he explains the potential impact of astrological aspects and the current state of technical conditions. Ashbourne's charts are revealing illustrations of exactly what has occurred in the market and the probability of what to expect.
Randall Ashbourne's Forecast 2014 will be available to purchase at www.astrologicalinvesting.com/html/shop.htmlwww.astrologicalinvesting.com  as well as www.theidiotandthemoon.com 


(Disclaimer: This article is not advice or a recommendation to trade stocks; it is merely educational material.)
Copyright: Randall Ashbourne - 2011-2013

Saturday, September 21, 2013

Putting a number on the sign of the Bear

Randall Ashbourne, an associate of Astrological Investing, posts a weekly market report on his web site, theidiotandthemoon.com The following is this weekend's Eye of RA report: Week beginning Sept, 22, 2013
once the line is broken
..once that line is broken....
For months, various Fed heads have seized almost every opportunity to talk about tapering.

Until last week, when Benny the Benificent did his best Huck Finn impression: Aww, shucks. We wuz just pulling yuh leg.

In plain-speak the message was clear: The American economy is still so deeply in the mire, Ben can't pull the plug on his bubble bath without sending Wall Street down the gurgler.

But Benny is winding-up his term and his blow-up Bull run may well expire with him. The truth is the long-range technical conditions are finally starting to sag.

They are not yet at the stage where the warning sirens are so loud and dangerous that the inevitable collapse seems imminent. And, probably, few of us doubt that Ben will do whatever it takes to prop-up the markets so it doesn't all fall to pieces while his reputation is on the line.

We'll spend this weekend having another look at the big picture position of the SP500 ... and of gold.

Both markets enjoyed a sudden and stellar jump last week, only for it to fade almost as fast as it arrived. In fact, gold finished the week with absolutely no change from the previous week.

And now that the tapering talk seems to have been dismissed as all a big misunderstanding, the street talk has moved on to the next potential crisis ... the official US debt ceiling.

Enough of all that ...

Let's just ignore the constant chatter and look at the state of the charts ... and maybe even try putting a number on the return of the Bear.

Since the last Bear Low in early 2009, Miss Pollyanna has been rising in a clearly-defined channel. In fact, it's really quite remarkable how steady, sane and well-behaved it has been ... something we totally miss when we're caught up in the news cycle and the daily jerks and squiggles.

What is the single most important thing about the chart below? Simple. Every High has been higher than the previous one; every Low has been higher than the previous one.

That's the classical definition of a Bull market. And it stays a Bull until ... a lower Low is made, followed by a lower High.

For the moment, the line-in-the-sand on the SP500 is 1560. Once that line is broken, the odds will have increased dramatically that Wall Street is back in the grip of a Bear market.

Last year, I had expected that the statistical tendency of markets to top out with Jupiter in Taurus was in play. But, I also kept talking about the "elephant in the room" which threatened to poop on my Bear rug ... the lack of any negative divergence signal from the Big Bird oscillator, the 50CCI.

I marked the two key areas with yellow ovals. While there was negative divergence at the 2007 top, there was none last year. Now, however, we are starting to see the first signs of faltering.

But, the final peak for this Bull run might still be months away. We appear to have had an inversion in the Bradley Model. Purely from an eyeball glance.

I have stressed in the past that it is the dates which are paramount with the Bradley; not the size nor the direction of the change. The model for the year suggested a major change of direction around June 22. And, with the benefit of hindsight, it appears to have marked a clear Low, not a High.

 As we can see, market prices had been tending to follow the direction of the plotted Bradley line. Yet, the "peak" of June 22-24 ... which predicted a major trend change lasting all the way through to late December ... seems to have timed, virtually perfectly, the last major low.

I've marked the major trend change dates for the rest of the year on the chart. Let me stress again: IGNORE the direction of the plotted line and pay attention to the dates. We cannot guarantee there won't be another inversion. An ongoing rally ... with weakness in October ... seems to "fit" the expectations. Let's just not get married to the idea.

We may also have had a short-term inversion last week ... a relatively rare Full Moon high. Statistically, Full Moons tend to bring in a near-term Low.

In the chart below, Full Moons are the thick blue bars with a dot; New Moons are the dotted red bars. There was really only one previous Full Moon high ... and price went into a sideways shuffle until the next New Moon started a decline.

Another point of interest shown by the NM-FM chart is the obvious deceleration starting to occur - something which is not at all obvious on the monthly channel chart at the start of this weekend's edition.

We can see how, for the first half of this year, Miss Polly rose steadily within a climbing channel. And then it started to breakdown. So, we added a red parallel below the original channel.

And the next breakdown dropped below that red line ... and last week's jump stalled short of climbing back inside the original channel.

Warning signs.

The direction of the next major move in gold is still unclear. Last week's shenanigans had the EW labellers going nuts. No-one seems absolutely certain whether the big correction is over.

In the most basic terms, greenback gold remains locked within the confines of a downtrend channel. There is definite improvement in all three of the Canaries, including Big Bird who has at least reclaimed the "normalcy" zone between the upper and lower red lines which tend to mark oversold and overbought territory.

For a brief period after the Fed's backflip, gold regained the primary Pluto line at 1360 and looked as if might hold it. Until Friday's slump wiped out the gains and left things exactly where they were at the end of the previous week.

Even Goldman Sachs doesn't know what's happening with gold. Last week caused its two most bearish analysists to have a change of heart. They had been warning of a slump down to around $1000. Now they're back talking about the 1400s again.

Looks like even the great GS believed all the taper talk.


Finally, below, the Weekly Planets chart for my home index, the ASX 200. Again, it's had a strong two-week run north, in contravention of the statistical tendency of the NM-FM phase.

After spending a few weeks trapped by the overhead Neptune in the 5130s, the index broke free and hit the Uranus barrier at 5290. Big Bird grows increasingly sick as the price climbs.

Safe trading - RA

Randall Ashbourne
Astrological Investing's associate, Randall Ashbourne, author of the eBook, The Idiot and The Moon, and The Idiot and the Moon, Forecast 2013, writes a free weekly column titled, The Eye of Ra on his web site in  which he explains the potential impact of astrological aspects and the current state of technical conditions. Ashbourne's charts are revealing illustrations of exactly what has occurred in the market and the probability of what to expect.
Important reading:  Randall Ashbourne's The Idiot and The Moon, Forecast 2013
(Disclaimer: This article is not advice or a recommendation to trade stocks; it is merely educational material.)
Copyright: Randall Ashbourne - 2011-2013

Sunday, June 30, 2013

The danger of trines

Randall Ashbourne, an associate of Astrological Investing, posts a weekly market report on his web site, theidiotandthemoon.com The following is this weekend's Eye of RA report: Week beginning July 1, 2013
The danger of trines - Randall Ashbourne
Wall Street takes a break this week as the USA celebrates its birth as an independent nation. Happy Birthday!

Last weekend I highlighted the bounce potential for world stock indices and the price of gold. Stock markets bounced and gold slumped.

We will take another look at gold charts in a little while. But most of this edition will concentrate on examining the past behaviour of the markets during sets of important trines.

In the middle of July, Jupiter will make a Grand Trine with Saturn and Neptune. All three planets will be 120 degrees apart in water signs - Jupiter in Cancer trined to Saturn in Scorpio trined to Neptune in Pisces.

A Grand Trine involving these three outer planets is a relatively rare event and there is a tendency among astrologers to view such an aspect with celebration and optimism.

It is a misunderstanding of the nature of a trine. The normal symbolism applied to a trine is that it represents an easy flow of energy ... that it's a good times scenario when life and progress flow smoothly and easily.

What it actually means is the removal of obstacles. And that means Up ... or Down! I've mentioned before that if you've been having a hard time of life and a big trine comes along, you suddenly get a new job, win the girl of your dreams, and buy a winning lottery ticket to boot!
But it depends entirely on the circumstances. If you've been in the courts fighting like hell to stay out of jail and a trine comes along in your personal horoscope, it can just as easily send you away for a long time! The "obstacles" you've been throwing in the court's path just get swept aside.

So the primary question here is: What are the obstacles? Are they blocking the markets from moving higher ... or stopping them from dropping like a stone?

Let's explore the symbolic nature of the planetary energy first. Jupiter is the Old God of good times, expansion and growth; Saturn relates to restrictions, duty, responsibility and getting your just desserts; Neptune fires ideals, dreams, hopes and wishes.

In simplistic terms, Jupiter gives you what you want, Saturn gives you what you deserve, and Neptune feeds your inner addictions.

Jupiter and Saturn, in our context, are also the business planets. So, most stock indices have been Bullish since the Bear bottom in 2009 and the Old God of growth has sent a lot of them higher than the 1999/2000 and 2007 peaks.

Saturn wants to keep a running check on PE ratios and whether the price levels are "deserved". And Neptune ... well, I think we'll give Neptune responsibility for the boundless printing of money from nowhere, feeding the addiction of large traders to QE4ever.

Saturn and Neptune have been in an ongoing trine for a little while now ... with Ole Misery, the restrictive god, demanding to know just how long this cheap money addiction is going to last. Saturn doesn't like cheap and easy anything. And he has a very short temper with addictive behaviour. After all, it's not good for you in the long run. And Saturn is all about what's good for you in the long run - and really doesn't give a rat's about how you feel!

Jupiter and Neptune are like a couple of almost identical twin brothers. If it feels good, do it! And then do it again ... and again. Like brothers, they'll sometimes display a bit of rivalry when it's just the two of them.

But, when "Dad" appears scowling and frowning, they'll stand side-by-side putting on a united show of bravado. And that's what we're about to face.

So, let's look at past behaviour to try to get some idea of what to expect ...

In the SP500 weekly chart below, Jupiter-Neptune trines are green bars; Jupiter-Saturn trines are blue bars; Saturn-Neptune trines are red bars.

And even at an eyeball glance, we're not talking "do-nothing" results with any of these aspects. These have a strong tendency to be market-movers ... and we have a triple whammy approaching mid-month ... with the Jupiter-Saturn trine due to be ongoing.

As it was in the lead-up to, and crash from, 2007.
click for larger image
Nor is the behaviour isolated to just the past decade or so. Below is a longer-range monthly chart of the 500 ... and the Jupiter-Saturn trine was present in the lead-up to, and crash from, the 1987 peak - and also present in the early 90s recession.
click for larger image
I've mentioned in the past how similar the current era seems to be to what happened with stock markets during the Bull/Bear/Bull/Bear/Bull/Bear phase which caused turmoil in the 1960s.

And, once again, we see the same three trines were strongly in play during that period.
click for larger image
And there, too, during the turbulent 20s, 30s and 40s ... 
click for larger image

So, not only do we have the ongoing Uranus-Pluto square to deal with, which we've discussed a number of times in the past couple of years ... we're about to go into Jupiter-Saturn-Neptune trine danger mode.

Perhaps we should all take a little time during the July 4 slowdown to examine our holdings very, very closely and have a firm plan-of-action in place to protect our capital.

Now, let's look again at gold prices ... which plunged while stocks bounced.

The danger implied by the still deeply-diving oscillator I mentioned last weekend is going to take even more time to ease. Talking with a couple of friends during the week, I used the Incredible Charts software to define a couple of technical levels likely to be important since price keeps breaking Fibonacci and planetary levels.

The levels are 1180 and 976 ... and the first of these was hit only a day or so after I sent the chart. The reality is that it's unlikely that even that is The Bottom of gold's plunge.

I've altered the oscillator to a 20 - medium-range - reading because I seriously doubt we are going to get a sustained turnaround in gold until this particular Canary records a positive divergence reading. Meaning, it will have to make a higher trough while price is making a lower one.

Until that happens ... and happens very clearly ... bouncebacks are likely to be relatively short-lived
click for larger image
Prices continue to respond to the Sun-Pluto levels of the planetary chart ... and the mild positive divergence in the weekly oscillator is continuing to build. However, until we get an instance of it on the monthly chart, we probably cannot expect a long-range turnaround.

click for larger image

No stock charts this week. We are entering an astrological aspect phase this month which has a history of creating turmoil. And remember it is an ongoing phase, not just a one-off event.

We don't need to get overly optimistic or unduly pessimistic. We do need to remember that Saturn is about taking responsibility, making solid, practical plans ... and doing what is good for us in the long run.

So, review your portfolio and, at the very least, make sure you have rigid loss stops in place to protect your capital. The last thing we want to do when Saturn energy is being highlighted is to let the Old God of good times and his dream-weaving twin double-up the addiction.

Safe trading - RA

Randall Ashbourne
Astrological Investing's associate, Randall Ashbourne, author of the eBook, The Idiot and The Moon, and The Idiot and the Moon, Forecast 2013, writes a free weekly column titled, The Eye of Ra on his web site in  which he explains the potential impact of astrological aspects and the current state of technical conditions. Ashbourne's charts are revealing illustrations of exactly what has occurred in the market and the probability of what to expect.
Important reading:  Randall Ashbourne's The Idiot and The Moon, Forecast 2013 , Jupiter's cycle and its effects on Wall Street and a posting of the weekly Eye of Ra report in this blog, titled A look at the Venus Retrograde effect
(Disclaimer: This article is not advice or a recommendation to trade stocks; it is merely educational material.)
Copyright: Randall Ashbourne - 2011-2013

The Idiot and the Moon, Forecast 2013
  • Major trend change dates for the full year, plus a month-by-month breakdown of high-energy trading dates and critical reversal dates.

  • An index-by-index analysis of Moon Trading across major American, European, Asian and Australian stock indices-

  • Identifies the major indices where following the phases of the Moon can dramatically cut profits, or even result in large losses.

  • Old Gods & Gold ... a Eureka! discovery about exactly what drives gold prices during rallies and corrections and charts showing highly-reliable target levels to both the upside and downside.

These price charts are individually-tailored to each index and cover Wall Street, Australia, Canada, Hong Kong, Singapore, Shanghai, India, England, Germany and France.

You will not see these charts anywhere else on the Internet!

And much more...

It is NEVER too late in the year to have this monthly information!