Showing posts with label June. Show all posts

Friday, May 30, 2014

June 2014, Astrological Calendar - Transits for NY NY, The NYSE

Astrology calendar showing the day and times of planetary aspects for the NYSE, for the month of June, 2014.
Click to view larger image
Using locational transiting aspects is critical in market timing.  Have these calendars BEFORE they are posted each month.

Calendars come complete as full 13-month calendars January 1, 2014 through January 31, 2015.

 There are three separate 13-month calendars -  transit to transit aspects for the NYSE, FTSE, and ASX.

Download these handy PDF calendars to your iPad, or other electronic reader and/or and phone, and of course, to your computer to read. (They are printable as well.)

Included are transit to transit aspects; dates of Moon Phases, Planets Stationing (changing directions) and Eclipses; and a schedule of open hours and days for each market, New York, London, and Australia.

These calendars can be purchased individually for $8.00, but all three are available for $16.00 Click to purchase.

Saturday, June 15, 2013

June 2013, Astrological Calendar - Transits for NY NY, The NYSE

Astrology calendar showing the day and times of planetary aspects for the NYSE, for the month of June, 2013.
Astrology Calendar for the NYSE, June 2013
click to view larger image

Using locational transiting aspects is critical in market timing.

To have these calendars BEFORE they are posted each month, they are available to purchase.  They come complete as full 13-month calendars January 1, 2013 through January 31, 2014.

The calendars are perfect for viewing on an iPad or other electronic reader - and they can be printed.  Included are dates of Moon Phases, Planets Stationing (changing directions) and Eclipses, as well as a schedule of open hours and days for each market. 
Click here to purchase

There are three separate 13-month calendars - January 1, 2013 through January 31, 2014 - with transit to transit aspects for the NYSE, FTSE, and ASX.

These can be purchased individually for $7.00,or all three for $14.00 -That is a buy two, get one free price!

June 2013 Astrological Calendar - Transits for London, England, The FTSE

Astrological Calendar showing the day and times of planetary aspects for the FTSE, for the month of June, 2013.
Astrological Calendar for planetary aspects for the FTSE, June 2013
click for larger image
 Using locational transiting aspects is critical in market timing.

To have these calendars BEFORE they are posted each month, they are available to purchase.  They come complete as full 13-month calendars January 1, 2013 through January 31, 2014.

The calendars are perfect for viewing on an iPad or other electronic reader - and they can be printed.  Included are dates of Moon Phases, Planets Stationing (changing directions) and Eclipses, as well as a schedule of open hours and days for each market. 
Click here to purchase

There are three separate 13-month calendars - January 1, 2013 through January 31, 2014 - with transit to transit aspects for the NYSE, FTSE, and ASX.

These can be purchased individually for $7.00,or all three for $14.00 -That is a buy two, get one free price!

June 2013 Astrological Calendar - Transits for Sydney, Australia, The ASX

Astrology calendar showing the day and times of planetary aspects for the ASX, for the month of June, 2013.
Astrological Calendar for planetary aspects for the ASX, June 2013
click for larger image
Using locational transiting aspects is critical in market timing.

To have these calendars BEFORE they are posted each month, they are available to purchase.  They come complete as full 13-month calendars January 1, 2013 through January 31, 2014.

The calendars are perfect for viewing on an iPad or other electronic reader - and they can be printed.  Included are dates of Moon Phases, Planets Stationing (changing directions) and Eclipses, as well as a schedule of open hours and days for each market. 
Click here to purchase

There are three separate 13-month calendars - January 1, 2013 through January 31, 2014 - with transit to transit aspects for the NYSE, FTSE, and ASX.

These can be purchased individually for $7.00,or all three for $14.00 -That is a buy two, get one free price!

Saturday, June 8, 2013

Reviewing the correction ... and long-term

Randall Ashbourne, an associate of Astrological Investing, posts a weekly market report on his web site, theidiotandthemoon.com The following is this weekend's Eye of RA report: Week beginning July 1, 2013

The Idiot and Big Bird disagreed with astrological expectations - Randall Ashbourne
"Some lessons are very s-l-o-w-l-y learned!"
Late in May, I indicated there was a strong chance stock markets had gone into a correction mode likely to last for several weeks.

In some markets, the correction has been deep and steep; in others the decline has been shallow. Too shallow, in fact - both in terms of time and price.

But regardless of that, we may have reached bounce levels across most of the major world indices.

Last weekend we reviewed the potential for a major trend change to develop this month - if indices continue to follow the major turning points indicated in this year's Bradley Model major dates. If you haven't read it, you can review the edition by scrolling down or clicking here.
This weekend, we'll be taking a look at the status of the current correction and looking again at where we are in a long-range context.

I indicated last weekend that Pollyanna, the SP500, was giving relatively clear signals that we are now probably within the process of topping out the Bull run which got underway in 2009.

At this stage, that's still my view. But, we'll begin this weekend by looking firstly at where we are within the correction.

In late May, I warned against short-term traders taking the usual Long trades between Full Moon and New Moon. I wrote: "Polly has been rising in a clear channel since the Santa Claus rally got underway late last year. A breach of the upside channel line, with negative divergence in the oscillator, puts the index under threat of a retreat to retest the lower trendline."

And so it came to pass ...

Polly spiked briefly down through the lower trendline on Thursday before bouncing strongly on Friday, the last trading day before the New Moon.

click to view larger image

Full Moons are the heavy blue candles, New Moons the red ones. We got a clear V-turn in the oscillator, as we did at the three previous corrections within this rising channel.

But, there's a difference ... two of the price/oscillator turns arrived at Full Moon bottoms and the third one arrived with a 1Q Moon. This bounce has arrived right on New Moon timing, when markets statistically are most bouyant. It's not unusual for rallying markets to continue rising in the statistically negative period between NM and FM, but the rises do tend to muted, at least most of the time.

So, the Friday bounce could be short-lived. We need to pay close attention to price reaction on Tuesday and Wednesday when Venus opposes Pluto and squares Uranus.

In the late May edition, I used a chart of the ASX200 as proxy for what I thought was happening and said: "Technically, it appears to be a high-level Wave 4 underway. This is the last major correction before the final rally of a Bull leg."

I had expected the Elliott Wave Theory of "alernation" to come into play - that the correction could drag out in terms of Time, without necessarily losing quite as much in Price as did the first similar-level correction within the rally out of the spike lows in August/October, 2011.

Wrong! The ASX, and some other indices, just kept diving!

click to view larger image
If this is a high-level Wave 4 correction, it has overshot the Wave 2 decline into June 2012 in terms of Price, but not yet of Time. And the index has breached the important Weekly Planets level at 4744.

That does set up the potential for a bounce from here, even in the face of the negative tendency of the NM-FM phase. It took a few weeks of bouncing about for the last correction of this level to get enough traction to start rising again. Whatever happens, the Weekly Planets price targets for a bounce are clearly marked and likely to be significant.

Now, let's turn our attention again to the bigger picture ... and we'll begin with a look at Pollyanna's long-range monthly. Those of you who've read The Idiot &The Moon will know that one of the techniques outlined in The Technical Section deals with how a particular stock, or index, will repeat the same angles of trend over and over again.

The chart below is simply a slight variation on that theme. I've taken the angle of the current Bull run and applied it to the two previous ones, rather than the other way around - just to see how this one is performing in comparison with the other two.

We can see fairly quickly that this Bull is more like the blow-off Tech Bubble run into 1999/2000. The 2002-2007 Bull run oscillated around this angle, rarely getting too far ahead, or too far behind the trendline.

The earlier bubble run soared away from the line and had deeper corrections to reconnect ... as has this one. The second thing to note is the thin red line connecting the 1999 and 2007 Bull peaks. And that's what Miss Polly came down to retest last week.

click to view larger image

The third thing on the chart to consider is the state of the long-range Canary - the Big Bird. I've inserted a black vertical into the price of the two previous Bull peaks and at the current May peak in Pollyanna. And I repeat the point I made last weekend. The Canary is not dropping off its perch.

The negative divergence build-up going into the first Bull peak developed over a long period. There was a shorter, but nevertheless clear, warning at the 2007 peaks. And, at the moment, we just don't have it for the current Bull run.

Now, let's review where we are in terms of Polly's long-range planetary price markers. I confess I had fully expected Pollyanna to go into a major swoon and exit the stage for a major Chicken Little performance as the index hit the levels between 1464 and 1519.

I'm a fool. Not an Idiot ... because The Idiot and Big Bird continually disagreed with my "astrological expectations". What can I say? The Idiot and that bloody Bird are always a lot smarter than I am!

click to view larger image
Yes, yes. It's enough to give one the ... uhm, irrits. The truly sad thing is that even knowing The Idiot and Big Bird are smarter than I am, I still make that fatal trading error of "thinking" ... even after having gone to the trouble of putting it all in a book so that I, and you, would just shut-up and do what our charts tell us to do, rather than trying to anticipate them. Some lessons are very s-l-o-w-l-y learned!

Ah, well. No time to wallow. Let's take a quick look at the long-range planetary charts for the FTSE and the DAX.

Germany is behaving like Pollyanna, trying desperately to hold onto the long-range breakout level.

click to view larger image
While London went into a deeper dive ...

click to view larger image
Next weekend we'll have another look at what's happening with the Asian indices.

Overall though, we can see that stock indices have declined into apparent bounce levels. Shallow, but obvious, in the case of Pollyanna and the DAX. Deeper, but still obvious, for the ASX and FTSE.

The Bradley Model suggests markets should continue their rally phase into later in June.

And personally I believe that what is "normal" is that indices are now within a topping process where we are going to get jerked around for a few months ... before the Bear comes back. This certainly appears to be a Bernanke-blown bubble. Every piece of bad economic news is greeted as good news because benign Ben will stretch out his QE4-ever program.

I think we getting a taste of it. The slightest hint that the Fed might pull back, and the addicts suffer withdrawal shakes. However, I reiterate my earlier point. "Thinking" just isn't the best tool for trading stock markets. Trendlines, an Idiot and a silly bloody Canary tend to be a lot better at it.

Safe trading - RA

Randall Ashbourne
Astrological Investing's associate, Randall Ashbourne, author of the eBook, The Idiot and The Moon, and The Idiot and the Moon, Forecast 2013, writes a free weekly column titled, The Eye of Ra on his web site in  which he explains the potential impact of astrological aspects and the current state of technical conditions. Ashbourne's charts are revealing illustrations of exactly what has occurred in the market and the probability of what to expect.
Important reading:  Randall Ashbourne's The Idiot and The Moon, Forecast 2013 , Jupiter's cycle and its effects on Wall Street and a posting of the weekly Eye of Ra report in this blog, titled A look at the Venus Retrograde effect
(Disclaimer: This article is not advice or a recommendation to trade stocks; it is merely educational material.)
Copyright: Randall Ashbourne - 2011-2013

The Idiot and the Moon, Forecast 2013
  • Major trend change dates for the full year, plus a month-by-month breakdown of high-energy trading dates and critical reversal dates.

  • An index-by-index analysis of Moon Trading across major American, European, Asian and Australian stock indices-

  • Identifies the major indices where following the phases of the Moon can dramatically cut profits, or even result in large losses.

  • Old Gods & Gold ... a Eureka! discovery about exactly what drives gold prices during rallies and corrections and charts showing highly-reliable target levels to both the upside and downside.

These price charts are individually-tailored to each index and cover Wall Street, Australia, Canada, Hong Kong, Singapore, Shanghai, India, England, Germany and France.

You will not see these charts anywhere else on the Internet!

And much more...

It is NEVER too late in the year to have this monthly information!

Saturday, June 1, 2013

Are we there yet? The road ahead

Randall Ashbourne, an associate of Astrological Investing, posts a weekly market report on his web site, theidiotandthemoon.com The following is this weekend's Eye of RA report: Week beginning June 3, 2013

June Bradley Model Forecast - The Road Ahead
June has arrived ... when we find out if the "sell in May" mantra will prove to be profitable this year.

And June also brings what is probably the most important Bradley Model trend change date for the year.

If the Bradley is correct, this trend change will be long-lasting, because the next really major date does not arrive until March, 2014.

We will spend this weekend examining those omens because in the years it is accurate, the Bradley Model is uncannily so.

Last weekend I indicated I thought stock markets had entered a correction mode likely to last for at least several weeks - and used a weekly chart of the ASX200 as an example of what we could probably expect.

In this I am at odds with the Bradley forecast - and those who now worry that we have entered crash mode.

I won't go into the astrological weather. I've done that in the past few weeks and the Bradley itself takes its trend change dates from particular combinations of planetary pairs. In short, the Bradley is distilled astrology.

The most significant dates for June are likely to be the 7th and the 22nd.

For this edition, we'll be concentrating on Pollyanna, Wall Street's SP500, and using it as the barometer for most major stock indices.

And our first chart will be the Bradley Model. Pollyanna has been rising since the Bradley indicated a long-term trend change in mid-2010 and certainly seems to have been "following" the model fairly accurately since its direction change late last year.

If it works again, the trend will change this month - and continue in that direction for many months.

click to view larger image
Next we will look at a "tweaking" of the basic Bradley. It's important to remember with both that it is the dates which are most important - rather than the direction or the amplitude of the swing. Nonetheless, both versions indicate a big change is about to arrive.

click to view larger image
Next we'll have a look at the long-range performance of the tweaked version, using a multi-decade chart for Pollyanna, with the index in blue and the Bradley in dark green.

If you spend a few minutes closely examining this chart, you'll understand what I mean when I say it's the dates that are important, rather than the direction or size of the swing.

Sometimes the index made a low while the Bradley line was making a peak - and at others they matched each other closely. Even so, we can see the potential for a major downturn about to start if it's not already underway.
click to view larger image
Okay. So why am I at odds with the Bradley forecast and why am I not convinced that we have reached THE top of this Bull run?

Because it wouldn't be "normal". And it's true these markets aren't normal. They're hitting these levels because central banks like the US Federal Reserve have been printing money by the *ahem* helicopter load and dropping it into asset purchases to prop up stock markets.

Nevertheless, it is "normal" for markets to undergo a topping PROCESS. It takes Time. We now have what MIGHT be the first sign that The Top is in the process of being put in place.

We now have a monthly bar that has been left hanging by a thread - rather similar to the two earlier Bull peaks. BUT there is no near-term negative divergence obvious in the long-range Canary and there is no multi-month process evident as it was at the previous tops.

click to view larger image


So, on the basis of the technical evidence ... and merely what is "normal" behaviour ... I find it hard to believe we are launching into crash mode from here. I do think we have entered a significant correction mode, but cannot rule out an attempt to record new highs.

However, the very long-term omens are quite dire.

Which is the subject of our next chart. I have indicated before, simply through an "eyeball" look at the chart, that stock index behaviour since 1999/2000 bears a remarkable similarity to what happened during the 1960s when there was a succession of Bull peaks and Bear bottoms (the area marked with a yellow oval).

If that is so, we are now rapidly approaching Peak 3 ... the start of the deepest Bear plunge.

And on this chart the long-range Canary is screeching a warning sign that the Gates of Hell are starting to open ..
click to view larger image

Safe trading - RA

Randall Ashbourne
Astrological Investing's associate, Randall Ashbourne, author of the eBook, The Idiot and The Moon, and The Idiot and the Moon, Forecast 2013, writes a free weekly column titled, The Eye of Ra on his web site in  which he explains the potential impact of astrological aspects and the current state of technical conditions. Ashbourne's charts are revealing illustrations of exactly what has occurred in the market and the probability of what to expect.
Important reading:  Randall Ashbourne's The Idiot and The Moon, Forecast 2013 , Jupiter's cycle and its effects on Wall Street and a posting of the weekly Eye of Ra report in this blog, titled A look at the Venus Retrograde effect
(Disclaimer: This article is not advice or a recommendation to trade stocks; it is merely educational material.)
Copyright: Randall Ashbourne - 2011-2013

The Idiot and the Moon, Forecast 2013
  • Major trend change dates for the full year, plus a month-by-month breakdown of high-energy trading dates and critical reversal dates.

  • An index-by-index analysis of Moon Trading across major American, European, Asian and Australian stock indices-

  • Identifies the major indices where following the phases of the Moon can dramatically cut profits, or even result in large losses.

  • Old Gods & Gold ... a Eureka! discovery about exactly what drives gold prices during rallies and corrections and charts showing highly-reliable target levels to both the upside and downside.

These price charts are individually-tailored to each index and cover Wall Street, Australia, Canada, Hong Kong, Singapore, Shanghai, India, England, Germany and France.

You will not see these charts anywhere else on the Internet!

And much more...

It is NEVER too late in the year to have this monthly information!

Saturday, May 19, 2012

June 2012 Astrological Calendar - Transits for London, England, The FTSE

Astrological Calendar showing the day and times of planetary aspects for the FTSE, for the month of June, 2012.

June 2012 Astrological Calendar - Transits for London, England, The FTSE


Click image to view full size calendar.

Thursday, May 19, 2011

June 2011 Astrological Calendar - Transits for NY NY, The NYSE

Astrology calendar showing the day and times of planetary aspects for the NYSE, for the month of June, 2011.
June 2011 Astrological Calendar, planetary aspects for the NYSE
 Click image to view full size calendar.

Thursday, May 20, 2010

June 2010 Astrological Calendar - Transits for NY NY, The NYSE

Astrology calendar showing the day and times of planetary aspects for the
NYSE, for the month of June, 2010.
June 2010 Astrological Calendar - Transits for NY NY, The NYSE
Click image to view full size calendar.

June 2010 Astrological Calendar - Transits for London, England, The FTSE

Astrological Calendar showing the day and times of planetary aspects for the
FTSE, for the month of June, 2010.
June 2010 Astrological Calendar - Transits for London, England, The FTSE

Click image to view full size calendar.

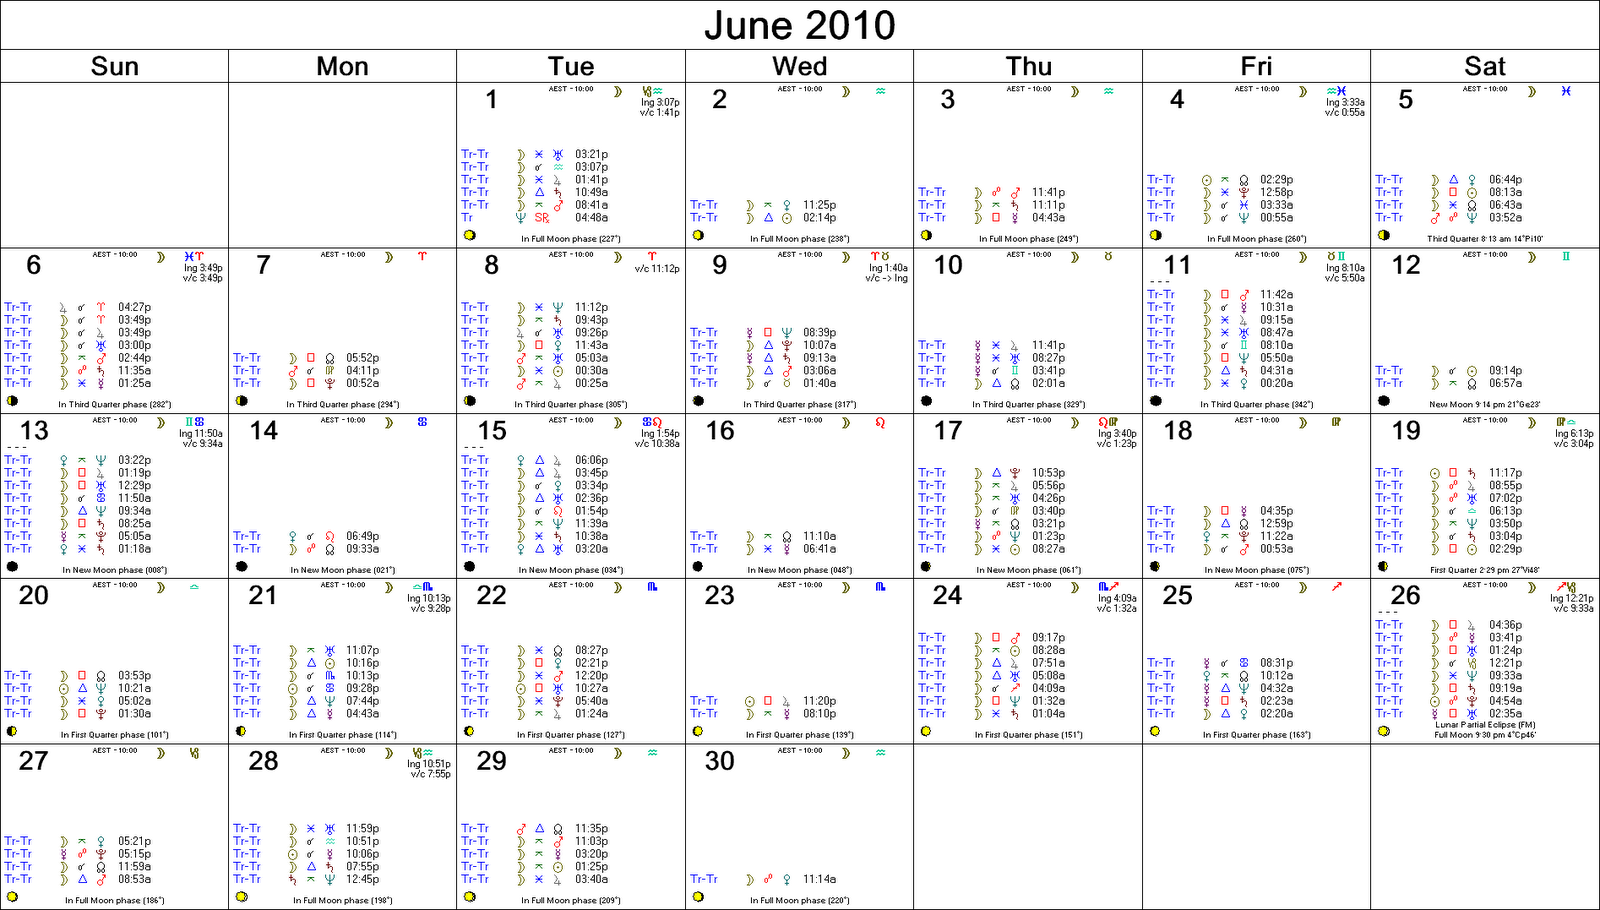
June 2010 Astrological Calendar - Transits for Sydney

Astrology calendar showing the day and times of planetary aspects for the
ASX, for the month of June, 2010.
June 2010 Astrological Calendar - Transits for Sydney, Australia, The ASX

Click image to view full size calendar.