Randall Ashbourne, an associate of
Astrological Investing, posts a weekly market report on his web site,
theidiotandthemoon.com The following is this weekend's Eye of RA report: Week beginning January 14, 2013
Most major markets paused for breath last week, unsure about pushing higher after the huge relief jump caused by "fixing" the fiscal cliff.
The small-range week coincided with an important sign change by Venus, moving out of optimistic Sagittarius and into pragmatic Capricorn.
Venus is the good time girl of the
Old Gods and takes on nuances of Jupiter, the great exaggerator, while in Sadge. But, if size matters, her only interest while in Cappytown is the size of ... your wallet.
She's now out of the zone of living on fun, fresh air and adventure; in Cappy, she wants to know your net worth, whether the mortgage has been paid off and what plans you have for making (her) future secure, stable ... and of an enviable social standing.
This weekend she begins setting off the ongoing Uranus/Pluto square - firstly by squaring Uranus and then, midweek, conjuncting Pluto.
And this as earnings season kicks into top gear. We will see all the money issues back in the spotlight, pretty much as we did with the agonising over the fiscal cliff as the Sun made the same aspects in late December.
Wednesday and Thursday will be the action days as we head towards the First Quarter Moon on Friday ... and with Jupiter changing from Retrograde motion to Direct.
We'll start to get back towards more normal programming this weekend, as we begin catching up on indices other than the SP500.
Though that is where we'll begin. I have started keeping manual charts for Pollyanna, since the New York Stock Exchange blatantly lies on a daily basis about the actual opening price of the day's trading. It's crooked, it's corrupt and it's designed to help the big boys at the expense of small traders.
The "official" figures don't show the huge gap which developed the day after the fiscal cliff deal was done.
 |
| Click image for larger view |
The index is now trying to breakout above the important 1468 level which has been marked on the 500's long-range planetary chart as an important barrier. It's a Neptune level shown on the chart above as a thick, grey line. Breakout this week gives the next target level in the 1480s range.
There is negative divergence happening in the oscillator, though it will not give a clear Sell signal until it drops below the +100 level, the higher, unbroken red line in the oscillator panel. Note the big gap - because, at some stage, it's going to be filled.
Our next chart is the Nasdaq 100 (NDX) Weekly Planets chart ...
 |
| Click image for larger view |
While the Pollyanna index finished the week just above an important planetary level, the NDX stalled at a Uranus line, leaving the danger of a potential head-and-shoulders pattern, which has the implication of a sharp downswing if it plays out. Breakout opens the targets at 2800 and 2895, while breakdown is unlikely to stop before 2649.
The MACD signal has gone to Buy mode, which is normally good for an intermediate rally. There is, however, some fairly substantial negative divergence building. While price is now roughly at the level it was in early 2012, the MACD signal line and histograms are substantially lower ... and that is coming on top of a lower MACD peak as the NDX hit new price highs last September.
Some caution is needed in continuing to maintain Long positions in the NDX, though it depends on how the index trades against the Uranus level in the coming week.
 |
| Click image for larger view |
North of the lakes, Toronto's capped 60 stalled out the week at a Saturn barrier. It, too, is showing divergence developing in the MACD.
As we saw on the NDX though, MACD divergence can build for a long time on these weekly charts. Toronto is stretching into price levels last visited in August 2011 and February 2012. The orange lines marked 805 and 814 are Uranians. You can see how influential they were at the past three lows in this index when the primary Uranus lines stopped the drops, albeit with one spike down into Neptune.
It probably means the index is on a Uranus-to-Uranus bounce.
 |
| Click image for larger view |
Across the pond, London's FTSE also topped out at a weekly Saturn and there's a chance it's on a run between Uranus/Pluto barriers. If so, it's heading to somewhere between the 6200s and 6400s before real trouble starts. Note, the FTSE has now leapt above the grey Neptune which acted as a staging area in 2010-2011.
It needs to continue holding above that line to increase the chances of hitting those higher Uranus/Pluto levels.
 |
| Click image for larger view |
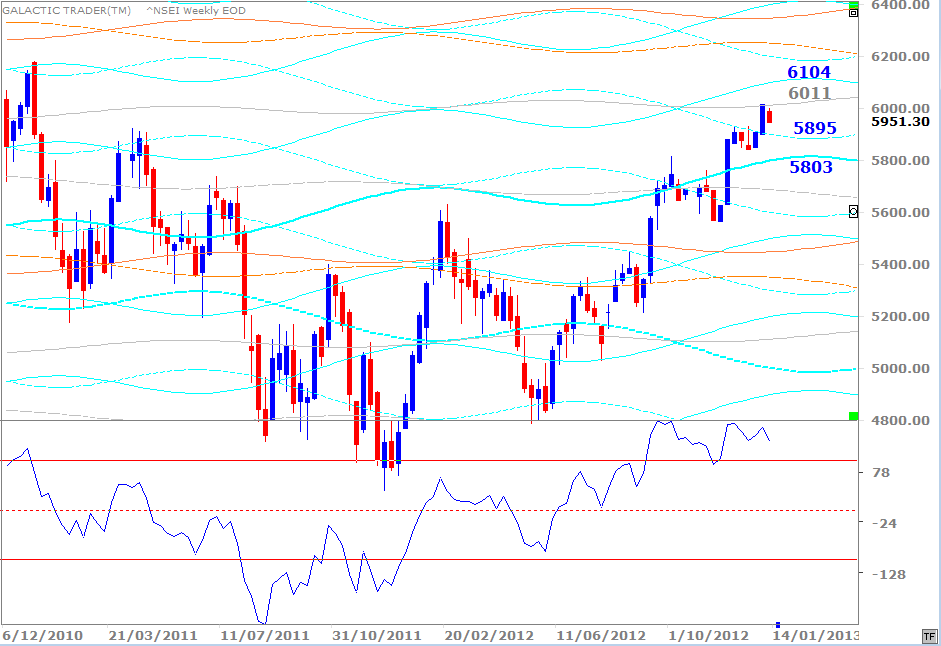
India's Nifty has run into at least temporary trouble breaking above a Neptune barrier currently priced at 6011. We have still-mild negative divergence in the oscillator, now showing its second lower peak after the initial high last October. It doesn't mean the index won't breakout ... but it is a warning sign of internal weakening in the index.
Holding the high 5800s on any short-term correction would increase the chances of breaking out above the Neptune line, with a target in the likely range from 6200 to 6400.
 |
| Click image for larger view |
Major Asian markets continue to respond to the apparent turnaround in Chinese markets, with the Straits Times Index, of Singapore, still heading for the 3300s, the Neptune line which stopped the previous rebound highs. It found support last week at a Saturn, price at 3196 for the week ahead.
 |
| Click image for larger view |
We began discussing a potential bottom forming in the Shanghai Composite last year and it certainly looks as if it's underway. Both oscillators have climbed higher than they've been since China went into Bearish mode early last year.
Two sets of long-range planet charts are published in Forecast 2013 for those traders interested in playing the Chinese market.
There's a clear technical line of Support/Resistance which has to be overcome on the chart above. It may not break the barrier immediately, but there are fairly clear cut signals from the oscillators that it's no longer a question of "if", but only "when".
At some stage in the later part of last year, I published some technical charts for the ASX 200 indicating that "logic" dictated Auntie was heading for the 4700s. She has arrived ... but may have even higher targets in mind.
There is virtually no divergence in the state of the oscillator - and until it occurs the only bears around are the Koalas trying to get out of the way of too many bushfires.
Thank you to everyone who has purchased Forecast 2013. The information should allow all of you to make some highly profitable trades over the course of the year, especially if you watch for a convergence of price hitting long-range targets around the time of the critical reversal dates listed in the month-by-month breakdown of the astrological weather.
Most of the downloads have gone off without a hitch. Still, a gremlin gets into the works occasionally. If you've bought the Forecast and haven't been able to download, drop me a line from the "Contact" link and I'll email it to you.
(
Contact Randall)
Slacker that I am, I haven't set up a 2013 Archives page yet ... so if you want to read last weekend's report,
Click Here.
Until next weekend ...
Safe trading - RA
Astrological Investing's associate, Randall Ashbourne, author of the eBook, The Idiot and The Moon, and The Idiot and the Moon, Forecast 2013, writes a free weekly column titled, The Eye of Ra
on his web site in which he explains the potential impact of
astrological aspects and the current state of technical conditions.
Ashbourne's charts are revealing illustrations of exactly what has
occurred in the market and the probability of what to expect.
Important reading: Randall Ashbourne's The Idiot and The Moon, Forecast 2013 , Jupiter's cycle and its effects on Wall Street and a posting of the weekly Eye of Ra report in this blog, titled A look at the Venus Retrograde effect
(Disclaimer: This article is not advice or a recommendation to trade stocks; it is merely educational material.)
Copyright: Randall Ashbourne - 2011-2013


 The Idiot and the Moon, Forecast 2013