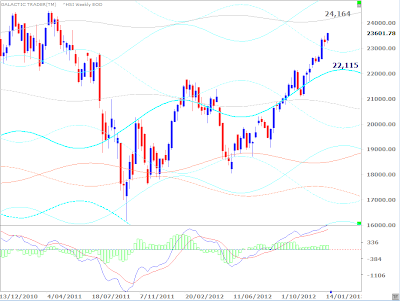
World stock indices are pushing higher as we head into a potential critical trend change date late this week or early next.
The Venus transit to the Uranus/Pluto square configuration has moved us from the cliff to the ceiling, with the Republicans planning to introduce a Bill this week to daub it with a little feel-good fresco to keep everyone on tenterhooks for another three months.
A lot of markets hit new multi-year highs last week ... and some did not.
And that was true intramarket as well as intermarket. The Dow Jones Transports and the SP500 ripped north, while the DJIA and the NDX remain below the level of last September's peaks.
Some other indices are running into planetary barriers; in some cases with positive signals from the oscillators and others displaying intermediate-term negative divergence.
Gold, so far, is playing by planetary prices and lunar phase trades detailed in Forecast 2013.
Last weekend, I published Weekly Planets Charts for the FTSE, TSX60, India's Nifty and Singapore's STI. We'll look at a different set this weekend. Go to the link button at the bottom of this edition if you need to refresh your memory on the price targets for those 4 indices.
I indicated last weekend that the 500 was basing on top of an important planetary price line at 1468 and that opened a new target in the 1480s.
 |
| click for larger image |
The Nasdaq 100, however, continues to display relative weakness ...
 |
| click for larger image |
This is the third week the NDX recovery has been stalled by a Uranus line and the danger remains the tech index is still forming the right shoulder of a H&S pattern with a sharp downside if it plays out.
Germany's DAX is one of the European indices which failed to breakout last week, though the reality is it actually made its breakout 7 weeks ago ... and is stalling at a very high level of recovery.
 |
| click for larger image |
The chart above shows the index within a double Neptune zone which was important during the topping process in 2007. Negative divergence in the fast MACD is obvious; not only are the signal peaks declining, but so is the height of the histogram peaks.
 |
| click for larger image |
 |
| click for larger image |
The CAC30 has made it through a Uranus zone and is trying to maintain strength on top of a Pluto/Saturn price zone. The critical target is probably the primary Neptune, currently priced in the 3880s. Trace that line back and you'll see a gap in the price bars.
The French index may be on a mission to fill it.
 |
| click for larger image |
The Hang Seng, of Hong Kong, had a good week. There is divergence in the height of the histograms, but nothing obvious in the MACD signal lines to get unduly concerned about for the moment.
 |
| click for larger image |
The ASX200, above, continues to behave in very predictable fashion. The price of that planetary line was listed last weekend as 4785 and the index went a tad above 4787 before backing off. I still haven't set up an Archives page for this year's old Eyes. Until I do, you can reach them from the dated links below.
Read January 14, 2013 report Click Here
Read January 7, 2013, Click Here.
Astrological Investing's associate, Randall Ashbourne, author of the eBook, The Idiot and The Moon, and The Idiot and the Moon, Forecast 2013, writes a free weekly column titled, The Eye of Ra on his web site in which he explains the potential impact of astrological aspects and the current state of technical conditions. Ashbourne's charts are revealing illustrations of exactly what has occurred in the market and the probability of what to expect.
Important reading: Randall Ashbourne's The Idiot and The Moon, Forecast 2013 , Jupiter's cycle and its effects on Wall Street and a posting of the weekly Eye of Ra report in this blog, titled A look at the Venus Retrograde effect
(Disclaimer: This article is not advice or a recommendation to trade stocks; it is merely educational material.)
Copyright: Randall Ashbourne - 2011-2013
 The Idiot and the Moon, Forecast 2013
Major trend change dates for the full year, plus a month-by-month breakdown of high-energy trading dates and critical reversal dates.
An index-by-index analysis of Moon Trading across major American, European, Asian and Australian stock indices-
Identifies the major indices where following the phases of the Moon can dramatically cut profits, or even result in large losses.
Old Gods & Gold ... a Eureka! discovery about exactly what drives gold prices during rallies and corrections and charts showing highly-reliable target levels to both the upside and downside.


0 comments:
Post a Comment
Note: Only a member of this blog may post a comment.