Showing posts with label Jupiter direct. Show all posts

Saturday, March 1, 2014

An Astrological Trip Around the New Moon in Pisces 2014

Astrological Investing New Moon forecasts show general trends and financial outlook for the month. The New Moon in Pisces, 2014 - Chart from the point of view of Wall Street and the NYSE. 

The
New Moon in Pisces, March 1, 2014

Chart from the point of view of Wall Street and the NYSE.
 If you're not confused, you're not paying attention.Tom Peters

This has been a season of not only extreme weather, but extremely unpredictable markets. So many planets changing direction! And there's more! On the day of the Pisces New Moon we find Mars stationing retrograde just the day after Mercury turned Direct, and then the next day, Saturn begins to station retrograde, and Jupiter changes direction on March 6!  Whew! With so many changes of direction we can only anticipate market confusion.

"Retrogrades cause confusion,"
wrote Randall Ashbourne in his Eye of RA report for the week of January 27. And he sure wasn't kidding!

Knowing the outlook for the lunar month can give only a broad picture of the potential astrological energy that may affect the market; however, knowing both astrology and technical analysis is your best bet for successful trading.  Randall Ashbourne's "Idiot Method" outlined in his eBook, The Idiot & the Moon, is the most successful approach to trading I have ever used.

The upcoming March Equinox Chart will set the astrological tone for the Spring season. I will send an announcement when my Equinox article will be available online.

 An Astrological Trip Around the New Moon in Pisces Chart
The New Moon (Sun/ Moon) brings matters of the second house to the forefront. Mercury and Neptune are in the second house as well. More importantly, however, the New Moon is trine Jupiter. This is very fortunate.

The New Moon in the second house in it's "natural influence, is beneficial to business, trade, the money market and financial affairs generally"(H.S. Green). Because is it aspected by a trine to Jupiter, it is even more beneficial.

Mercury in Aquarius is stationing Direct in the second house -
We always feel a sense of relief when Mercury stations direct - it is time to get back to business! Usually whatever havoc Mercury seemed to cause during it's retrograde phase has worked itself out. The market is about in the same situation (normally) as it was when the retrograde period started. However, this isn't a typical time with so many planets changing direction!

What we can count on, however, is that wherever Mercury is found in the New Moon chart we will experience a great deal of activity in the affairs of that house during the lunar month. This month there will be a concentration of discussions regarding finance and financial regulations, regulations connected to means of transit, and the Post Office. The stock market will react negatively if there are real (or false!) reports concerning problems in the banking sector.

Neptune in Pisces in the second house -
Fluctuations in the stock market and a failure to realize expectations may be the result of this Neptune placement. Even free from affliction, it is always uncertain how well the market can perform with Neptune in the second.

Saturn in Scorpio rules the rising sign of Capricorn in this chart. Because Saturn is the chart ruler, Saturn is especially influential this lunar month. This is good for stocks, national funds, investments, banking...but not because of growth or increase as in the case of Jupiter, but rather through method, and prudence.
To read the newsletter in its entirety Click to read newsletter

When reading the newsletter on the web site, be sure to take note of the Moon Phases section and get the "Head's Up" - upcoming astrological events list.

Understanding the potential of planetary cycles and what the technical charts tell us is our best bet for successful trading. We need to see the whole picture! I encourage all of you to look at the weekly technical charts by Randall Ashbourne (posted weekly on this blog).


***
FORECAST 2014, an eBook by Randall Ashbourne -
If you have been following the blog, or reading the Eye of Ra at, www.theidiotandthemoon.com, you already know by now that Randall makes what can be a very dry and difficult subject - Financial Astrology - easy to understand, quite interesting, and sometimes amusing! With his witty and wry sense of humor, Randall never holds back, giving us his experienced professional opinion on how the markets are performing.

His latest eBook The Idiot & The Moon, Forecast 2014 has predictions, price targets and trend change dates - it is the perfect companion to his book, The Idiot & The Moon, Compleat and Utter Idiot's Guide To Trading Stocks.

The Idiot and The Moon, FORECAST 2014 by Randall Ashbourne

NOTE: Planetary price targets for gold are contained in Forecast 2014 - as are the targets for the major stock indices.

Randall is working on a special report on gold which will include the exact timing of gold's most important transits for the year ahead. This report won't be published in his free weekend reports, but will be emailed to everyone who has bought a copy of Forecast 2014.

            FORECAST 2014 CHAPTERS INCLUDE
  • 2014 ... and let slip the dogs of war
  • Jupiter Square Uranus ... and the danger of déjà vu
  • Mars ... the mover of markets
  • Bradley Model - 2014 major and minor trend change dates
  • Moods of the Moon - Lunar phase trading performance in 2013
  • Month by Month - monthly astrological transits in time map form
  • Technical conditions and planetary price targets
***

13 months of Astrological Investing Calendars! - The monthly transit calendars published on the blog are available to purchase as a full 2014 calendar through January 31, 2015 - for New York, London and Sydney. Download these handy PDF calendars to your iPad, or other electronic reader and/or and phone, and of course, to your computer to read. (They are printable as well.)

Included are transit to transit aspects; dates of Moon Phases, Planets Stationing (changing directions) and Eclipses; and a schedule of open hours and days for each market, New York, London, and Australia.

These calendars can be purchased individually for $8.00, but all three are available for $16.00 Click to purchase.


Sunday, February 3, 2013

Mars/Neptune ... the highs and lows

Randall Ashbourne, an associate of Astrological Investing, posts a weekly market report on his web site, www.theidiotandthemoon.com The following is this weekend's Eye of RA report: Week beginning February 4, 2013
Wall Street's broad-based SP500 ... the Pollyanna index ... is now only a fistful of dollars away from contact with a planetary price line which topped out the two previous Bull peaks.
Chicken Little is in the wings, ready to take centre stage.

Last weekend, we looked at the potential for Sun square Saturn and Jupiter turning Direct to trigger the first major trend change date of 2013.

However, we also discussed the lunar phase in effect last week - FM-3Q - and I said: "So, expecting a major trend change to develop here does fly in the face of the 'normal' statistical tendency for many markets to rise strongly during this lunar phase. Last year, this phase was negative only 3 of the 12 times for the SP500."

This week's phase - 3Q-NM - was also strong last year, though the strength of the rallies varied dramatically between various world indices.

There are also two important astrological aspects this week which have a reasonably reliable track record of bringing on a shift in the market mood.

Mars changes signs to Pisces this weekend and will conjunct the sign's ruler, Neptune, as the trading week gets underway ... and there is a trine between the two benefics, Venus and Jupiter.

There is a general rule in astrological interpretation that the more infrequent the aspect, the stronger its impact will tend to be. Venus trines Jupiter a couple of times a year, but Mars conjuncts Neptune only once every couple of years.

The chart below shows the recent impacts of the two aspects ... with the Venus/Jupiter trines marked by the blue bars and the Mars/Neptune conjunctions displayed as red bars.

Click to view larger image
As we can see, the Mars/Neptune conjunctions are significant. Of the four previous instances shown on this chart, one occurred at the bottom of the Bear and two coincided, within a week, of a countertrend low during the Bull run into the 2007 top; with the 4th instance producing a temporary peak early in 2011.

The Venus/Jupiter trines are not quite as reliable as specific turn markers, but the impact is fairly regular - 8 of the 14 instances shown coincided closely with interim lows or highs.

Given the level the Pollyanna index is now approaching (details are within the Forecast 2013 document) and the statistical tendency for markets to produce a high heading into New Moon (next weekend), the two key astro aspects for the week may be enough to cue Chicken Little for a return to centre stage.
Click to view larger image

The positive pop on Friday finally managed to get the Nasdaq 100, NDX, closing above the Uranus line which has stalled its advance for the past month. It is not yet enough, however, to rule out the possibility the index is forming the right shoulder of a negative pattern with considerable downside in the intermediate term.
Click to view larger image

Germany's DAX is attempting to consolidate on top of the Neptune line it finally broke above the previous week. Weakness continues to build in the fast MACD. The peaks of both the signal lines and the histograms are falling as price continues to rise.
Click to view larger image
France's CAC40, above, remains stalled at a weekly Saturn level. Those of you who have the Forecast might want to consult the table on Page 20 and consider how this index varied from some others last year in terms of its 3Q-NM performance.
Click to view larger image

Hong Kong hasn't made a lot of progress in the past couple of weeks, but is still heading for the Neptune line at 24,220. There is negative divergence in the height of the MACD histograms, but not in the peak of the signal lines.
Click to view larger image

The ASX 200 had a couple of strong days within its shortened week, closing slightly above the weekly planetary barrier at 4911ish. There is no negative divergence current in the state of the oscillator, so the probability is we have not seen the 2013 peak in this index yet, either. Overall then ... we have the potential for weakness to start developing as indices begin pushing against major, long-term resistance, but at this stage there are no alarm bells suggesting anything other than a pause or intermediate-level correction is coming due.

Safe trading - RA

                                                                     Read January 28, 2013 report on The Eye of RA  Click here
                                                                     Read January 21, 2013 report on The Eye of RA  Click Here

Randall Ashbourne
Astrological Investing's associate, Randall Ashbourne, author of the eBook, The Idiot and The Moon, and The Idiot and the Moon, Forecast 2013, writes a free weekly column titled, The Eye of Ra on his web site in  which he explains the potential impact of astrological aspects and the current state of technical conditions. Ashbourne's charts are revealing illustrations of exactly what has occurred in the market and the probability of what to expect.
Important reading:  Randall Ashbourne's The Idiot and The Moon, Forecast 2013 , Jupiter's cycle and its effects on Wall Street and a posting of the weekly Eye of Ra report in this blog, titled A look at the Venus Retrograde effect
(Disclaimer: This article is not advice or a recommendation to trade stocks; it is merely educational material.)
Copyright: Randall Ashbourne - 2011-2013

The Idiot and the Moon, Forecast 2013
  • Major trend change dates for the full year, plus a month-by-month breakdown of high-energy trading dates and critical reversal dates.

  • An index-by-index analysis of Moon Trading across major American, European, Asian and Australian stock indices-

  • Identifies the major indices where following the phases of the Moon can dramatically cut profits, or even result in large losses.

  • Old Gods & Gold ... a Eureka! discovery about exactly what drives gold prices during rallies and corrections and charts showing highly-reliable target levels to both the upside and downside.

These price charts are individually-tailored to each index and cover Wall Street, Australia, Canada, Hong Kong, Singapore, Shanghai, India, England, Germany and France.

You will not see these charts anywhere else on the Internet!

And much more...


Saturday, January 26, 2013

2013's first major trend change date

Randall Ashbourne, an associate of Astrological Investing, posts a weekly market report on his web site, theidiotandthemoon.com The following is this weekend's Eye of RA report: Week beginning January 28, 2013

Sun square Saturn / Jupiter Stationing Direct, Jan 30, 2013
This week kicks off with a critical reversal date, the first for 2013.

The Bradley Model roadmap for the year suggests that whatever starts this week won't undergo another major change of direction until the later part of June.

Triggers for the potential change are the Sun making a square aspect with Saturn and Jupiter shifting to Direct from Retrograde.

In a moment, we'll take a look at the track record of both these events, due to occur on Wednesday, NY time. While many markets have been rising steadily into this timeframe, it would be unusual - statistically - for them to top out going into the Full Moon.

The FM-3Q period, which covers all of the coming week, is normally a relatively strong rally period.

Those of you who have access to Forecast 2013 will know that last year, many of the world's top stock indices put on most of their gains during this 7-day lunar phase.

The SP500 put on 7% during the FM-3Q periods; India's Nifty, Germany's DAX and Hong Kong's Hang Seng rose 19%, 18% and 17% respectively; Singapore rose 12% and the ASX200 put on 10%, which was almost its total gain for 2012.

So, expecting a major trend change to develop here does fly in the face of the "normal" statistical tendency for many markets to rise strongly during this lunar phase. Last year, this phase was negative only 3 of the 12 times for the SP500.

Let's take a look at past performance of Jupiter going Direct and the Sun squaring off with Saturn ...

We'll use a weekly chart of Pollyanna, the SP500 - with the arrowed blue bars showing the weeks Jupiter changed to Direct and the red bars the weeks in which the Sun squared Saturn.

Of the past 6 Jupiter signatures, three came in nearby significant lows and the others led to a downturn for at least a few weeks. Of the 14 Sun/Saturn squares, 4 produced intermediate tops.

The combined strength of the two signatures, happening on the same day this week and with some negative reinforcement from Mars making a parallel aspect with Saturn, is enough to cause a trend change.

But, even if it does happen, I have some doubts that it will continue all the way to late June. And that's because my big Canary is still warbling sweetly.
Click image for larger view

Note that the oscillator has hit a new peak in line with the higher price of the SP500 weekly. In brief, no negative divergence warning.

It means, under normal circumstances, that we have not yet seen the index hit its highs for the year. It is, of course, now within a few dollars of one of the major planetary price levels which should cause a downwards reaction ... and there is resistance overhead from a channel line.
Click image for larger view

The Nasdaq 100, NDX, still can't close above the Uranus barrier which has blocked its rise for the past month ... still leaving the potential to form the right shoulder of a negative pattern. If you're trading the Nasdaq, it would be worth keeping a close eye on that level, as well as consulting the Moon Trading results on Page 24 of the Forecast.

Across the lakes ..
Click image for larger view

Canada's TSX60 (capped) continues its rise. This appears to be a Uranus-to-Uranus zone bounce and stalling here would not be a surprise. The current height of the histograms is a tad negative, even though the MACD signal lines are strong. As with Pollyanna, though, Toronto probably has higher prices as its target over the course of the year.

London is next ..
Click image for larger view

When I last published this chart for the January 14 edition, the FTSE was sitting at 6101 and I said: " ...there's a chance it's on a run between Uranus/Pluto barriers. If so, it's heading to somewhere between the 6200s and 6400s before real trouble starts."

It's now well inside that zone ... and with no warning klaxons going off in the fast MACD.

Mumbai...
Click image for larger view

India's Nifty hasn't done much since we last looked at its Weekly Planets chart, still testing the validity of a Neptune level. The oscillator is showing signs of negative divergence, but there is little reason to be unduly concerned while price holds the Neptune line and the Canary maintains itself above the +100 upper red line in the indicator panel.

 Singapore ...
Click image for larger view
The Straits Times Index still appears to be engaged in a run to Neptune in the low 3300s. The MACD histograms are making progressively lower peaks, though the signal line is strong. This Neptune has stopped the STI twice before and the index is unlikely to breakout strongly above it, without first retesting the support levels of the Saturn lines.

Australia ...
Click image for larger view

No oscillator divergence; the Canary is happy singing away. Happy Australia Day!

Safe trading - RA

Read January 21, 2013, Click Here.

Randall Ashbourne
Astrological Investing's associate, Randall Ashbourne, author of the eBook, The Idiot and The Moon, and The Idiot and the Moon, Forecast 2013, writes a free weekly column titled, The Eye of Ra on his web site in  which he explains the potential impact of astrological aspects and the current state of technical conditions. Ashbourne's charts are revealing illustrations of exactly what has occurred in the market and the probability of what to expect.
Important reading:  Randall Ashbourne's The Idiot and The Moon, Forecast 2013 , Jupiter's cycle and its effects on Wall Street and a posting of the weekly Eye of Ra report in this blog, titled A look at the Venus Retrograde effect
(Disclaimer: This article is not advice or a recommendation to trade stocks; it is merely educational material.)
Copyright: Randall Ashbourne - 2011-2013

The Idiot and the Moon, Forecast 2013
  • Major trend change dates for the full year, plus a month-by-month breakdown of high-energy trading dates and critical reversal dates.

  • An index-by-index analysis of Moon Trading across major American, European, Asian and Australian stock indices-

  • Identifies the major indices where following the phases of the Moon can dramatically cut profits, or even result in large losses.

  • Old Gods & Gold ... a Eureka! discovery about exactly what drives gold prices during rallies and corrections and charts showing highly-reliable target levels to both the upside and downside.

These price charts are individually-tailored to each index and cover Wall Street, Australia, Canada, Hong Kong, Singapore, Shanghai, India, England, Germany and France.

You will not see these charts anywhere else on the Internet!

And much more...


Sunday, January 20, 2013

On countdown for a trend change

Randall Ashbourne, an associate of Astrological Investing, posts a weekly market report on his web site, theidiotandthemoon.com The following is this weekend's Eye of RA report: Week beginning January 21, 2013
World stock indices are pushing higher as we head into a potential critical trend change date late this week or early next.

The Venus transit to the Uranus/Pluto square configuration has moved us from the cliff to the ceiling, with the Republicans planning to introduce a Bill this week to daub it with a little feel-good fresco to keep everyone on tenterhooks for another three months.

A lot of markets hit new multi-year highs last week ... and some did not.

And that was true intramarket as well as intermarket. The Dow Jones Transports and the SP500 ripped north, while the DJIA and the NDX remain below the level of last September's peaks.

Some other indices are running into planetary barriers; in some cases with positive signals from the oscillators and others displaying intermediate-term negative divergence.

Gold, so far, is playing by planetary prices and lunar phase trades detailed in Forecast 2013.

Last weekend, I published Weekly Planets Charts for the FTSE, TSX60, India's Nifty and Singapore's STI. We'll look at a different set this weekend. Go to the link button at the bottom of this edition if you need to refresh your memory on the price targets for those 4 indices.

I indicated last weekend that the 500 was basing on top of an important planetary price line at 1468 and that opened a new target in the 1480s.
click for larger image
A late rush on Friday pushed the 500 right into the 1480s range and may have overstepped the mark by breaking a key Mars line. I said last week the key action days were likely to be Wednesday and Thursday ... and Thursday brought another Open gap, the second time in the past three weeks that the big boys' computers have forced up prices in the overnight session.

The Nasdaq 100, however, continues to display relative weakness ...
click for larger image

This is the third week the NDX recovery has been stalled by a Uranus line and the danger remains the tech index is still forming the right shoulder of a H&S pattern with a sharp downside if it plays out.

Germany's DAX is one of the European indices which failed to breakout last week, though the reality is it actually made its breakout 7 weeks ago ... and is stalling at a very high level of recovery.

click for larger image

The chart above shows the index within a double Neptune zone which was important during the topping process in 2007. Negative divergence in the fast MACD is obvious; not only are the signal peaks declining, but so is the height of the histogram peaks.


click for larger image
The chart above provides more detail. The Neptune zone now extends from 7480 to 7814. Saturn lines are underpinning the declines ... so far ... but the DAX is having trouble breaking above the Neptune level.


click for larger image

The CAC30 has made it through a Uranus zone and is trying to maintain strength on top of a Pluto/Saturn price zone. The critical target is probably the primary Neptune, currently priced in the 3880s. Trace that line back and you'll see a gap in the price bars.

The French index may be on a mission to fill it.
click for larger image

The Hang Seng, of Hong Kong, had a good week. There is divergence in the height of the histograms, but nothing obvious in the MACD signal lines to get unduly concerned about for the moment.


click for larger image

The ASX200, above, continues to behave in very predictable fashion. The price of that planetary line was listed last weekend as 4785 and the index went a tad above 4787 before backing off. I still haven't set up an Archives page for this year's old Eyes. Until I do, you can reach them from the dated links below.

Read January 14, 2013 report Click Here
Read January 7, 2013, Click Here.

Randall Ashbourne
Astrological Investing's associate, Randall Ashbourne, author of the eBook, The Idiot and The Moon, and The Idiot and the Moon, Forecast 2013, writes a free weekly column titled, The Eye of Ra on his web site in  which he explains the potential impact of astrological aspects and the current state of technical conditions. Ashbourne's charts are revealing illustrations of exactly what has occurred in the market and the probability of what to expect.
Important reading:  Randall Ashbourne's The Idiot and The Moon, Forecast 2013 , Jupiter's cycle and its effects on Wall Street and a posting of the weekly Eye of Ra report in this blog, titled A look at the Venus Retrograde effect
(Disclaimer: This article is not advice or a recommendation to trade stocks; it is merely educational material.)
Copyright: Randall Ashbourne - 2011-2013

The Idiot and the Moon, Forecast 2013
  • Major trend change dates for the full year, plus a month-by-month breakdown of high-energy trading dates and critical reversal dates.

  • An index-by-index analysis of Moon Trading across major American, European, Asian and Australian stock indices-

  • Identifies the major indices where following the phases of the Moon can dramatically cut profits, or even result in large losses.

  • Old Gods & Gold ... a Eureka! discovery about exactly what drives gold prices during rallies and corrections and charts showing highly-reliable target levels to both the upside and downside.

These price charts are individually-tailored to each index and cover Wall Street, Australia, Canada, Hong Kong, Singapore, Shanghai, India, England, Germany and France.

You will not see these charts anywhere else on the Internet!

And much more...


Saturday, January 12, 2013

Venus swaps blue jeans for cashmere

Randall Ashbourne, an associate of Astrological Investing, posts a weekly market report on his web site, theidiotandthemoon.com The following is this weekend's Eye of RA report: Week beginning January 14, 2013
Most major markets paused for breath last week, unsure about pushing higher after the huge relief jump caused by "fixing" the fiscal cliff.

The small-range week coincided with an important sign change by Venus, moving out of optimistic Sagittarius and into pragmatic Capricorn.

Venus is the good time girl of the Old Gods and takes on nuances of Jupiter, the great exaggerator, while in Sadge. But, if size matters, her only interest while in Cappytown is the size of ... your wallet.

She's now out of the zone of living on fun, fresh air and adventure; in Cappy, she wants to know your net worth, whether the mortgage has been paid off and what plans you have for making (her) future secure, stable ... and of an enviable social standing.

This weekend she begins setting off the ongoing Uranus/Pluto square - firstly by squaring Uranus and then, midweek, conjuncting Pluto.

And this as earnings season kicks into top gear. We will see all the money issues back in the spotlight, pretty much as we did with the agonising over the fiscal cliff as the Sun made the same aspects in late December.

Wednesday and Thursday will be the action days as we head towards the First Quarter Moon on Friday ... and with Jupiter changing from Retrograde motion to Direct.

We'll start to get back towards more normal programming this weekend, as we begin catching up on indices other than the SP500.

Though that is where we'll begin. I have started keeping manual charts for Pollyanna, since the New York Stock Exchange blatantly lies on a daily basis about the actual opening price of the day's trading. It's crooked, it's corrupt and it's designed to help the big boys at the expense of small traders.

The "official" figures don't show the huge gap which developed the day after the fiscal cliff deal was done.


Click image for larger view
The index is now trying to breakout above the important 1468 level which has been marked on the 500's long-range planetary chart as an important barrier. It's a Neptune level shown on the chart above as a thick, grey line. Breakout this week gives the next target level in the 1480s range.

There is negative divergence happening in the oscillator, though it will not give a clear Sell signal until it drops below the +100 level, the higher, unbroken red line in the oscillator panel. Note the big gap - because, at some stage, it's going to be filled.

Our next chart is the Nasdaq 100 (NDX) Weekly Planets chart ...
Click image for larger view
While the Pollyanna index finished the week just above an important planetary level, the NDX stalled at a Uranus line, leaving the danger of a potential head-and-shoulders pattern, which has the implication of a sharp downswing if it plays out. Breakout opens the targets at 2800 and 2895, while breakdown is unlikely to stop before 2649.

The MACD signal has gone to Buy mode, which is normally good for an intermediate rally. There is, however, some fairly substantial negative divergence building. While price is now roughly at the level it was in early 2012, the MACD signal line and histograms are substantially lower ... and that is coming on top of a lower MACD peak as the NDX hit new price highs last September.

Some caution is needed in continuing to maintain Long positions in the NDX, though it depends on how the index trades against the Uranus level in the coming week.

Click image for larger view
North of the lakes, Toronto's capped 60 stalled out the week at a Saturn barrier. It, too, is showing divergence developing in the MACD.

As we saw on the NDX though, MACD divergence can build for a long time on these weekly charts. Toronto is stretching into price levels last visited in August 2011 and February 2012. The orange lines marked 805 and 814 are Uranians. You can see how influential they were at the past three lows in this index when the primary Uranus lines stopped the drops, albeit with one spike down into Neptune.

It probably means the index is on a Uranus-to-Uranus bounce.

Click image for larger view
Across the pond, London's FTSE also topped out at a weekly Saturn and there's a chance it's on a run between Uranus/Pluto barriers. If so, it's heading to somewhere between the 6200s and 6400s before real trouble starts. Note, the FTSE has now leapt above the grey Neptune which acted as a staging area in 2010-2011.

It needs to continue holding above that line to increase the chances of hitting those higher Uranus/Pluto levels.
Click image for larger view
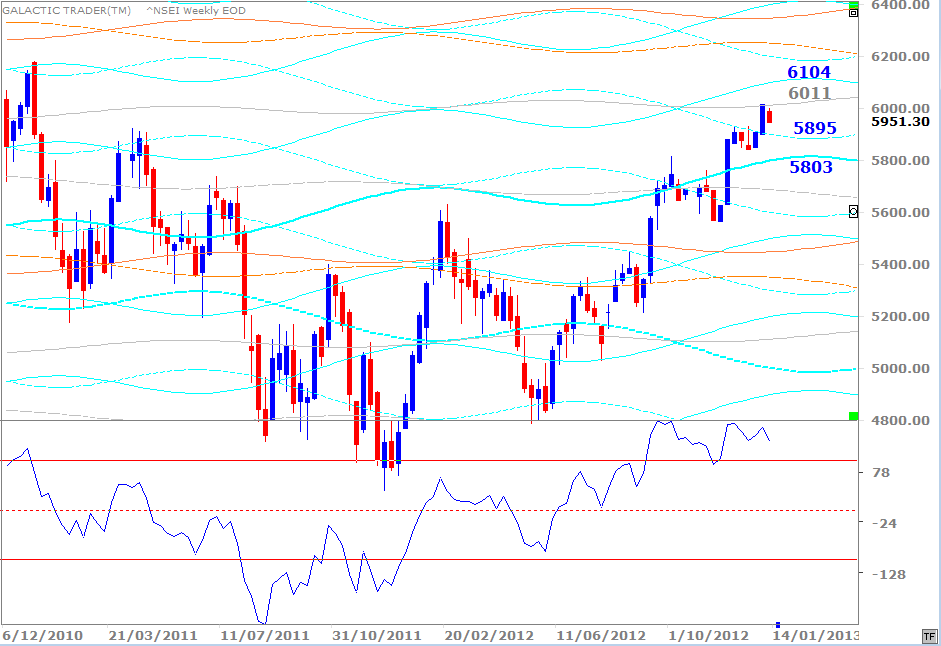
India's Nifty has run into at least temporary trouble breaking above a Neptune barrier currently priced at 6011. We have still-mild negative divergence in the oscillator, now showing its second lower peak after the initial high last October. It doesn't mean the index won't breakout ... but it is a warning sign of internal weakening in the index.

Holding the high 5800s on any short-term correction would increase the chances of breaking out above the Neptune line, with a target in the likely range from 6200 to 6400.


Click image for larger view
Major Asian markets continue to respond to the apparent turnaround in Chinese markets, with the Straits Times Index, of Singapore, still heading for the 3300s, the Neptune line which stopped the previous rebound highs. It found support last week at a Saturn, price at 3196 for the week ahead.


Click image for larger view
We began discussing a potential bottom forming in the Shanghai Composite last year and it certainly looks as if it's underway. Both oscillators have climbed higher than they've been since China went into Bearish mode early last year.

Two sets of long-range planet charts are published in Forecast 2013 for those traders interested in playing the Chinese market.

There's a clear technical line of Support/Resistance which has to be overcome on the chart above. It may not break the barrier immediately, but there are fairly clear cut signals from the oscillators that it's no longer a question of "if", but only "when".


At some stage in the later part of last year, I published some technical charts for the ASX 200 indicating that "logic" dictated Auntie was heading for the 4700s. She has arrived ... but may have even higher targets in mind.

There is virtually no divergence in the state of the oscillator - and until it occurs the only bears around are the Koalas trying to get out of the way of too many bushfires.


Thank you to everyone who has purchased Forecast 2013. The information should allow all of you to make some highly profitable trades over the course of the year, especially if you watch for a convergence of price hitting long-range targets around the time of the critical reversal dates listed in the month-by-month breakdown of the astrological weather.

Most of the downloads have gone off without a hitch. Still, a gremlin gets into the works occasionally. If you've bought the Forecast and haven't been able to download, drop me a line from the "Contact" link and I'll email it to you. (Contact Randall)

Slacker that I am, I haven't set up a 2013 Archives page yet ... so if you want to read last weekend's report, Click Here.

Until next weekend ... Safe trading - RA

Randall Ashbourne
Astrological Investing's associate, Randall Ashbourne, author of the eBook, The Idiot and The Moon, and The Idiot and the Moon, Forecast 2013, writes a free weekly column titled, The Eye of Ra on his web site in  which he explains the potential impact of astrological aspects and the current state of technical conditions. Ashbourne's charts are revealing illustrations of exactly what has occurred in the market and the probability of what to expect.
Important reading:  Randall Ashbourne's The Idiot and The Moon, Forecast 2013 , Jupiter's cycle and its effects on Wall Street and a posting of the weekly Eye of Ra report in this blog, titled A look at the Venus Retrograde effect
(Disclaimer: This article is not advice or a recommendation to trade stocks; it is merely educational material.)
Copyright: Randall Ashbourne - 2011-2013

Wednesday, October 14, 2009

Jupiter Direct Dow 10,000

Jupiter officially turned direct early in the morning of October 13, 2009.

The Dow officially ended October 14, 2009 above 10,000 the first time since October 2008.  

Jupiter direct usually pushes the markets up five days before until about five days after direct motion.  The markets will then flatten out as they will get confused when Saturn changes signs on October 29. 

Jupiter stations at 17 degrees Aquarius for several days, picks up speed and by January 18, 2010 moves into the sign Pisces. Last chance to get old tech toys.  New ones or lots of upgrades will hit the markets Fall 2010. 

Gadgets are on Sale
Aquarius rules technology therefore consumers who were guarded in their enthusiasm for the current crop of gadgets that plug into the grid will release their guard and become enthusiastic bargain hunters.  There will be an abundant supply of these products for sale and you can expect deep discounts on most products described at electronics. 

Jupiter also produces an abundant supply of products ruled by the opposite sign Leo. Leo rules products under the Leisure sector. If you need a vacation be sure to sign up for a cruise or a spa or a resort before January.  

Jupiter Squared
In The TextBook for Financial Astrology  3 I talk about the phenomena of Jupiter squared. Whatever sign is square to sign Jupiter is currently transiting will have a demand for their products. 

Taurus squares Aquarius and the sectors ruled by Taurus are agriculture and banks (loans) Scorpio is also square Aquarius and rules insurance, death and taxes. I know taxes are in short supply but not sure how that translates into a product that is for sale. Insurance is selling for higher premiums because of the uncertain value of currency. 

Start Thinking Pisces
Jupiter at 17 Aquarius is the point where the Jupiter square effect begins.  Jupiter will move 13 degrees before it starts its transit of Pisces. Now is the time to begin to research the various sectors ruled by Pisces. Investors Business Daily lists stocks by sectors.  Some Pisces sectors are Energy, Chemicals, Alcohol and Tobacco. The question then is which one of the stocks on their list is best of breed and/or set to take advantage of an abundant supply of their product. For example will BUD or TAP win the sales growth wars?

Jupiter will transit Pisces throughout 2010 and the opposite sign is Virgo. One sector ruled by Virgo is medical supplies. Is J&J the best of breed? 

Ok lets go to the sectors that promise to increase in price because they lack supply and are in demand by the cash carrying public. Gemini sectors are Telecom and Transportation and Sagittarius sectors are Aerospace and Media.

Turn on your Research Mouse
The next difficult planetary aspect is Saturn square Pluto on November 15 and this one aspect tends to stress political events. However it can present a buying opportunity if you have done your research and patiently wait for just the right price. Besides Investors Business Daily and Yahoo Financial you might narrow your list of stocks even further with a trial subscription toGrace Morris's Newsletter.