Showing posts with label Venus aspects to Uranus and Pluto. Show all posts

Saturday, August 2, 2014

Reviewing a few price targets

Randall Ashbourne, an associate of Astrological Investing, posts a weekly market report on his web site, theidiotandthemoon.com  The following is this weekend's Eye of RA report: Week beginning August 4,  2014 

Major stock indices went into meltdown mode last week as the money planet, Venus, fired up the long-running Uranus square with Pluto.

There is likely to be some relief from the pressure this week as Mars makes a trine with Neptune and the Sun trines Uranus.

The Moon enters Sagittarius on Tuesday and we should probably be prepared for a couple of wide-range days.

The Moon is symbolic of the public mood and Sadge exaggerates either the fear, or the optimism.

As we go into next weekend, both Mercury and the Sun will square Saturn, coinciding with the statistical low period of the Full Moon.

August can be a nasty month for stock prices, as it was in 2007 and again in 2011. But, both of those were spike Lows, with strong bouncebacks.

I indicated last weekend that the Dow Jones Industrials had fired a warning shot and the German DAX looked to be in dive mode, so there was "clear and present danger" in the markets.

It pretty much turned out that way for most of the Western indices, so let's begin this weekend by going back to the DJI chart I said then was really the only stock chart of much importance.

It was then, and remains still, a fairly basic chart with one blue uptrend line and a red horizontal price level. The daily uptrend since the early-February low is now severely broken.

The January slide wiped nearly $1250 off the price of the Dow and the decline last week has taken a $714 bite. Now remember that the high at the end of December and the mid-July high were both listed as major Bradley turn dates.


The other point I want to emphasise about the above chart is the depth to which the Big Bird oscillator has dived ... fractionally lower than it did during the drop at the start of 2014. If normalcy prevails, it's an indication the current drop has further to go.

And I think that's probably endorsed by the next chart, the DJI's weekly, starting with the major Low in 2011. Again, it's a simple chart using just a couple of techniques from The Technical Section of The Idiot & The Moon; I'm really not a fan of complicated charts.

And we have another trendline break. The Dow has closed below the lowest channel marker for the first week since this rally phase started.


I had this chart marked with three important horizontal levels and the DJI finished last week trying to stay on top of the highest of those markers.

But, as with the daily, we have had a long build-up of negative divergence in the Big Bird oscillator. In fact, the 50CCI made its highest peak back in March 2013.

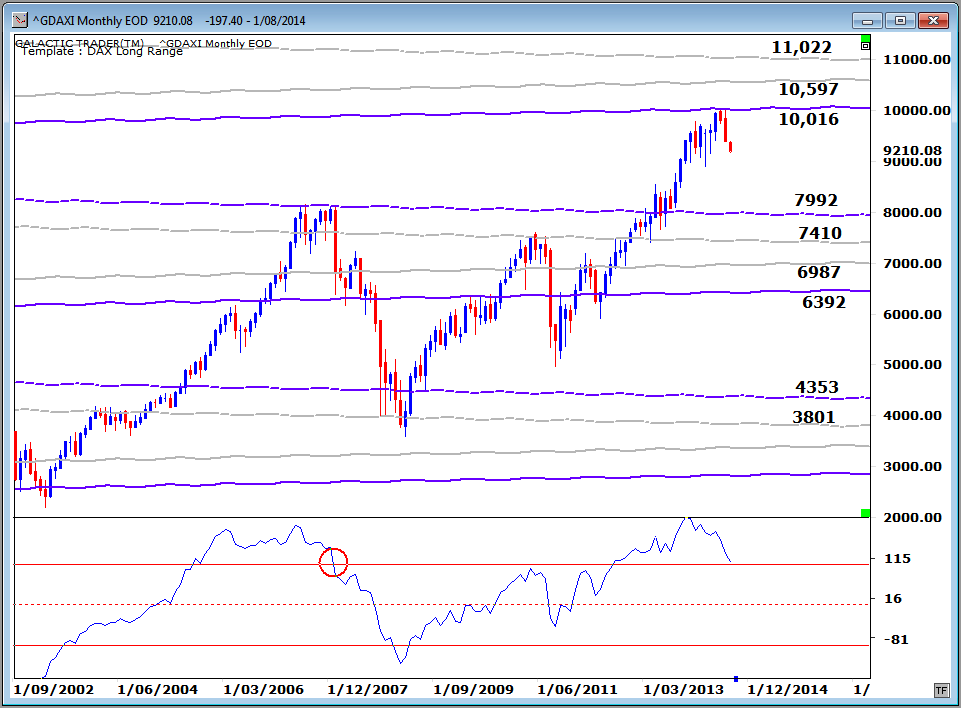
We'll go to Pollyanna's long-range planetary price chart in a moment, but have a quick look at the DAX first. That Pluto level in the early 10,000s clearly provided massive Resistance, just as the lower Pluto level did during formation of the 2007 top in the market.

Monthly Big Bird on the DAX is now getting dangerously close to losing its Bull market status. Once the oscillator loses the top red line in the oscillator panel, we can be pretty sure the big bad Bear is back.

Back to New York now and the current state of the SP500, where Pollyanna swapped her party frock for her Chicken Little outfit. The index has now lost both the Node level at $1957 and the Mars channel line, priced around $1944 for the week ahead.

Remember this is a long-range planetary price chart for the index. On the daily charts, the 500 has dropped into a zone where it could now receive a boost from rising inner planet price lines determined by the Sun, Mercury and Venus.


I didn't show you the ASX200's Weekly Planets chart last weekend, so here's the update. After the breakout above the Saturn/Uranus barrier in the 5560s, Auntie made a dash for the Neptune level in the 5600s ... and then joined the general swoon.

I indicated last weekend that if the breakout is the real deal "the negative period between New Moon and Full Moon should not cause major damage". So far, this isn't major damage. If the index can stay on top of the old Saturn resistance at 5530 by the end of this week, the old bat might just start a multi-hundred point run north.

And if she can't hold, she'll fall into a planetary price hole with no real support until several hunded dollars lower.


Gold. Yeah, yeah. Yada, yada. Waffle. Piffle. Drivel. Look, I don't give a rat's about the daily jerkarounds. One chart. Simple. Price has climbed back into and is consolidating within the upper, lower level of the monthly Bi-BBs. Both the MACD signal line and histograms are climbing. Put in your loss stops to protect your capital and go pour yourself a large gin. Sabbai, sabbai. Tidak apa apa.


Safe trading - RA

Randall Ashbourne (Disclaimer: This article is not advice or a recommendation to trade stocks; it is merely educational material.)
Copyright: Randall Ashbourne - 2011-2014


Astrological Investing's associate, Randall Ashbourne, author of the eBook, The Idiot and The Moon, and The Idiot and the Moon, Forecast 2014, writes a free weekly column titled, The Eye of Ra on his web site in  which he explains the potential impact of astrological aspects and the current state of technical conditions. Ashbourne's charts are revealing illustrations of exactly what has occurred in the market and the probability of what to expect.


Important reading:  Randall Ashbourne's The Idiot and The Moon, Forecast 2014  


  Purchase Forecast 2014 and receive a special report on GOLD  

Saturday, June 15, 2013

The bounce in stocks ... and Asian indices

Randall Ashbourne, an associate of Astrological Investing, posts a weekly market report on his web site, theidiotandthemoon.com The following is this weekend's Eye of RA report: Week beginning June17, 2013
Jupiter energy takes centre stage this week
 Jupiter energy takes centre stage this week, when the fires of optimism will be stoked again ... or the fear will be.

Last weekend, we reviewed where we were within the correction and I indicated Venus was making two aspects we needed to watch closely.

I said: "So, the Friday bounce could be short-lived. We need to pay close attention to price reaction on Tuesday and Wednesday when Venus opposes Pluto and squares Uranus."

That was the timing for Europe and America. The aspects were in play on Wednesday/Thursday in Asia - and most Asian indices, including Australia, produced a classic turnaround bar on Thursday and bounced strongly into the week's end.

Whether the bounce produces anything more than a blip will depend on the reaction to this week's conjunction between the Sun and Jupiter. This is a once-a-year event. Symbolically, it represents a peaking of growth energy and packs enough oomph to cause an intermediate change in trend.

It's also the week when a major Bradley Model trend turn date is due and the Sun will leave volatile Gemini for the security of Cancer. As one of the Cardinal signs, Cancer is an "action" sign ... and it is where the action is geared almost solely towards protection of all those things which make us feel secure, safe and comfortable.

We'll review the status of the correction this weekend and the Weekly Planets charts for Asian indices.

At a glance, the correction on Wall Street still seems to be too shallow, in terms of both Price and Time, to be realistic - especially considering the rapid, steep declines in most other major indices.

Yet, technically, the SP500 remains in its uptrend channel. The Venus aspects to Uranus and Pluto produced another drop to again retest the validity of the lower channel trendline. We'll be in the lunar phase between the 1Q Moon and Full Moon, which tends to be statistically negative.
click for larger image
At this stage, however, Pollyanna is not only holding the rally channel in play since last November, but remains within the upper level of a long-term channel based at the 2009 Bear bottom. In other words, it's still Bullish.

The index is still rising in a sharp angle within that broader channel and the long-range Canary in the oscillator panel has not lost the upper red level which would indicate a major correction is underway.
click for larger image
This has not been the case with many other stock indices, most of which entered a major correction more than a month ago. Last weekend, I indicated those indices had reached potential bounce levels. The drops continued into the Venus aspects, but the delayed bounce was exceptionally strong.

We'll use the ASX200 Weekly Planets chart I've featured a couple of times in past weeks to review the bounceback. Despite the drop into the Venus aspects, Auntie finished the week in a stronger positon than the previous week. The Big Bird has turned higher without dropping as far as the Zero line.

Experienced traders I've talked to seem wary of the bounce. Yet, the index certainly seems to have met its targets for a major correction, which is what we thought this one was shaping up to be. It overbalanced the Price drop of the similar-level correction in early 2012, but not the Time - at least not so far.

We do need to continue to be cautious and not just because of this week's Bradley data and the Sun/Jupiter conjunction. We had several weeks of sideways shuffling at the end of the last correction of this magnitude.
click for larger image
However, we also need to at least weigh the prospect of what is "normal" after a drop this deep and this fast. And normal would tend to indicate a more sustained bounce to "balance" the drop.

Many of the other Asian area indices display charts very similar to that of the ASX200.

India's Nifty began its decline after failing to close above the 6175 Uranus level on its WP chart ... and with very clear divergence between the Big Bird and Price peaks when the high was made.
click for larger image
Singapore failed to even reach its Uranus barrier before turning down, with a negative divergence signal in the height of the fast MACD histogram peaks.
click for larger image
While Hong Kong turned south after being unable to climb above a Saturn barrier.
click for larger image
The build-up in the negative divergence levels on the oscillator for Jakarta was obvious and growing strident as that index struggled to overcome a Neptune price level in the mid-5100s ... but recovered the 4745 Neptune level with last week's strong bounceback.
click for larger image
While Shanghai may be in the process of finding its bounce level after recontact with a primary Saturn price line at 2150.
click for larger image
Now, each weekend we go through this exercise of trawling through planetary charts while I waffle on endlessly about astrological aspects and technical conditions. And that's just here. I got involved in a lively discussion with a couple of pals at the end of the week.

Both of them are not only intelligent, experienced, regular traders, but also have some enviable technical skills. We chat online virtually every trading day, swap tips and opinions, and tell jokes. These are conversations I wouldn't want to miss and if I had to trust someone else to invest for me, I'd trust these guys to make a profit more than any professional broker I've ever met.

Late on Friday, one of them was lamenting the fact his trading account was a little deeper in red ink than the previous week and I was reminded of why I wrote The Idiot & The Moon in the first place. And it's this ... a high-level IQ and an extraordinary degree of technical competence isn't a guarantee of making regular, reliable, safe profits from trading stocks. And nor is it even vaguely uncommon for regular traders to suffer varying degrees of despondency and anguish over trading decisions that continue to fail - no matter how much time, skill and effort they put into the job.

All of that is exactly why I came up with The Idiot. The Idiot is an Ego-destroyer without peer!

The Idiot reads nothing (except price bars), watches nothing, talks about nothing.

And yet ...

Well, here's the weekly Idiot applied to Miss Pollyanna. One of us made a lot of money trading this index. And it wasn't me. Even worse is the realisation it could, and should, have been me!

I do hope you all are smarter than I am!
click for larger image

Safe trading - RA

Randall Ashbourne
Astrological Investing's associate, Randall Ashbourne, author of the eBook, The Idiot and The Moon, and The Idiot and the Moon, Forecast 2013, writes a free weekly column titled, The Eye of Ra on his web site in  which he explains the potential impact of astrological aspects and the current state of technical conditions. Ashbourne's charts are revealing illustrations of exactly what has occurred in the market and the probability of what to expect.
Important reading:  Randall Ashbourne's The Idiot and The Moon, Forecast 2013 , Jupiter's cycle and its effects on Wall Street and a posting of the weekly Eye of Ra report in this blog, titled A look at the Venus Retrograde effect
(Disclaimer: This article is not advice or a recommendation to trade stocks; it is merely educational material.)
Copyright: Randall Ashbourne - 2011-2013

The Idiot and the Moon, Forecast 2013
  • Major trend change dates for the full year, plus a month-by-month breakdown of high-energy trading dates and critical reversal dates.

  • An index-by-index analysis of Moon Trading across major American, European, Asian and Australian stock indices-

  • Identifies the major indices where following the phases of the Moon can dramatically cut profits, or even result in large losses.

  • Old Gods & Gold ... a Eureka! discovery about exactly what drives gold prices during rallies and corrections and charts showing highly-reliable target levels to both the upside and downside.

These price charts are individually-tailored to each index and cover Wall Street, Australia, Canada, Hong Kong, Singapore, Shanghai, India, England, Germany and France.

You will not see these charts anywhere else on the Internet!

And much more...

It is NEVER too late in the year to have this monthly information!