Showing posts with label Moon in Sagittarius. Show all posts

Saturday, August 2, 2014

Reviewing a few price targets

Randall Ashbourne, an associate of Astrological Investing, posts a weekly market report on his web site, theidiotandthemoon.com  The following is this weekend's Eye of RA report: Week beginning August 4,  2014 

Major stock indices went into meltdown mode last week as the money planet, Venus, fired up the long-running Uranus square with Pluto.

There is likely to be some relief from the pressure this week as Mars makes a trine with Neptune and the Sun trines Uranus.

The Moon enters Sagittarius on Tuesday and we should probably be prepared for a couple of wide-range days.

The Moon is symbolic of the public mood and Sadge exaggerates either the fear, or the optimism.

As we go into next weekend, both Mercury and the Sun will square Saturn, coinciding with the statistical low period of the Full Moon.

August can be a nasty month for stock prices, as it was in 2007 and again in 2011. But, both of those were spike Lows, with strong bouncebacks.

I indicated last weekend that the Dow Jones Industrials had fired a warning shot and the German DAX looked to be in dive mode, so there was "clear and present danger" in the markets.

It pretty much turned out that way for most of the Western indices, so let's begin this weekend by going back to the DJI chart I said then was really the only stock chart of much importance.

It was then, and remains still, a fairly basic chart with one blue uptrend line and a red horizontal price level. The daily uptrend since the early-February low is now severely broken.

The January slide wiped nearly $1250 off the price of the Dow and the decline last week has taken a $714 bite. Now remember that the high at the end of December and the mid-July high were both listed as major Bradley turn dates.


The other point I want to emphasise about the above chart is the depth to which the Big Bird oscillator has dived ... fractionally lower than it did during the drop at the start of 2014. If normalcy prevails, it's an indication the current drop has further to go.

And I think that's probably endorsed by the next chart, the DJI's weekly, starting with the major Low in 2011. Again, it's a simple chart using just a couple of techniques from The Technical Section of The Idiot & The Moon; I'm really not a fan of complicated charts.

And we have another trendline break. The Dow has closed below the lowest channel marker for the first week since this rally phase started.


I had this chart marked with three important horizontal levels and the DJI finished last week trying to stay on top of the highest of those markers.

But, as with the daily, we have had a long build-up of negative divergence in the Big Bird oscillator. In fact, the 50CCI made its highest peak back in March 2013.

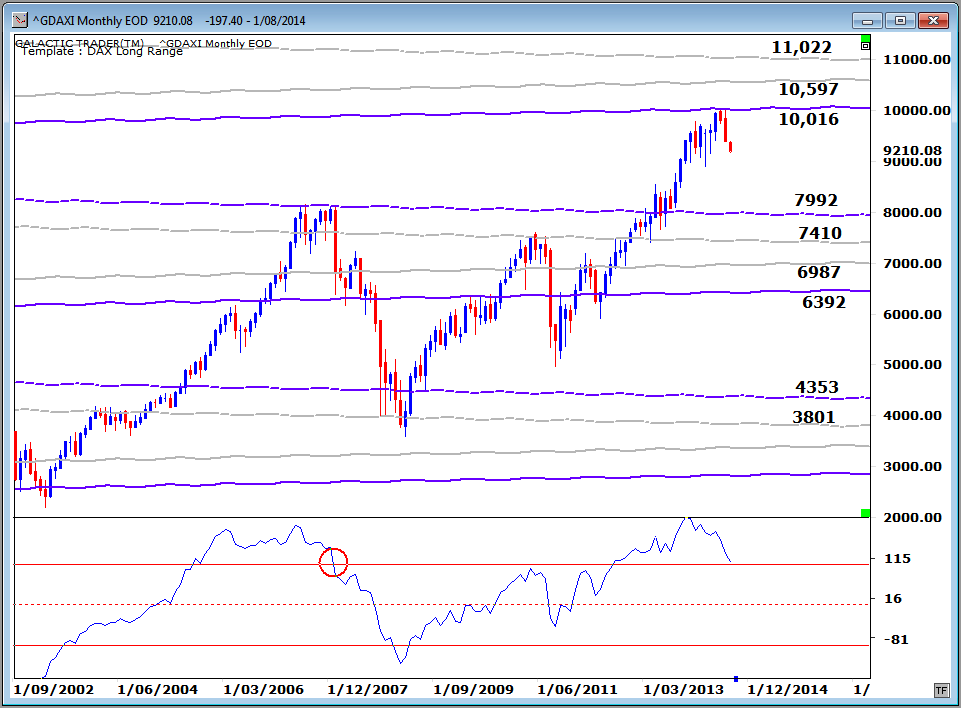
We'll go to Pollyanna's long-range planetary price chart in a moment, but have a quick look at the DAX first. That Pluto level in the early 10,000s clearly provided massive Resistance, just as the lower Pluto level did during formation of the 2007 top in the market.

Monthly Big Bird on the DAX is now getting dangerously close to losing its Bull market status. Once the oscillator loses the top red line in the oscillator panel, we can be pretty sure the big bad Bear is back.

Back to New York now and the current state of the SP500, where Pollyanna swapped her party frock for her Chicken Little outfit. The index has now lost both the Node level at $1957 and the Mars channel line, priced around $1944 for the week ahead.

Remember this is a long-range planetary price chart for the index. On the daily charts, the 500 has dropped into a zone where it could now receive a boost from rising inner planet price lines determined by the Sun, Mercury and Venus.


I didn't show you the ASX200's Weekly Planets chart last weekend, so here's the update. After the breakout above the Saturn/Uranus barrier in the 5560s, Auntie made a dash for the Neptune level in the 5600s ... and then joined the general swoon.

I indicated last weekend that if the breakout is the real deal "the negative period between New Moon and Full Moon should not cause major damage". So far, this isn't major damage. If the index can stay on top of the old Saturn resistance at 5530 by the end of this week, the old bat might just start a multi-hundred point run north.

And if she can't hold, she'll fall into a planetary price hole with no real support until several hunded dollars lower.


Gold. Yeah, yeah. Yada, yada. Waffle. Piffle. Drivel. Look, I don't give a rat's about the daily jerkarounds. One chart. Simple. Price has climbed back into and is consolidating within the upper, lower level of the monthly Bi-BBs. Both the MACD signal line and histograms are climbing. Put in your loss stops to protect your capital and go pour yourself a large gin. Sabbai, sabbai. Tidak apa apa.


Safe trading - RA

Randall Ashbourne (Disclaimer: This article is not advice or a recommendation to trade stocks; it is merely educational material.)
Copyright: Randall Ashbourne - 2011-2014


Astrological Investing's associate, Randall Ashbourne, author of the eBook, The Idiot and The Moon, and The Idiot and the Moon, Forecast 2014, writes a free weekly column titled, The Eye of Ra on his web site in  which he explains the potential impact of astrological aspects and the current state of technical conditions. Ashbourne's charts are revealing illustrations of exactly what has occurred in the market and the probability of what to expect.


Important reading:  Randall Ashbourne's The Idiot and The Moon, Forecast 2014  


  Purchase Forecast 2014 and receive a special report on GOLD  

Sunday, June 15, 2014

Full Moon low ... or something else?

Randall Ashbourne, an associate of Astrological Investing, posts a weekly market report on his web site, theidiotandthemoon.com  The following is this weekend's Eye of RA report: Week beginning June 16,  2014 

It was a week when all the expectations became reality ... the war drums started sounding again, the Moon in Sadge delivered wide-range days, and Polly and the DAX turned down from long-range planetary price lines.

What we don't know yet is whether it was just a Full Moon drop, part of a Mercury Retrograde spurt-and-reverse, or the start of something significant.

If it's the first, this week should see stock prices stablise and start to rise again.

If it's the second, no real turnaround can be expected until late in the week. That's because there is a general tendency, by no means certain, for a trend which begins near the start of the Mercury Rx cycle to reverse course halfway through the phase.

There's not a lot of astrological activity this week, leading into the Solstice. The most notable event Up There is still Mars and its moves. We've had the square to Pluto and the red planet is now heading into opposition again with Uranus (exact midway through the following week).

The war drums will continue beating. They always made the cavalry nervous.

We'll begin this weekend with a quick look at Canada, which went in the opposite direction from most other Western indices. Price of the composite is still trying to reach an important Pluto/Node zone priced from the early 15,000s to just above 16,000.

If we backtrack, we can see the last two Bear bottoms came in at Pluto/Node zones ... the last one of which I've circled. The reason I highlight that zone is because it's made up of "mirror" lines and the orange Node line now priced at 16,012 was a major player in stopping the last Bull peak.

There's a general tendency for these zones to act a little like strong magnets over the longer term. That tendency is why I was fairly sure both the SP500 and Germany's DAX were due to make an exact touch of some overhead planetary prices. The DAX hit 10,033 on Tuesday, a slight overshoot, and then started backing off strongly.

Pollyanna hit her high on Monday, also with a slight overshoot. In both cases, the indices have hit long-range planet lines which should be strong enough to cause a strong countertrend. However, it's difficult to be sure of anything with Mercury Retrograde.

There is also a technical reason for last week's drop. Earlier in the year we spent several weeks discussing potential trades set up by price breaks of the outer BBs and I circled some past instances of normal behaviour when that happens.

India also ran into troubles last week, failing to break past a couple of Saturn barriers on the Nifty's Weekly Planets chart. The price bars are daily, not weekly, and so is the Big Bird oscillator which was clearly disenchanted with the new price highs.

The ASX 200 has been in an intermediate downtrend, though it's really more of a sideways shuffle so far. Weekly Big Bird suggests there is more downside to come.
The problem for the ASX continues to be the August 2007 spike low ... a resistance barrier I've talked about before, known as hitting the last low before the high.

The LLBH price is not far above an important Fibonacci Retracement level. Still, in overall terms, the index is clinging to a weak uptrend, riding external Fibonacci parallels of its main pitchfork. All 3 Birds ... Fast 6, Medium 14 and Long-Range 50 ... are stacked in decline mode.

There hasn't been a monthly close below the current Fibonacci fork extension since the index fell off the main tynes.

As stocks dropped, gold jumped ... getting a boost from holding support at the horizontal Pluto level and rising Sun. The rise brought it up to the next Pluto level.

I'm still wary about just how long this rally will last or how far it can go ... because of the technical damage done during the last big dump on the overnight markets.
.

Randall Ashbourne
Safe trading - RA
Astrological Investing's associate, Randall Ashbourne, author of the eBook, The Idiot and The Moon, and The Idiot and the Moon, Forecast 2014, writes a free weekly column titled, The Eye of Ra on his web site in  which he explains the potential impact of astrological aspects and the current state of technical conditions. Ashbourne's charts are revealing illustrations of exactly what has occurred in the market and the probability of what to expect.
Important reading:  Randall Ashbourne's The Idiot and The Moon, Forecast 2014
(Disclaimer: This article is not advice or a recommendation to trade stocks; it is merely educational material.)
Copyright: Randall Ashbourne - 2011-2014


  Purchase Forecast 2014 and receive a special report on GOLD
 

Sunday, June 8, 2014

Within mere points of a possible turn south

Randall Ashbourne, an associate of Astrological Investing, posts a weekly market report on his web site, theidiotandthemoon.com  The following is this weekend's Eye of RA report: Week beginning June 9,  2014 

Long story short ... Pollyanna and the DAX are now smooching long-range planetary lines likely to halt the rally.

We'll take a look at the relevant charts in a moment, but first spend a moment or two on the Spooky Stuff.

This weekend, the little mischief maker, Mercury, turns retrograde for the rest of the month, so it's time for the usual warnings.

Firstly, double-check everything you do and take a few extra seconds to concentrate on whether you're about to do what you actually intended to do. Expect technical signals to fail and data to go awry. And remember that a trend which starts around the Rx date is prone to reversal midway through the cycle (which ends in early July).

Midweek the Moon goes into Sagittarius for a couple of days. That usually means wide-range days when either the fear or the optimism is unduly exaggerated.

The end of the week brings the normally negative period of a Full Moon, along with a Venus opposed to Saturn aspect on the same day. And next Saturday, Mars will square Pluto ... the war drums start sounding again.

This weekend's edition will be brief, since we'll concentrate on Pollyanna, the SP500, and Germany's DAX ... both of which ended last week in a lip-lock with long-range planetary price levels which should, in a normal world, cause a major stall in the rally.

It's not, of course, a normal world. Mario Draghi has finally done what he's been hinting at for a year ... charging to put money in the bank.

For the moment it applies only to banks lodging money with the European Central Bank. But that's only the first step. The ultimate aim of the banksters is to charge people for keeping money in the bank.

The velocity of money ... the number of times the same dollar changes hands ... has slowed to a crippled crawl. In effect, when times are good, people are confident of the future and they spend. So, every dollar changes hands very quickly. When people are worried, they don't spend, they hoard ... and the velocity of money slows down.

Draghi has finally taken the first step, ostensibly to force banks to start lending, rather than parking their money in central vaults. He has opened the door for banks to start charging customers to make deposits, rather than paying even meagre interest on those deposits.

Nevermind. We've been looking recently at some of my long-range planetary price charts and I suggested there were certain key levels which "should" be hit.

The two leading Western indices are now there, short of the marks by only a few dollars. Let's look first at the 500. Polly just blew past a primary Saturn priced near 1930 on the weekly charts and is now close to hitting a Node line at 1952.

I've circled her "normal" reaction to hitting these Node levels in the past. They tend to cause a stall or a sharp drop.

The price range from 1952 to 2006 represents a long-range Node "zone" and there are a couple of major Mars price levels within that zone. The alternative to a downturn is a period of range-trading within the zone.

The next chart is for Germany's DAX, which hit a new peak at 10,013.69 on Thursday, only a couple of points away from one of the targets I showed in Forecast 2014. This is a major Pluto level; the DAX is hitting it with growing divergence in the long-range Big Bird oscillator.


The next chart is pure favoritism. It's my home index, the ASX200 ... and still the index can't stay north of the weekly Saturn barrier, priced at 5519 for the coming week.


And, finally for this weekend, a quick look at gold's daily. I indicated last weekend it was at, or close to, a potential bounce level since price had come down to a horizontal Pluto level and could get some help from a rising, secondary Sun line. And that's what we have ... for the moment!

How long the bounce will last I have no idea. Another breakdown is probably even more likely than a northbound breakout, simply because of the technical damage done during the recent price drop.

I suppose we could waffle at length about gold. About how the first small load of gold returned to Germany had the wrong stamps on it. Y'see the gold stored at Fort Knox ... rolling around the floor laughing ... and in New York is hallmarked with the owner's brand and it's exactly those bars which are supposed to be returned to them.

It's not what Germany actually got back. According to other reports, vast numbers of big gold bars, carrying various central bank hallmarks, are being put through the Swiss smelters ... and are coming out the other end stamped with Chinese hallmarks.

In fact, if some reports are credible, China is accumulating more physical gold than the total annual supply from all the world's mines. If that's true, there's only one explanation ... they're stockpiling "old gold". Yes, the stuff that's supposed to be sitting in the New York and London vaults.

I guess that means, for us, that when the banks start imposing their SuperMario levy, it's not going to be 0.15%.

Randall Ashbourne
Safe trading - RA

Astrological Investing's associate, Randall Ashbourne, author of the eBook, The Idiot and The Moon, and The Idiot and the Moon, Forecast 2014, writes a free weekly column titled, The Eye of Ra on his web site in  which he explains the potential impact of astrological aspects and the current state of technical conditions. Ashbourne's charts are revealing illustrations of exactly what has occurred in the market and the probability of what to expect.
Important reading:  Randall Ashbourne's The Idiot and The Moon, Forecast 2014
(Disclaimer: This article is not advice or a recommendation to trade stocks; it is merely educational material.)
Copyright: Randall Ashbourne - 2011-2014


  Purchase Forecast 2014 and receive a special report on GOLD


Saturday, April 12, 2014

Oh, but we ain't seen nuttin' yet!

Randall Ashbourne, an associate of Astrological Investing, posts a weekly market report on his web site, theidiotandthemoon.com  The following is this weekend's Eye of RA report: Week beginning April 14, 2014 
 Volatile, isn't it? Downright Spooky. We've been discussing for quite some time now the special danger posed by this month.

And what we've seen so far is only the orchestra warming up. This week we enter a two-week timeframe when the energies involved in a rare Cardinal Grand Square start hitting maximum tempo.

It starts on Monday - Euro-American market time - when Mercury adds its weight.

Tuesday brings another boost with a lunar eclipse Full Moon in Libra.

Thursday could be very interesting as Venus trines Jupiter with the Moon going into Sagittarius, a brief period when either extreme optimism, or extreme pessimism, will take hold. We've chatted before about the tendency for markets to make wide-range days with the Moon in Sadge.

And the following week, Mars, the mover of markets, adds maximum drive.

A lot of the astrological background is in the recent Archives and I see no point in rehashing the same-old, same-old. Instead, we will try to deal with the specific price levels on various indices.

Before we do, allow me to waffle a tad more about astrological "expectations". I know ... I nag about this like an irritating Virgo witch. Tough titties.

Astrology is complicated. Very complicated. To be able to predict, with accuracy, what is likely to happen, one needs an accurate "birth" chart.

 One can make generalised predictions ... but the reality is they're often about as useful as the Sun sign horoscopes in a tabloid. But to make specific predictions, one needs a birth chart ... and then one needs to sit for hours actually studying the intimate details of that particular chart.

There is a form of shortcut we can use for financial markets ... because we can calculate the EXACT price levels which will have an impact IF price hits those levels on the EXACT day of the transits.

And that's what we'll look at this weekend.

 Firstly, though, we'll return to a chart we've looked at quite a few times during the past couple of months ... the primary planetary prices affecting Pollyanna, the SP500.

 We've been discussing the heavy resistance provided by the Pluto level priced at $1876. Polly has now dropped through the $1824 Neptune level and is close to the first of two Uranus lines. On Monday, Mercury will conjunct Uranus. It could bounce from $1811 ... or continue dropping to $1788.

Now let's take a look at all the price levels which could be very important to this idex over the next couple of weeks as Mercury, Mars, Jupiter, Uranus and Pluto set-off this explosion of Cardinal energy.

Apart from this Monday/Tuesday, the most important dates are the Monday/Tuesday/Wednesday of the following week. Decisive closes through these price levels on those days will probably determine the future of the trend.

We also need to watch for bounces within a dollar or two of these exact price levels.


Because Pluto is involved in the Cardinal Grand Square, the future of gold is also at stake. As we know, the Sun and Pluto are gold's "natural" planetary rulers and have an important impact on trend direction.

That'll be even more important over the next few weeks.


The next few charts show the relevant price levels for, in order, the ASX200, the German DAX, London's FTSE and India's Nifty.


Now, that's probably the best I can do in terms of "prediction". I've been "expecting" this timeframe to bring in a long-term High. There are other astrologers who expect it to bring in a Low.

Yada-yada/blah-blah. Forget the expectations and remember this ... No contact, no impact. You have the dates, you have the price levels for various indices.

Watch for bounces from, rejections from, or closes through those levels on those days.

Oops. One more thing. I need to create a 2nd Quarter Archives page. In the meantime, (if you are reading this on the astrologicalinvesting blog) you can access last week's Eye by scrolling down.

Randall Ashbourne

Safe trading - RA
Astrological Investing's associate, Randall Ashbourne, author of the eBook, The Idiot and The Moon, and The Idiot and the Moon, Forecast 2014, writes a free weekly column titled, The Eye of Ra on his web site in  which he explains the potential impact of astrological aspects and the current state of technical conditions. Ashbourne's charts are revealing illustrations of exactly what has occurred in the market and the probability of what to expect.
Important reading:  Randall Ashbourne's The Idiot and The Moon, Forecast 2014
(Disclaimer: This article is not advice or a recommendation to trade stocks; it is merely educational material.)
Copyright: Randall Ashbourne - 2011-2014


Purchase Forecast 2014 and receive a special report on GOLD


Saturday, November 30, 2013

Potential for a golden bounce

Randall Ashbourne, an associate of Astrological Investing, posts a weekly market report on his web site, theidiotandthemoon.com The following is this weekend's Eye of RA report: Week beginning December 2, 2013

 Mars in Libra
Mars in Libra has a tendency to drive gold prices
America and Germany push to new highs. Again. Pretty much alone. Still.
Very little changed, which isn't odd with Wall Street effectively in Thanksgiving holiday mode from midweek.

What might have changed is gold. We'll have a closer look at that in the main part of this weekend's edition.

This week kicks off with the Sagittarian New Moon. The Moon in Sadge almost always signals a couple of wide-range days for stocks; usually up, but if the fear mode gets exaggerated ...

The Sun is already in Sagittarius and it'll be joined in the sign midweek by Mercury.

But it's the Mars move to Libra, which gets underway next weekend, that's the really volatile astrological signal for months ahead.

Mars takes a couple of years to travel the full zodiac, which means it normally spends only 6 to 8 weeks in each sign. Not this time. Because it'll be going Retrograde, Mars will be in Libra for 7 months.

Traditionally, Mars is in its detriment in Libra. Without any negative meaning at all, Mars is THE Self-ish planet. It's all about Ego and aggro.

And Libra isn't. It's sugar and spice and all things nice. So, astrologers tend to think Mars in Libra is a woosie pussy. It ain't so.

Mars in Libra simply has better table manners. Operating at its best symbolism, the Libran Marshun is a charming diplomat who can diffuse difficult situations with a gentle touch, a warm smile and a genuine drive to find co-operative solutions which are fair to everyone.

Oh, yeah! Looking forward to that little love fest between Barack, Bachmann and Boehner.

As soon as he enters Venus's territory, the Old God of war sets the scene for a Cardinal Grand Cross, the most highly-charged of all astrological aspects.

We will have Uranus in Aries, Jupiter in Cancer, Mars in Libra and Pluto in Capricorn.

Uranus in Aries = demands for radical reform and armed rebellion against the ruling elites.

Jupiter in Cancer = exaggerated defence of home, homeland and security.

Mars in Libra = smiling aggression, but aggression nevertheless, aimed at fighting for fair and equitable outcomes.

Pluto in Capricorn = the plutocrats prepare to raze the peasants' hovels and salt their fields if they don't pay their taxes and turn a blind eye to the elite's overwhelming desire to preserve the status quo and retain control of government and the "Establishment".

Since all four Cardinal signs are action signs, the next few months will be the last chance to resolve some of these debt/tax/power issues amicably. Mars in Libra can be the ultimate smoothy. But, he's still Mars ... still the Old God of war.  Gee,Zeus ... let's hope these issues actually do get settled before Mars moves into ... gasp*shock*horror ... Scorpio!!!!

Some people believe the Romans used to specifically select soldiers with their natal Mars in Aries to lead assaults. It's not true. The generals wanted shocktroopers with Mars in Scorpio. No retreat. No surrender. No mercy.

But, but ... we're not really here for tall tales of olden times.

Mars in Libra has a tendency to drive gold prices. They can be very volatile periods, even during Mars' short runs through the sign. This time, he'll be there for months.

I indicated last weekend that gold made its last pronounced high during a Venus-Jupiter aspect and that there was some potential for last week's Venus-Jupiter opposition to bring in a sustainable low.

It is possible that's the case. But, it's not without danger. In Forecast 2013, I introduced planetary charts for gold for the first time. It tends to travel within Sun channels between Pluto stations. Last week, it just may have caught a break from a rising Sun line close to the mid-1200 Pluto line.

Using the non-Spooky technical tool of Fibonacci Retracements, gives us another reason to consider being Long on gold or the miners. Price has been making an effort to hold the line at a 764 Rx level.

Two of our oscillator "Birds" like the action and are suggesting more northside movement is probable ... the fast green and the medium red. Big Bird, the blue, also seems to be starting to sing a little more sweetly.

The danger is that gold remains in a confirmed downtrend ... and the channel chart below shows it has a lot of work to do before we could be reasonably certain that a sustained and long-term new uptrend has started.


However, within that down channel, there is another sign of potential improvement. On a weekly basis, the price has again breached the bottom of the Bi-BBs. If you've read The Technical Section of The Idiot & The Moon, you'll know this has a tendency to either stall the current trend, or turn it the other way - even if only temporarily.

The midnight cowboys continue to conduct big downside trades in the wee hours and that danger will continue until gold recovers enough to undo all the technical damage.

But, for the adventurous, it could be worth considering the bounce. You most certainly need a Stop Loss!! However, the weekly Bi-BB chart and the planetary and Fibonacci daily charts earlier, show the upside targets.

Safe trading - RA

Astrologicalinvesting.com note:  Randall Ashbourne's Forecast 2014 will be available to purchase in January 2014 at 
www.astrologicalinvesting.com  as well as www.theidiotandthemoon.com 

Randall Ashbourne
Astrological Investing's associate, Randall Ashbourne, author of the eBook, The Idiot and The Moon, and The Idiot and the Moon, Forecast 2013, writes a free weekly column titled, The Eye of Ra on his web site in  which he explains the potential impact of astrological aspects and the current state of technical conditions. Ashbourne's charts are revealing illustrations of exactly what has occurred in the market and the probability of what to expect.
Randall Ashbourne's Forecast 2014 will be available to purchase at www.astrologicalinvesting.com/html/shop.htmlwww.astrologicalinvesting.com  as well as www.theidiotandthemoon.com 


(Disclaimer: This article is not advice or a recommendation to trade stocks; it is merely educational material.)
Copyright: Randall Ashbourne - 2011-2013


Friday, December 14, 2012

Markets diverging across the globe

Randall Ashbourne, an associate of Astrological Investing, posts a weekly market report on his web site, theidiotandthemoon.com The following is this weekend's Eye of RA report: Week beginning December 17, 2012


The Sagittarian Moon produced a brief spike in optimism last week, but north American markets couldn't hold the gains. 

We now have significant divergence building across world indices, with important markets in Europe and Asia topping their September/October peaks.
Wall Street remains captive to the "fiscal cliff" scenario, with big tax increases and spending cuts set to come into effect from the New Year unless a compromise deal is done ... and fast.

Pundits are betting there's only a 25% chance the deal will get done in time, but are still pinning hopes there'll be retrospective legislation in January. Since some of the tax increases affect capital gains, there's a danger of a panic-selling event as traders and investors scramble to unload gains to minimise the tax impact.

There are a couple of major astrological events this week ... Venus trines Uranus and the Sun makes its transition into Capricorn.

I mentioned a few weeks ago that a trine should not be read as either benign or difficult, but that it does imply "the rapid removal of obstacles". So, there is a chance we could see a sudden breakthrough in the talks between President Obama and House Speaker Boehner this week.

In any case, Venus trine Uranus is one of those major aspects with a habit of moving markets; which is understandable since Venus rules money and Uranus has rulership of stock markets.

It is, however, an aspect somewhat more inclined to producing a downturn in prices, rather than a near-term bottom.
click to view larger image

Above is a weekly chart of the SP500 with past instances of the aspect marked with red bars. The last three all produced slumps which lasted for several weeks.

Markets in Europe and Asia are putting in new Highs above the September/October peaks - including the FTSE, the DAX, the Nifty, the STI, Hang Seng, ASX and Japan.

The coming week may well decide if north America joins them - or provides the catalyst for a worldwide decline. We got the normal Sagittarian effect on Tuesday and Wednesday last week, producing a short-lived spike in indices like Pollyanna, the SP500.

Unlike the other markets mentioned, Wall Street and the Nasdaq couldn't hold the new ground - still well below the level of the 3Q peaks.

click to view larger image

Miss Polly pushed up into the twin Saturn zone a few dollars either side of 1440, but dropped back to finish the week still playing around the 1410ish zone marked on her long-range planetary charts. Above is the 500's Weekly Planets chart and the importance of that primary Neptune around 1410 is obvious.

Other indices are still playing within the bounds of the December range charts I published for a broad group of indices in the December 3 edition, available in the Archives.

Forecast 2013


There will be no update next weekend. I'll take this opportunity to thank you all for your interest during the year and wish each of you a happy holiday season.

I'm still researching material for next year's Forecast - but it will contain in-depth chapters on a couple of areas which will be of major interest to some traders.

One of those chapters will be on gold and I'll reveal, I think for the first time anywhere, precisely which planetary price lines set the long and medium term range targets for the price of gold.

I'll also be taking another look at The Moods of The Moon ... specifically which of the world's major stock indices produce the highest profits by trading the monthly lunar cycle. And that's going to be a real surprise!

In the meantime ...

Safe trading - RA

Randall Ashbourne
Astrological Investing's associate, Randall Ashbourne, author of the eBook, The Idiot and The Moon, writes a free weekly column titled, The Eye of Ra on his web site in  which he explains the potential impact of astrological aspects and the current state of technical conditions. Ashbourne's charts are revealing illustrations of exactly what has occurred in the market and the probability of what to expect.
Important reading:  Randall Ashbourne's article, Jupiter's cycle and its effects on Wall Street and a posting of the weekly Eye of Ra report in this blog, titled A look at the Venus Retrograde effect
(Disclaimer: This article is not advice or a recommendation to trade stocks; it is merely educational material.)
Copyright: Randall Ashbourne - 2011-2012

Saturday, October 20, 2012

A heightened sense of danger

Randall Ashbourne, an associate of Astrological Investing, posts a weekly market report on his web site, theidiotandthemoon.com The following is this weekend's Eye of RA report: Week beginning October 22, 2012

While key DNA markers normally obvious at The Top are still missing in some Western stock indices, I'm getting the sense those markets have suddenly become dangerous.

For the past 6 weeks, the broad-based Wall Street index, the SP500, has been stuck below the 1468 level marked as a key barrier on my long-range Old Gods chart.

We've remained open to the possibility of a breakout to new highs at 1522, or even a blow-off to around the 1560 level.

And the reason we've constantly looked at that possibility is the lack of a negative divergence signal from the long-range Canary on Pollyanna's monthly charts.

A few editions ago, I pointed out that key divergence signal had started to become very obvious in the Nasdaq 100, the NDX. It may now also be starting to show in the Dow Jones Industrials.

In both of those indices, the heavy-lifting over the past couple of years has been carried on the shoulders of very few stocks ... like Caterpillar and Apple.

We will take a close look this weekend at the alarm bells going off in the NDX and the general state of some other major indices.

Normally, I refuse to be jerked around by one day's movement in any index. But, I'm getting a sense that something fundamental has changed following Friday's performance on Wall Street.

It's true the drop happened with the Moon in Sagittarius and I said last weekend: "Mars is now in Sagittarius and it'll be joined by the Moon later in the week. Sagittarius has a tendency to exaggerate either the optimism ... or the fear. And wide-range days are the norm when the Moon is in Sadge."

So, even though we did get a wide-range fear day down, I still can't shake the sense there has been a change at a deeper level. The week began for Miss Pollyanna pretty much in accordance with my expectations. I outlined two important scenarios for Miss Polly on Monday, or Tuesday, which would prompt a price bounceback.

I said: "And the key to direction will be how price performs on both Monday and Tuesday. On the chart to the right, note the intersection of the falling red Mars line with the thick yellow Uranus line.

It's at 1434. Pollyanna must close decisively above this level on Monday to re-enter rally mode. She gets a second chance at an astro energy boost on Tuesday, if she fails the 1434 Monday test.

In the chart above, the Venus square Jupiter price crossing point (rising green intersection with horizontal blue) is 1426.

So there are two things to watch for ... a Monday close above 1434, or a Tuesday low at 1426, from which price bounces
."

click for larger image

We can see what happened in the chart above - and there was no need to wait for Tuesday.

Because, on Monday, Miss Polly did make a decisive close above the 1434 level and re-entered rally mode for most of the week.

But with the Moon in a Sagittarian-exaggerated fear mode, Friday's freefall wiped out almost all of the gains.

Now, maybe it's just a one-off, one-day comeback for Chicken Little.

But, what if it's not?

Firstly, let's remind ourselves of where the Pollyanna index is in terms of its long-range planetary price markers.

click for larger image

There is nothing out of the ordinary in the chart above. Well, apart from the fact the support and resistance lines happen to be determined by the position of a few rocks and giant gas balls Out There.

But, from a technical viewpoint, it still all looks hunky dory. Here we are two-thirds of the way through October and price is still largely within the spike part of September's range.

But, if you look at it on a weekly, it has been 6 weeks below the peak of that spike. That suggests it's either accumulation ... or distribution. In other words, the Big Boys have been slowly stocking up for another rally ... or they've been unloading hand-over-fist to anyone who believed Goldman's "buy, buy, buy" memo.

In the meantime, the NDX has been screaming "danger, danger, danger".

click for larger image
We've discussed the importance of 50% Fibonacci Retracement levels in the past and noted the danger it posed on the NDX. We now have quite severe negative divergence between the long-range Canary peak in March and the much lower peak it posted last month when price briefly broke above the 50% FiboRx level.

But the divergence is more dangerous when we look at the peak the Canary made in 2007 and its performance since the 2009 bottom.

As y'know, in terms of astrological predictions, I expected markets to top out in March and go into freefall until at least October. So, these days I don't go out much because that much egg on your face isn't a good look in public.

In spite of that, the apparent failure of the long-range Jupiter-in-Taurus top is beginning to look more like a regional variation on the theme, rather than a broken signal.

click for larger image

Here's another look at the NDX monthly, with the dark green bars showing the periods of Jupiter in the sign of Taurus. On the left of the chart, we can see the Nasdaq's blow-off, all-time high. As Jupiter entered Taurus, the market launched into the heavens.

We then got a secondary peak with Jupiter in early Gemini ... 3 monthly bars past the last green Jupiter bar.

And now ...

Yes, it's starting to look disturbingly familiar ... a marginal new peak 3 bars past the last of the Taurean Jupiter bars.

And London's FTSE index lends support to the NDX signals. There, the post-June rally has still not taken out the Taurean Jupiter high of March, nor the 2011 rally peaks.
click for larger image

So, we seem to have arrived at an interesting place ... and the question is whether the American Presidential cycle, whose 4Q performance I touched on last weekend, has actually displaced the Jupiter-in-Taurus signature, or has merely temporarily delayed its onset. It's a vitally important question because if it's the latter scenario, we may already have seen The Top. There's no surefire confirmation yet; Bernanke and Draghi may yet drop more make-believe moneybags into the path of the tsunami. So, here's an update of the Weekly Planets charts for various indices to help guide your decisions.  

FTSE:
click for larger image
DAX:
click for larger image
ASX 200
click for larger image

India's Nifty
click for larger image

Singapore:

click for larger image
Safe trading - RA

Randall Ashbourne
Astrological Investing's associate, Randall Ashbourne, author of the eBook, The Idiot and The Moon, writes a free weekly column titled, The Eye of Ra on his web site in  which he explains the potential impact of astrological aspects and the current state of technical conditions. Ashbourne's charts are revealing illustrations of exactly what has occurred in the market and the probability of what to expect.
Important reading:  Randall Ashbourne's article, Jupiter's cycle and its effects on Wall Street and a posting of the weekly Eye of Ra report in this blog, titled A look at the Venus Retrograde effect
(Disclaimer: This article is not advice or a recommendation to trade stocks; it is merely educational material.)
Copyright: Randall Ashbourne - 2011-2012