The strange disconnect between Wall Street and most other major world indices continues.
Last week's two-day surge raised the SP500 and DJI back within the range of the two most significant bubble tops in modern history. Yet, the Street is convinced that in the coming week, both the FOMC and the ECB will announce new stimulus measures.
Astrologically, the main aspects in play over the coming week fall into the "beneficial" category - the Sun trines Uranus and sextiles Jupiter and Venus will trine Saturn.
It also brings us up on a major Bradley Model turn window - and is halfway through the Mercury Retrograde cycle, where spurt-and-reverse tendencies come into effect.
I'll update the Mercury and Bradley charts in a few minutes.
It's interesting that the freefall in the early part of the week was suddenly reversed by Mario Draghi promising to do "whatever it takes" to backstop the Euro - and, more broadly, the whole European financial system. It is very much a modern banker's solution and is probably no surprise coming from a former Goldmans executive.
But, usually, statements made and policies outlined while Mercury is Rx, tend to have to be revisited once the planet resumes Direct motion.
In any case, one wonders exactly why the US Federal Reserve, in particular, would act now with further monetary easing.
 |
| click for larger image |
The chart above is a monthly of the SP500, showing the 1999-2000 and 2007 "bubble" tops - the peak of the Nasdaq boom and the height of the CDO madness. Last week's spurt put the index back into bubble territory ... and the "logic" on the streets is now not so much that the good times will roll forever, it's that economies are so bad, central banks will print more money.
It seems like a strange place for central banks to prop up the stock markets. Logic would seem to dictate they don't actually need to prop up markets already back in Bubbleville.
The red, intermediate-range oscillator displayed negative divergence at the last price peak and seems set to give another instance of it. However, the state of the long-range (blue) oscillator confirmed that previous peak - what I pointed out earlier in the year as being the elephant in the room which indicated the rally would run longer-and-stronger that the astrological expectations forecast.
 |
| click for larger image |
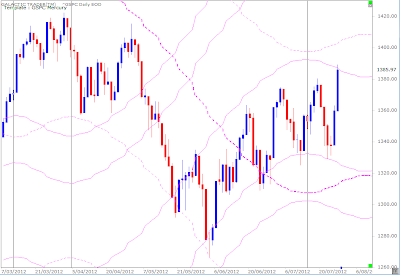
And a couple of weekends ago, I showed you the tendency of the 500 to do a spurt-and-reverse act during those periods when Mercury goes Retrograde - remarking the index has a tendency to travel within defined Mercurial corridors.
 |
| click for larger image |
Last week, the index bottomed with a touch of the downside level of the current corridor, before bouncing strongly over Thursday and Friday to hit the top of the range. Breakout from that corridor, would target the dotted Mercury line in the early 1400s.
 |
| click for larger image |
And that price level is also highlighted on the 500's long-range planetary price chart, above.
 |
| click for larger image |
 |
| click for larger image |
Last weekend, I indicated the ASX200 was running into a downtrending Sun line that was likely to have an impact - the reverse of the rising Sun line chart we've followed for several weeks on the FTSE. The expected impact did have an effect in sending the 200 south for the first part of the week before the Draghi bounce. It looks as if she will yet make at least a kissy/smoochy with the grey Neptune line after all.
The next chart is a weekly of the ASX200, showing the target levels in Fibonacci levels, rather than planetary prices.
 |
| click for larger image |
Turning to the FTSE ...
 |
| click for larger image |
Before showing the ASX about to fall under the influence of a falling Sun line last weekend, I also remarked we had seen the first close below the rising Sun line on the FTSE planets chart we'd been looking at since early June.
The index dropped dramatically down to the horizontal planetary levels which have been shown many times on the FTSE's Weekly Planets chart - proving yet again those weekly planet charts provide excellent Entry and Exit levels for short and medium trades.
Safe trading - RA
Astrological Investing's associate, Randall Ashbourne, author of the eBook, The Idiot and The Moon, writes a free weekly column titled, The Eye of Ra on his web site in which he explains the potential impact of astrological aspects and the current state of technical conditions. Ashbourne's charts are revealing illustrations of exactly what has occurred in the market and the probability of what to expect.
Important reading: Randall Ashbourne's article, Jupiter's cycle and its effects on Wall Street and a posting of the weekly Eye of Ra report in this blog, titled A look at the Venus Retrograde effect
(Disclaimer: This article is not advice or a recommendation to trade stocks; it is merely educational material.)
Copyright: Randall Ashbourne - 2011-2012


0 comments:
Post a Comment
Note: Only a member of this blog may post a comment.