Showing posts with label Hang Seng. Show all posts

Saturday, March 2, 2013

Taking a look at Asian markets

Randall Ashbourne, an associate of Astrological Investing, posts a weekly market report on his web site, theidiotandthemoon.com The following is this weekend's Eye of RA report: Week beginning March 4, 2013

On Wall Street, Miss Polly is bumping her head again; and in Washington they're talking budget blues again ... for the umpteenth time when Mercury is Retrograde.

It's fairly well accepted that during the Reagan presidency, Nancy kept her favorite astrologer handy to help with not just the timing of decisions, but the direction of decisions.

 Just maybe that's part of the reason Ron and Nancy enjoyed a lot more support at the end of Reagan's time in office than was evident at the start.

For the past few Obama years, however, it seems that every major decision is put off until Mercury is Retrograde; outcomes are difficult to negotiate; and almost invariably nothing real gets done and the can de jour just gets kicked down the road.

We're back on the same old treadmill. It's all too, too depressing for me to make any predictions this weekend.

We're approaching the midpoint of the Merc Rx period and this week goes into the 3Q-NM lunar phase. In terms of the SP 500 last year, only four of these phases were negative.

They tended to be slightly less positive than the FM-3Q phase, which is now ending. This weekend, we'll take a quick look at Pollyanna and the Nasdaq 100 and then take a closer look at the Asian markets because I want to demonstrate something about the Weekly Planets charts.

Almost boringly, we'll use the same 500 and NDX charts I've used over the past couple of weekends.
Click for larger image

Polly is back at the breakout-or-breakdown barriers of the planetary lines which capped the 2000 and 2007 Bull markets. To be frank, I have no idea at all which way this is going to go.

Overcoming that overhead Uranus/Pluto hurdle opens targets in the range from about 1548 to 1572. If things go the other way, my best guestimate for the downside would be the grey Neptune at 1466.
Click for larger image

The NDX, above, continues to be stalled by the Uranus barrier now at 2770 ... and continues to make what might, or might not, be the right shoulder of a head & shoulders formation. If it plays out, it's again Neptune I'd expect to stop the drop - at a price around 2440.

Anyway, I really don't know and I want to look at the Asian markets instead, because I want to show you something about my Weekly Planets charts.

The last time we looked at the Straits Times Index, Singapore, I think was in late January and if you check the Archives, you'll see the upside target was listed as 3319.
Click for larger image

Well, the high for the STI came in a 3319.19 - and the index has been in correction mode since it was hit. In other words, the hit was quite precise.

That Neptune line, which also capped the 2010 peaks, is currently priced a tad higher at 3332 and I've also updated the two most likely downside targets.

It's also been several weeks since I published Shanghai charts.
Click for larger image

The last time I published this one, the Neptune line was priced at 2407. There was a slight overshoot when Shanghai topped at 2434.48 and then went into correction.

Given the positive divergence which appeared in the oscillator as Shanghai made its final low, and because of the strong rise in that oscillator since then, I'd think the index is far more likely to breakout and the next upside targets are in the range from 2600 to 2800.

If you're a regular reader, you probably already "get" the value of these Weekly Planet charts in helping determine Entry and Exit levels for some very profitable trades. If you're one of the recent arrivals, these two serve as a good example of how it works - and you might want to trawl through the Archives to find your favorite index if it's not in this weekend's edition.

Hong Kong ...
Click for larger image

The Hang Seng is one of those which didn't reach the target on the last attempt and the fast MACD has rolled over. Still, there was no really major negative divergence at the high and the index is trying to hold an interim Saturn line as Support.

Indonesia ...
Click for larger image

Jakarta has been on a roll, one of the strongest indices in the region. I haven't created planetary charts for the index yet ... and I'm not sure the number of Indonesian readers warrants it. If the information really is of strong interest to you, drop me a line and I might work it out for future editions.

Just technically in the meantime ... this romp outside the upper boundaries of the Bi-BBs can't be sustained for long, despite approval from the fast MACD. Breaking the BBs normally means a sideways move, or downside correction, is not very far away.

Malaysia ...
Click for larger image

And there's a good current example of precisely how that works in the Kuala Lumpur index. Just cast your eyes back to look at what happened with the price on previous occasions when the top layer of BBs was broken.

Australia ...
Click for larger image

We'll finish, as usual, with the ASX200. The 4985 Saturn level held up as Support for the second week running. A rather mild case of negative divergence is developing in the oscillator, but it's not so bad yet that it sets alarm bells ringing. So far, I see nothing to change my mind that another strong rally is coming before we need to be really cautious about Auntie, even if the index corrects further before launching that rally.

Safe trading - RA

Randall Ashbourne
Astrological Investing's associate, Randall Ashbourne, author of the eBook, The Idiot and The Moon, and The Idiot and the Moon, Forecast 2013, writes a free weekly column titled, The Eye of Ra on his web site in  which he explains the potential impact of astrological aspects and the current state of technical conditions. Ashbourne's charts are revealing illustrations of exactly what has occurred in the market and the probability of what to expect.
Important reading:  Randall Ashbourne's The Idiot and The Moon, Forecast 2013 , Jupiter's cycle and its effects on Wall Street and a posting of the weekly Eye of Ra report in this blog, titled A look at the Venus Retrograde effect
(Disclaimer: This article is not advice or a recommendation to trade stocks; it is merely educational material.)
Copyright: Randall Ashbourne - 2011-2013

The Idiot and the Moon, Forecast 2013
  • Major trend change dates for the full year, plus a month-by-month breakdown of high-energy trading dates and critical reversal dates.

  • An index-by-index analysis of Moon Trading across major American, European, Asian and Australian stock indices-

  • Identifies the major indices where following the phases of the Moon can dramatically cut profits, or even result in large losses.

  • Old Gods & Gold ... a Eureka! discovery about exactly what drives gold prices during rallies and corrections and charts showing highly-reliable target levels to both the upside and downside.

These price charts are individually-tailored to each index and cover Wall Street, Australia, Canada, Hong Kong, Singapore, Shanghai, India, England, Germany and France.

You will not see these charts anywhere else on the Internet!

And much more...


Saturday, November 10, 2012

Americans skittish ... others not so much

Randall Ashbourne, an associate of Astrological Investing, posts a weekly market report on his web site, theidiotandthemoon.com The following is this weekend's Eye of RA report: Week beginning November 12, 2012
The big astrological event for the coming week is the Solar Eclipse New Moon in Scorpio.

Two editions ago I published an historical chart showing the impact of Solar Eclipses on the SP500 - and caution again that there is no truly reliable prediction that can be made about the effect on markets.

The path of this one takes in Indonesia, northern Australia and New Zealand and into the mid-Pacific.

Since it's in Scorpio, ruled by Mars and Pluto, and since it's directly above the so-called Ring of Fire, there's probably an increased likelihood of seismic disturbances in the region.

However, let's talk about Wall Street's seismic disturbances. The Mercury Rx station had little impact on the vote - except in Florida, which used not be able to print proper ballot papers, but got over that problem and now just needs to learn how to count them.

We'll spend some time this weekend pawing over the entrails of the SP500 to see whether, and what sort of, bounce might be expected.

First, let's remind ourselves of where we are in terms of the big picture.

click to view larger image

Above we have the long-range monthly. The Jupiter-in-Taurus bars, which have a very close historical relationship with Bull market tops, are in dark green. And we discussed a couple of times recently what might be happening with the NDX in this regard.

But, what we really want to do here is just get an "eyeball" view of the current state of affairs with the broad-based SP500. The index briefly poked its head back into the irrational exuberance zone of the two previous Bull peaks ... and closed out last week, testing the first line of defence at the lower horizontal line of technical Support.

Nothing out of the ordinary so far ... though we have been chatting recently about the growing danger signs within the American indices.

Two editions ago, I published a couple of versions of the same chart, indicating where the Pollyanna index was likely to head if prices continued the correction.

click to view larger image

This was the first of them, showing Pollyanna behaving relatively routinely within a rising pitchfork since the August/October plunge a year ago.

And the next chart is simply a close-up ...

click to view larger image

The last time we looked at these charts, I made the point the index was trying to hold the upper red line of a Fibonacci-calculated zone within the bottom half of the fork and that if it failed to hold, the Bulls would mount a fight at the 1390 and/or 1370s levels.

And that's where we're at. So, the index is at an important horizontal level on the long-range monthly AND at an important level within the internal Fibonacci bands of a daily chart.

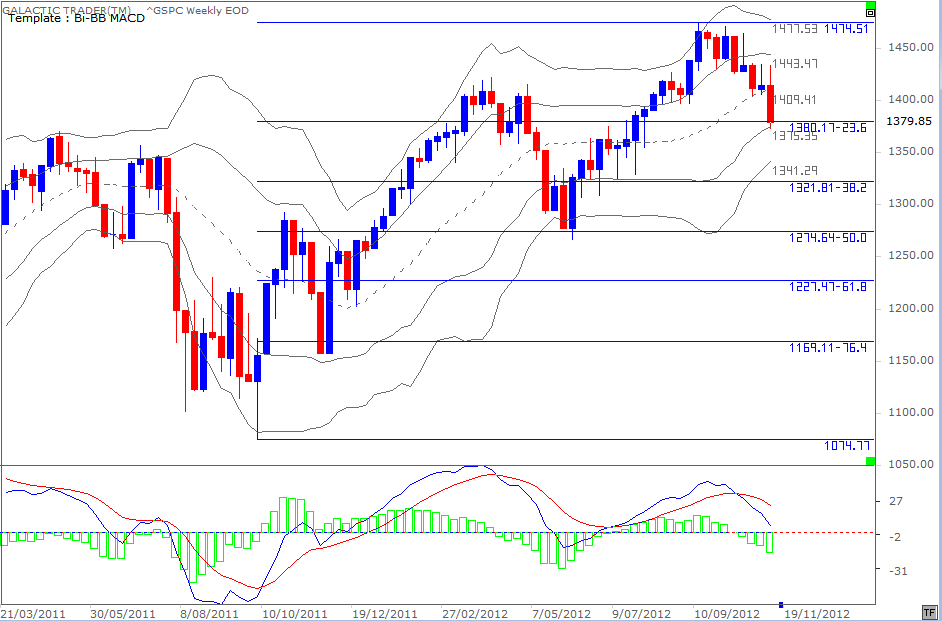
We'll look next at a couple of weekly charts. Below is a Bi-BB. Price found support on Friday at the mid-level of the lower band, which also happens to be close to a routine Fibonacci Rx level of the whole rally over the past year.
click to view larger image

And golly-gee-whizz, ditto for Polly's Weekly Planets chart.

click to view larger image

Okay. So, we know that there is a statistical tendency for New Moons to coincide with a near-term High. However, we also know from the Solar Eclipse chart from the October 29 edition, that eclipses can distort the statistical tendency ... and this may be one of those times.

I mentioned last weekend during a brief discussion about Mercury Retrograde that ... "What normally happens with stock markets when Merc goes Rx is that it starts a trend which goes into reverse halfway through the period. That would mean a potential trend change date on the 16th ..."

So, because Pollyanna is hitting Support levels - technical, Fibonacci, or planetary - on monthly, weekly and daily charts, we need to be aware of the potential for a bounce to develop in the coming week.

And, perhaps especially, because other major indices didn't go into the same sort of overly dramatic swoon as Miss Pollyanna.

Below is the Footsie Weekly Planets chart. The index traded within largely the same range as it has been for many weeks.
click to view larger image

Ditto for Germany's DAX index, below. In both indices, there was a break of planetary support which was recovered by the end of the week. The only note of caution - apart from the continued deterioration of the MACD signal - is the appearance of Bearish engulfing bars.
click to view larger image

Singapore is below, still deciding whether to bounce from, or breakdown below, a vital Neptune line at 2995.
click to view larger image

And the Hang Seng in Hong Kong dived into a Saturn level on its Weekly Planets chart (below).
click to view larger image

The ASX 200 basically didn't go anywhere and continues to hold Uranus support at 4450ish.

click to view larger image

In signing off last weekend, I said: "Regardless of what happens on Tuesday, have at least some faith in the Old Gods. In Bulls and Bears, through Goldmanesque manipulation and BenDraghi interventions, the pulse of the markets beats to coloured spaghetti trails marked by the passage of planets."

Eh. And so they did. Again. As usual. Of course, we're all educated adults and we don't actually believe in astrology and Old Gods. Do we?!?

Enough of the waffle for this week. Don't be surprised by an imminent bounceback. Virtually no major markets other than Wall Street rose so far back into irrational exuberance territory before the correction started; virtually no major markets have swooned as much as The Vacuous Troll, Pollyanna.

And, regardless of which way things go, the charts published last weekend and this one show the probable range targets - upside and down.

Oh! Thank you to Praveen and Andy, who wrote with suggestions about where to find data for those indices Yahoo has dropped from its historical price data. I'm not terribly good at formatting spreadsheets and need to fiddle with date formats and a few other things.

However, hopefully I'll be able to bring the Indian and Canadian market charts up-to-date when I get it all sorted out.

Safe trading - RA

Randall Ashbourne
Astrological Investing's associate, Randall Ashbourne, author of the eBook, The Idiot and The Moon, writes a free weekly column titled, The Eye of Ra on his web site in  which he explains the potential impact of astrological aspects and the current state of technical conditions. Ashbourne's charts are revealing illustrations of exactly what has occurred in the market and the probability of what to expect.
Important reading:  Randall Ashbourne's article, Jupiter's cycle and its effects on Wall Street and a posting of the weekly Eye of Ra report in this blog, titled A look at the Venus Retrograde effect
(Disclaimer: This article is not advice or a recommendation to trade stocks; it is merely educational material.)
Copyright: Randall Ashbourne - 2011-2012

Saturday, November 3, 2012

November price ranges for indices

Randall Ashbourne, an associate of Astrological Investing, posts a weekly market report on his web site, theidiotandthemoon.com The following is this weekend's Eye of RA report: Week beginning November 5, 2012

The USA goes into election mode this week with neither the incumbent nor the challenger clearly ahead.

And with the Old Gods' messenger, Mercury, going into Retrograde mode on election day, there's every chance the result will be murky.

Already, lawyers for both camps are ready to roll in key swing States like Ohio, Florida and Virginia.

What normally happens with stock markets when Merc goes Rx is that it starts a trend which goes into reverse halfway through the period. That would mean a potential trend change date on the 16th - the day Mars changes signs from Sagittarius to Capricorn and starts making its own aspects to the ongoing Uranus/Pluto square.

We saw it in action last week when Venus made Uranus/Pluto aspects and Superstorm Sandy wreaked havoc, forcing a 2-day closure of the NYSE.

It would take a much better astrologer than I to accurately predict what to expect in the coming week ... and I'm not going to try.

Instead, we will go through the exercise we did early last month and concentrate on defining the probable range for the month ahead.

It will be a critical month because the Dow is flirting with a trendline vital to continuation of the Bull run. Failure to hold it would most likely be confirmation that the next Bear has emerged.

This is normally the time of year, with the Sun moving towards the optimistic sign of Sagittarius, that kicks off the Santa Claus rally.

But, the entrails aren't looking so good. As we can see on the chart above, the DJI has declined into the trendline drawn from last year's August/October plunge to the June correction low ... and neither the fast MACD nor the long-range Canary is looking happy.

And the more broadly-based SP500 continues to play at the pointy end of what we've discussed a few times in the past few months as being a likely Ending Diagonal pattern ... which is extremely Bearish once the downside of the wedge is penetrated decisively.

There is, as yet, no clear and obvious negative divergence from Pollyanna's long-range Canary (the blue line). We have been watching and waiting for a lower peak to occur in that oscillator simultaneous with a higher price high to give the sort of warning it gave at the 2007 Bull top.

Nevertheless, the warning signs are there. Both the short-term (green) and intermediate-range Canaries (red line) have already diverged negatively. Just as they did when Wall Street was topping at the end of the previous Bull run. The danger continues to build.

Now, let's take a look at planetary charts for various indices to gauge the probable price ranges for November.

October turned out to be the first negative month for Pollyanna since May. But, price was largely contained within the range defined by two Neptune lines on her long-range planetary chart. We've discussed this chart fairly frequently and the implications are obvious.

If there's going to be a Santa Claus rally into the end of the year, the probable targets are 1522 or 1562. And if the index breaks down, rather than breaks out, all the major downside stalling points are listed.

For the moment, Polly needs to hold the 1410 level ... and the Nasdaq 100 needs to continue holding the Uranus line around 2650.

The NDX pretty much did last week what it did the week before ... minor breaks of the Saturn/Uranus planetary price lines, but finishing the week with price contained within the barriers.

If there's a Nasdaq breakdown this month, 2443 seems the most likely target. If it's breakout, it'll be 2940 and above by the end of the year.

Germany's DAX index is above, having spent the past 2 months in a trading range, with the downside routinely stopped by the Old God of boundaries, Saturn. From a technical viewpoint, the odds probably favour a Bullish flag pattern - with one rally left.
Last weekend, we discussed once again the potential rally signal in the FTSE as it declined into the influence of a rising Sun line.

 A bit wobbly on Wednesday, but it worked for the FTSE, even if not as a pointer to what might happen on Wall Street.

 It'll open next week with downward pressure from a falling Sun line.

And which of the two influences it decides to follow is likely to be impacted by what happens with the elections in America.

The FTSE Weekly Planets chart is below, showing the price targets likely to be hit this month, regardless of the direction of the break. A break which is highly likely given the number of weeks the FTSE has been trapped in a narrow range.

Our next chart, below, is for India's Nifty 50. It is actually missing a couple of weekly bars because Yahoo Finance has now dropped historical price coverage for that index, as well as for the Canadian indices and the DJI. I'd like to continue coverage of the Indian markets, so if any readers from Mumbai know where I can find replacement data, please drop me a line under the "contact" button in the main navigation menu.

For the moment, the Nifty is still trading the 5690s range highlighted the last time I published this chart in early October.

The Singapore exchange is above. Technically, it is trying to base on top of the previous consolidation, which tracked that grey Neptune line currently priced just a tad below 3000. You can see it also has a tendency to use the Saturn lines as a base and I've used those lines to try to define the probable November range. The upside Resistance is in the mid 3200s and the "normal" downside would be around 2953.

The Hang Seng has been on a roll, taking its cues from a potential bottoming pattern in the Shanghai composite. You can probably calculate the price of the Saturn lines by just using a crosshair to previous price bars, but I've marked the likely upper limit at 23,590.

I think I'm also missing data now for the Shanghai Composite index, charted below, so the full range of the last couple of price bars is probably inaccurate.

However, the data I have still suggests China is trying to bottom. The oscillator is trying to creep back into neutral territory - and with some Bullish divergence; not just in the short-term either. The oscillator bottomed out at a higher trough during the recent price lows, compared with its performance in September, 2011 ... when price was actually several hundred points higher.

And finally, Auntie - the ASX 200.

So, just to recap briefly. The danger continues to grow in the major American indices and the astrological weather ahead continues to mirror what the actual weather was like on the US East Coast last week. In fact, it could get a lot worse later in November when Mars sets off the Uranus/Pluto discord again.

Regardless of what happens on Tuesday, have at least some faith in the Old Gods. In Bulls and Bears, through Goldmanesque manipulation and BenDraghi interventions, the pulse of the markets beats to coloured spaghetti trails marked by the passage of planets.

All we really need to know is where the milestone markers are. And now you have them!

Safe trading - RA

Randall Ashbourne
Astrological Investing's associate, Randall Ashbourne, author of the eBook, The Idiot and The Moon, writes a free weekly column titled, The Eye of Ra on his web site in  which he explains the potential impact of astrological aspects and the current state of technical conditions. Ashbourne's charts are revealing illustrations of exactly what has occurred in the market and the probability of what to expect.
Important reading:  Randall Ashbourne's article, Jupiter's cycle and its effects on Wall Street and a posting of the weekly Eye of Ra report in this blog, titled A look at the Venus Retrograde effect
(Disclaimer: This article is not advice or a recommendation to trade stocks; it is merely educational material.)
Copyright: Randall Ashbourne - 2011-2012

Saturday, October 6, 2012

What's stopping Pollyanna from rising

Randall Ashbourne, an associate of Astrological Investing, posts a weekly market report on his web site, theidiotandthemoon.com The following is this weekend's Eye of RA report: Week beginning October 8, 2012
 Gloom Boom & Doom guy, Marc Faber, says he has moved to cash in anticipation of a looming 20% plunge in Wall Street stocks.

When? Sometime in the next 6 months. That's a long time to spend nursing an ulcer and gnawing on fingernails.

So, we'll spend a little time in the first part of this weekend's edition having a close look at the planetary price barriers blocking Miss Pollyanna's efforts to break above the 1460s.

We're in the lunar phase period now between the 3rd Quarter Moon and the New Moon and early in the coming week the Sun will trine Jupiter and Venus will trine Pluto; all together, three astrological signatures with the potential positive energy to allow an upside breakout.

But first, the broad-based SP500 has to overcome strong Neptune resistance at the 1468 level. We'll have a look in a moment at why Miss Polly has been having trouble at that level ... and some hints from Friday's price action that she could continue to have trouble, in spite of the positive astro energy.

Faber believes the American markets - and many individual stocks within those markets - have peaked. He may be right and I confess I expected markets to top out much earlier in the year.

However, markets continue to defy Bearish expectations - which is why we continue to take it step-by-step, considering the upside potential, as well as the downside; and, most importantly, watching closely for any warning signs from croaking Canaries.

Now that we have some October price action to display, let's begin with another look at my long-range Old Gods chart for the SP500.
click to view larger image

We've anticipated that the dotted Neptune line at 1468 would provide strong resistance to further gains in Miss Pollyanna, because of the role it played, along with the Pluto line now priced at 1522, in the topping process of the 2007 Bull peak.

But, we've also been discussing the lack of negative divergence in certain technical oscillators, expecting that a breakout above 1468 could well be a "probable", rather than merely a "possible".

So, let's take a closer look at what's happening with the 500 in relation to the planetary portents.

It's obvious from the long-range Old Gods chart above that the index is having another go at challenging Neptune's power. And since that chart is a monthly, it gives us a pretty good idea of the likely price range for October - whether it's breakout or breakdown.

We all know from the Weekly Planets charts for various indices that meetings with the cyan Saturn lines are always a reliable stopper and frequently turn out to be a weekly High or Low.

On Friday, Mercury had a meeting with Saturn, forming a "price crossing point". What normally happens with these points is that if price breaks through and Closes above the exact level, it sets the stage for a rally boost.

On the other hand, if price rises into the exact level and then backs away, the odds increase that an important target peak has been hit - and the immediate path ahead is downwards.

Friday's price action suggests this is what has happened ... and the negativity is strengthened because the block shows up in both directions.

click to view larger image
The Chart above shows the index running into trouble and back off from a rising Mercury/Saturn price Crossing.

The chart below shows that the price crossing point is doubly significant because it also shows up as a falling Mercury/Saturn level.

And, we can see that the grey Neptune barrier marked on the long-range Old Gods chart is integrated into the configuration.

click to view larger image

So, it's going to take a big boost very early in the coming week to break that triple barrier. Otherwise, Miss Polly may have to vacate the stage for one of Chicken Little's appearances.

In normal circumstances, the omens from these three charts would convince me to Short the 500 big time ... for at least a short time.

Central Bank interference, the generally positive lunar phase, and the fact the Americans are on election countdown might throw a spanner in the works and distort what is normal.

However, there is a fairly obvious Stop Loss level.

The FTSE Weekly Planets chart is below and even though it's a weekly, shows what will probably turn out to be the Highs and Lows for October.

click to view larger image

And the chart below is the DAX Weekly Planets.
click to view larger image

Okay, I think there's enough information in those charts for Americans and Europeans to make a decision about what they do for October, so we'll change hemispheres.

Last weekend, I republished a very simple chart for Auntie, the ASX200, and said:

"I display this chart once again as an example of just how simple - and informative - a chart can be without having to rely on expensive software. It actually flies in the face of the omens from the NDX. The downtrend angle has been broken and the long-range Canary is suggesting further upside ..."

Well, it did fly in the face of the alarm bells going off in the NDX chart and not only met its target, but exceeded it.
click to view larger image

And the bad news for the Bears is ... the long-range Canary loves it, loves it, loves it! Despite the low level of last week's High, the oscillator is putting in its best performance since the 2009 Bear bottom. Of course, it might not actually end October looking that way!

The 4758 target seems both difficult and unlikely, in spite of the oscillator ... so let's look at some less-daunting targets.

click to view larger image

There is an obvious double-Fibonacci barrier not far north of the current price action. While the oscillator is not quite as gleeful on the weekly as it currently displays on the monthly, it's certainly strong enough to suggest those Fibonacci levels are likely to be challenged.

click to view larger image

And the Fibonacci targets are endorsed, too, by Auntie's Weekly Planets chart. I mentioned earlier the importance of the cyan Saturns on the Weekly Planets charts for various indices - and we can see they were in play last week on the ASX200. The more important key to Auntie's likely range for the month is the two Uranus levels, currently at 4560 and 4437.

Now, I really want to take a look at Shanghai, even though China has been on holiday, because there's a chance the main index there may be bottoming - and that might explain the optimism evident in the ASX200.
click to view larger image

We've already discussed the importance of Saturn lines. In astrological mythology and symbolism, Saturn sets boundaries. What is significant, well potentially significant, on the chart of the Shanghai index is the thick Saturn line. Over on the far left, we can see this capped prices until it was broken and the index launched into a massive blow-off.

Then, it became important again - acting as the bottom stop on the plunge which followed the blow-off. Now, it's reacting again to that same primary Saturn boundary.

click to view larger image

The chart above is a weekly, zooming-in on the price action from the Bear plunge to now. The main Old Gods players for Shanghai are Saturn, Uranus and Neptune. We have some mild positive divergence in the current state of the oscillator, suggesting the main Chinese index is going to make a solid attempt at regaining the territory above the primary Saturn line.

If it can do it, it opens the potential for a fast and significant rally. The current blockage is priced between 2092 and 2106. Breaking through the restriction, opens a probable target of 2406 before further major consolidation.

The Hang Seng is in a similar position.
click to view larger image

The MACD is not displaying a lot of internal oomph; but if price can get on top of the Saturn/Neptune barriers it does open up 24,000 as a likely target.

Singapore, the Straits Times Index, is below ... and it appears to have already started the move; though it's MACD signals are also giving signs of wanting to croak.
click to view larger image

Our final chart for this weekend is India's Nifty. The index spent a couple of weeks gathering strength at the 5690s level, listed as a target in the Eye a few weeks ago ... and now has a potential target of 6000 in sight, given the apparent strength of its MACD signal.
click to view larger image

My apologies for not returning to the Canadian indices this week; I'll try next week.

Okay, we've been through a fair bit of territory this weekend. We have a number of indices perking up and finally starting to put on a spurt - with some charts suggesting Wall Street won't be one of them without some form of Benzedrine boost to get Pollyanna above 1468.

However, I've tried to include as many charts as I can indicating the probable range that will be traded in various indices over the remainder of the month.

Safe trading - RA


Randall Ashbourne
Astrological Investing's associate, Randall Ashbourne, author of the eBook, The Idiot and The Moon, writes a free weekly column titled, The Eye of Ra on his web site in  which he explains the potential impact of astrological aspects and the current state of technical conditions. Ashbourne's charts are revealing illustrations of exactly what has occurred in the market and the probability of what to expect.
Important reading:  Randall Ashbourne's article, Jupiter's cycle and its effects on Wall Street and a posting of the weekly Eye of Ra report in this blog, titled A look at the Venus Retrograde effect
(Disclaimer: This article is not advice or a recommendation to trade stocks; it is merely educational material.)
Copyright: Randall Ashbourne - 2011-2012