Wednesday, June 19, 2019

It is with unbearable sadness I write of Randall Ashbourne's passing Monday, June 17, 2019.


For us who knew him through his astrological work, Randall will be remembered for his brilliant mind - his wit, humor, and his remarkable and uncanny insight into financial astrology. 

Author of  The Idiot and The Moon, Randall was a former journalist and a controversial figure in South Australian state politics.

Known as a man of enormous integrity and strong principals, for me, and all those who knew him, Randall Ashbourne will be deeply missed. There was no one like him.  I am devastated.

He died at home after a long illness.

RIP dear Randall

Monday, October 2, 2017

The Idiot and the Moon

Information is not Knowledge – and Knowledge is not Wisdom -Einstein/Kappa


Excerpt from The Idiot & the Moon, by Randall Ashbourne

INTRODUCTION: "The last thing I learned was the first thing I knew.
Somewhere between then and now, I’d forgotten – drowned in a daily deluge of data and information, cunningly disguised as knowledge.

But, it was not. It was a long way from being knowledge and farther still from being wisdom.
So, this book is an attempt to begin at the beginning – at least so far as stock trading is concerned. And we begin with just two thoughts:
· ALWAYS protect your capital
· I am NOT as smart as I think I am
It’s not a big book, but I hope it distills many years of information accumulation into a taut collection of useful knowledge that you, in turn, may be able to convert to trading wisdom.

Its primary purpose is to outline the rules of a simple trading system – a system so simple and so easy to follow that I call it: The Idiot.

It will take only a few minutes of backtesting on your part to see that it does work; it will protect your capital; it will deliver enormous profits without agonising, analysis, or angst; it will limit your losses; and it will prove itself to be a lot smarter than you think you are.

But wait … there’s more.  As they say in the tackier TV commercials.

I will also outline the details of a Lunar Cycle trading system that will also help you to make profits and to avoid costly mistakes. And I will show you advanced and original techniques using unique planetary software to determine the probable start and finish prices of intermediate and long-term moves in some of the world’s most widely-traded stock indices.

And I will show you how to make the most use of some simple technical indicators, unlike some others who tell you what they are, but not how to tweak them and interpret their signals and secrets.

The book is written for those who, like me, forgot the first thing they knew – but, also, for everyone just starting out learning how to trade stock markets.

The simple truth is that most traders lose money. If you remember the first two thoughts and learn to follow The Idiot, or even only The Moods of the Moon, you will not be one of them."
- RA
***

Orders are processed manually.  
Please allow time to receive your email to download your eBook. Thank You!

NOTE! The Idiot & The Moon is a password and print protected eBook formatted for "READ ONLY" in the popular Adobe PDF format.  IT CAN NOT BE PRINTED - IT MUST BE READ ON A COMPUTER, TABLET, OR OTHER TYPE OF ELECTRONIC DEVISE.  You will be able to transfer the downloaded PDF file into your iTunes library and read it in iBooks on your iPad or similar device that reads Adobe formatted PDF's. And you will be able to highlight key sections or add "sticky notes" to the file.

Friday, September 29, 2017

Purchase Munkasey's Company Data Base

Click to request to order The Company Database, by Michael Munkasey

Michael Munkasey's Company Information

Looking for information on companies listed on major U.S. stock exchanges?  Want to know when and where company XYZ was incorporated?  Perhaps even their TIME of incorporation?  Want to know when and on what exchange company GHIJ first traded?  Perhaps, even, their TIME of that first trade?   Want to briefly know a company's line of business?  Their correct corporate title (name)? Their trading symbol and exchange?  Then, look no further.   You can have access to such information now.

The Michael Munkasey company data base contains over 11,900 entries of public companies traded on the NYSE, AMEX or NASDAQ. Listings include both incorporation and first trade information. The company information is presented in a Microsoft Excel Spreadsheet, which allows for sorting by any column of information in an easy and rapid way.  Typical entries show the company's active trading symbol, the exchange, the official name of the company, the date of incorporation (and time if available), the state of incorporation, the date of first trade, and time of first trade (if available), and a short history of the company's business, history, and trading activity.  

Here are two samples of the information you will find -- written out, as in the data base some abbreviations (all written out here) are used:


HPQ           N           Hewlett-Packard Company           elm           s
02/11/1998                  1600             DE           05/06/2002           0930           Ns

Designs, makes computer systems, printers, measuring instruments; Prior incorporation in: CA, 08-18-1947; filed with CA on 04-28-1998 that it is now a DE corp.; contentious vote to merge with Compaq Computer made on 03-19-2002; merger agreement was initiated on
09-04-2001; Prospectus outlining the merger was dated 02-05-2002; major merger official on: 05-07-2002, but the merger was effected on 05-03-2002; Os: HWP on the NYSE, first traded: 03-17-1961.


All dates are in shown in a Month - Day - Year format elm = the industry code for this company s = the incorporation data was verified by the state Ns = the trading symbol shown is a new symbol as the company traded on an Os (older symbol) before that Os = Old symbol - a prior ticker symbol but no longer in use DE = the state of Delaware CA = the state of California PN = Prior Name NC = Name Change FT = First Trade

The first date is the incorporation date (and time too!); and the second date is the first trade date (and time too) for the symbol HPQ on the NYSE.

Another Company: (this entry is shown closer to its actual data base format entry -- the abbreviations shown are correlated above -- without using abbreviations -- which are repeated frequently -- the amount of verbiage for each entry would really take up a LOT of room!)

ENA           A           Enova Systems, Inc.                ela               s
07/30/1976                     - -            CA        08/29/2006       0930         L

Makes commercial digital power management systems for controlling electric power; Os: ENOV on OtcBB, FT: 07-22-2005; Os: ENVA on OtcBB, FT: 10-11-2000; Os: ECAR on OtcBB, FT: (?); PN: U.S. Electricar Inc., NC: 10-11-2000


There are over 12,000 entries in the data base like these.


Each company is presented in a stylized format, along with the commentary and history of their stock symbol, merger, name change and similar activity.


Be aware though that company information changes rapidly.  Companies merge or go out of business, companies change names, companies change exchanges and trading symbols. There may be hundreds of such changes each month.  The list you received only six months ago may be as much as 40% to 50% out of date. The list you receive from me today is current through this week.  I maintain two sets of data: actively traded companies, and companies which are no longer actively traded on the NYSE, AMEX, or NASDAQ -- but which may be traded on the Otc.  These are kept separate for readability purposes. 

Michael Munkasey's work has been an invaluable asset to the astrological community.  In May 2008, Michael Munkasey received the Marion D. March Regulus Award for Discovery and Innovation and Research - an award that recognizes those who have developed new tools or concepts to advance the study and practice of astrology.

The Company Database,
by Michael Munkasey

$365.00  CD
shipping not included to non-USA addresses*.

Click to request to order The Company Database, by Michael Munkasey


Purchase the latest update to your Company Database,
by Michael Munkasey, please email and include your name, address and ID# found on the CD.

$145.00
shipping not included to non-USA addresses.* 
                          Click to request update of  The Company Database, by M. Munkasey


Purchase Randall Ashbourne's Idiot and the Moon

Orders are processed manually. 
Please allow time to receive your email to download your eBook. Thank You!

 Astrological Investing Offers
Purchasing directly from our blog pages

The Idiot & the Moon
by Randall Ashbourne

"The Idiot" will tell you "precisely what to watch for so you can let your profits run safely and exactly when you need to cut your losses and get out fast."- Randall Ashbourne


Orders are processed manually.  Please allow time to receive your email to download your eBook. Thank You!

NOTE!The Idiot & The Moon is a password and print protected eBook formatted for "read only" in the popular Adobe PDF format. IT CAN NOT BE PRINTED - IT MUST BE READ ON A COMPUTER, TABLET, OR OTHER TYPE OF ELECTRONIC DEVISE.  You will be able to transfer the downloaded PDF file into your iTunes library and read it in iBooks on your iPad or similar device that reads Adobe formatted PDF's.And you will be able to highlight key sections or add "sticky notes" to the file.

This is a short and simple, yet serious book that promises to increase your profitability and reduce your trading losses in the market using a unique trading tool Randall Ashbourne calls "The Idiot".

In his book, The Idiot & the Moon, Randall shares the method he has developed over years of trading with us.  Additionally, he shows us how to combine his "Idiot" method to profitably trade the stock market using lunar phases, (New Moon, Full Moon, First and Quarter cycles) with technical tools and astrology. 


Information is not Knowledge – and Knowledge is not Wisdom -Einstein/Kappa


Excerpt by Randall Ashbourne

INTRODUCTION: "The last thing I learned was the first thing I knew.
Somewhere between then and now, I’d forgotten – drowned in a daily deluge of data and information, cunningly disguised as knowledge.

But, it was not. It was a long way from being knowledge and farther still from being wisdom.
So, this book is an attempt to begin at the beginning – at least so far as stock trading is concerned. And we begin with just two thoughts:
· ALWAYS protect your capital
· I am NOT as smart as I think I am
It’s not a big book, but I hope it distills many years of information accumulation into a taut collection of useful knowledge that you, in turn, may be able to convert to trading wisdom.

Its primary purpose is to outline the rules of a simple trading system – a system so simple and so easy to follow that I call it: The Idiot.

It will take only a few minutes of backtesting on your part to see that it does work; it will protect your capital; it will deliver enormous profits without agonising, analysis, or angst; it will limit your losses; and it will prove itself to be a lot smarter than you think you are.

But wait … there’s more.  As they say in the tackier TV commercials.

I will also outline the details of a Lunar Cycle trading system that will also help you to make profits and to avoid costly mistakes. And I will show you advanced and original techniques using unique planetary software to determine the probable start and finish prices of intermediate and long-term moves in some of the world’s most widely-traded stock indices.

And I will show you how to make the most use of some simple technical indicators, unlike some others who tell you what they are, but not how to tweak them and interpret their signals and secrets.

The book is written for those who, like me, forgot the first thing they knew – but, also, for everyone just starting out learning how to trade stock markets.

The simple truth is that most traders lose money. If you remember the first two thoughts and learn to follow The Idiot, or even only The Moods of the Moon, you will not be one of them."
- RA
***

Orders are processed manually.  Please allow time to receive your email to download your eBook. Thank You!

NOTE! The Idiot & The Moon is a password and print protected eBook formatted for "READ ONLY" in the popular Adobe PDF format.  IT CAN NOT BE PRINTED - IT MUST BE READ ON A COMPUTER, TABLET, OR OTHER TYPE OF ELECTRONIC DEVISE.  You will be able to transfer the downloaded PDF file into your iTunes library and read it in iBooks on your iPad or similar device that reads Adobe formatted PDF's. And you will be able to highlight key sections or add "sticky notes" to the file.

Return to main blog posts https://astrologicalinvesting.blogspot.com/

Monday, February 20, 2017

Michael Munkasey's Company Database

About The Company Database, by Michael Munkasey

Michael Munkasey's Company Information

Looking for information on companies listed on major U.S. stock exchanges?  Want to know when and where company XYZ was incorporated?  Perhaps even their TIME of incorporation?  Want to know when and on what exchange company GHIJ first traded?  Perhaps, even, their TIME of that first trade?   Want to briefly know a company's line of business?  Their correct corporate title (name)? Their trading symbol and exchange?  Then, look no further.   You can have access to such information now.


The Michael Munkasey company data base contains over 11,900 entries of public companies traded on the NYSE, AMEX or NASDAQ. Listings include both incorporation and first trade information. The company information is presented in a Microsoft Excel Spreadsheet, which allows for sorting by any column of information in an easy and rapid way.  Typical entries show the company's active trading symbol, the exchange, the official name of the company, the date of incorporation (and time if available), the state of incorporation, the date of first trade, and time of first trade (if available), and a short history of the company's business, history, and trading activity.  


Here are two samples of the information you will find -- written out, as in the data base some abbreviations (all written out here) are used:


HPQ           N           Hewlett-Packard Company           elm           s
02/11/1998                  1600             DE           05/06/2002           0930           Ns

Designs, makes computer systems, printers, measuring instruments; Prior incorporation in: CA, 08-18-1947; filed with CA on 04-28-1998 that it is now a DE corp.; contentious vote to merge with Compaq Computer made on 03-19-2002; merger agreement was initiated on
09-04-2001; Prospectus outlining the merger was dated 02-05-2002; major merger official on: 05-07-2002, but the merger was effected on 05-03-2002; Os: HWP on the NYSE, first traded: 03-17-1961.


All dates are in shown in a Month - Day - Year format elm = the industry code for this company s = the incorporation data was verified by the state Ns = the trading symbol shown is a new symbol as the company traded on an Os (older symbol) before that Os = Old symbol - a prior ticker symbol but no longer in use DE = the state of Delaware CA = the state of California PN = Prior Name NC = Name Change FT = First Trade


The first date is the incorporation date (and time too!); and the second date is the first trade date (and time too) for the symbol HPQ on the NYSE.


Another Company: (this entry is shown closer to its actual data base format entry -- the abbreviations shown are correlated above -- without using abbreviations -- which are repeated frequently -- the amount of verbiage for each entry would really take up a LOT of room!)


ENA           A           Enova Systems, Inc.                ela               s
07/30/1976                     - -            CA        08/29/2006       0930         L

Makes commercial digital power management systems for controlling electric power; Os: ENOV on OtcBB, FT: 07-22-2005; Os: ENVA on OtcBB, FT: 10-11-2000; Os: ECAR on OtcBB, FT: (?); PN: U.S. Electricar Inc., NC: 10-11-2000


There are over 12,000 entries in the data base like these.


Each company is presented in a stylized format, along with the commentary and history of their stock symbol, merger, name change and similar activity.


Be aware though that company information changes rapidly.  Companies merge or go out of business, companies change names, companies change exchanges and trading symbols. There may be hundreds of such changes each month.  The list you received only six months ago may be as much as 40% to 50% out of date. The list you receive from me today is current through this week.  I maintain two sets of data: actively traded companies, and companies which are no longer actively traded on the NYSE, AMEX, or NASDAQ -- but which may be traded on the Otc.  These are kept separate for readability purposes. 

Michael Munkasey's work has been an invaluable asset to the astrological community.  In May 2008, Michael Munkasey received the Marion D. March Regulus Award for Discovery and Innovation and Research - an award that recognizes those who have developed new tools or concepts to advance the study and practice of astrology.

The Company Database,
by Michael Munkasey

$365.00
shipping not included to non-USA addresses*.


To purchase the latest update to your Company Database,
by Michael Munkasey, please email and include your name, address and ID# found on the CD.

$145.00
shipping not included to non-USA addresses.*


Sunday, May 15, 2016

Yogi, Boo Boo, or Gummy - pick a Bear!

Randall Ashbourne, an associate of Astrological Investing, posts reports and articles on his web site at  theidiotandthemoon.com   The following is the Eye of RA report for May 15, 2016 
Since January we've been chatting about a new Bear ... one which rapidly mauled 20% out of some markets, but has been more like a soft-chew gummy bear on the major Wall Street indices.
So, we'll spend some time in this edition of the Eye taking a look at just what sort of Bear we're dealing with.

And whether it's a real Bear, or a Bull that dressed up as one to play mind games with us!

In the last edition, in April, I indicated the potential negative impact of Mars going retrograde, something the planet does every couple of years, but which can be particularly dangerous when it occurs while markets are in a topping phase.

Mercury is also now a little over midway through one of its regular retrograde periods, often a time when prices change course every few days and it's difficult to get an accurate reading on what to expect next.

The Reserve Bank of Australia is the latest of the central banks to cut interest rates and there is talk it, too, is headed to the negative interest rate area.

And there's the problem ... because it makes stocks the only "growth" option.

The desperate search for yield is having different impacts on different markets. We'll begin the analysis with a look at Wall Street's main trading index, the SP500.

In the last edition, I explained the impact of Mars, the planet which symbolises drive and energy, on the price of stock indices and how the 500 (as well as other indices) rises over time very much in-step with the angle of Mars' travels through our solar system. Scroll down to April's blog if you need a refresher.

In our first chart, I'll reiterate the "drive" on a weekly chart. Looking from left-to-right, we can see that almost all of the price action since the last Bear bottom in 2009 has been contained within a rising channel between two Mars price lines placed 360 degrees apart.
There have been three downside breaks of that channel, with Pollyanna recovering each time to claw her way back inside the rising channel. The next chart shows the most recent action and narrows the Mars lines down to 90 degrees, as well as including the falling channels.

The 360 degree channel of the first chart is marked by the thicker red lines in this one and we can see how the 500 has been slowly dropping since Mars went Rx a few weeks ago. It is still trying to cling to the support that channel provides.
And while Mars tends to dictate the angle of rises and falls, it tends to be the price lines of the slower-moving outer planets which set the more horizontal levels of support and resistance. In the February 7 edition, Waiting for the dead cat to bounce, I said: "It is possible a rebound could take price all the way back to the 2080s." The index went a little above the 2087 level for a few days before being repelled by a falling, primary Mercury line (pink). In theory, the rally on Wall Street should be over, done and finished.
We'll turn now to the top two European indices ... the DAX and the FTSE. Both certainly appear to be well within the grip of a real Bear. The DAX has fallen out of a long-range Pluto/Neptune price cluster and hasn't been able to score a close inside it for the past 5 months.

Its Big Bird oscillator, the 50 CCI, is in Bear mode without even a hint of positive divergence suggesting a sustained rebound.
Instead of using planetary prices for the FTSE we'll use a couple of really simple technical lines ... the rally angle and a black horizonal line of support and resistance.

The FTSE has not closed below that black line, despite the spikes down, for many months. And that's one reason I remain more than a tad cautious about the exact nature of this Bear. The FTSE is finding support on TOP of the line, rather than consolidating below it.
And what makes me cautious is that price is not following the patttern Big Bird established during the 2007-2009 crash. Yes, this Bear also took a huge bite out of the index on its first decline ... but lately has morphed into some sort of gummy bear. Normally, when the oscillator drops but price simply goes sideways, it is a preliminary warning that the oscillator is just readying itself for another rally surge.

And I've been getting the same sense of real caution on the ASX 200. This index slumped more than 20% in 11 months from April last year and Big Bird started a death dive much the same as it did after the previous Bull peak.

But something odd is happening. Big Bird's dive has been constantly stalling, something it did not do during the crash into 2009.
We can also see it in the performance of all three Birds on the weekly chart below. The rebound hasn't been able to climb and stay above the 50% retrace level ... but the performance of the red Medium Bird and the blue Big Bird strongly suggest the index is not finished trying to do exactly that.

The only negative divergence here is in the green Fast Bird, which indicates only short-term resistance.
So, overall, my impression is that we are probably still wrapped in the claws of a very nasty and quite long-range Bear.

But, there are a few caution flags warning us not to get so certain of that as an imminent outcome ... and to be gently aware that Yogi and Boo Boo are taking time out for a picnic!

Safe trading - RA

Randall Ashbourne (Disclaimer: This article is not advice or a recommendation to trade stocks; it is merely educational material.)
Copyright: Randall Ashbourne - 2011-2016


The Idiot and the Moon, eBook, available for purchase

Sunday, April 10, 2016

Will Mars hit the brakes on stock rally?

Randall Ashbourne, an associate of Astrological Investing, posts reports and articles on his web site at  theidiotandthemoon.com   The following is this weekend's Eye of RA report: Week beginning April 10, 2016 
Stock trading is likely to become a lot more volatile in the next few weeks

In the past two editions, I outlined the price targets and potential time turns for what seemed likely to be no more than a significant dead cat bounce within a new, long-term Bear market.

Now that the probable targets have been hit, I wish to talk, just a little, about The Spooky Stuff.

Mars, the planet of drive and energy, goes retrograde next weekend until late in June. Mercury, which deals with thinking and communicating, goes retrograde on April 28 for about a month.

Long-term readers know that any trend which starts within a day of two of Mercury going Rx is likely to reverse course again about 1.5 to 2 weeks later; And that we're prone to making mistakes, so need to double-check before hitting the Buy or Sell buttons.

Mars is another matter entirely. The symbolism is simple: Mars is Drive; when the planet goes Rx, Drive slips into Reverse.

It doesn't happen every time. But. If the circumstances are in place, that slipping of the gears from Drive into Reverse can see indices backing off a cliff!

Below is a monthly chart of Pollyanna, the SP500. As I've remarked many times, Polly moves up and down within Martian channels. If we look at the Bull peaks in early 2000 and late 2007, we can see the big Mars channels which defined the overall angle of the entire Bull runs.

And we can see the same impact almost all the way through the 2009 to 2015 Bull market. Now, note those little "blips" along the lines ... they're the retrograde periods. In the two previous Bears, prices slipped out of the main rising channels ... and started to crash badly when Mars Rx came along. Those two instances are marked with the yellow ovals.

And we can see from the current price position of the index, such a danger period is now immediately ahead of us. It is not guaranteed, of course. But if it does take hold, the index tends to fall sharply down declining Mars channels, even more easily than it climbs the rising channels. You can see the impact during the two previous Bear markets.

In the last edition, Dead cat bounce nears its likely peak,(click or scroll down to March 13, 2016 post) I indicated that I expected the SP500 to hit a Saturn line, then priced around $2049, but that while that might signal the "price" target, it was unlikely to satisfy the "time" component. In fact, I was a tad mean with the $2049 price tag. When I shifted to a daily chart, Saturn was around $2056 by the time the daily bars hit it. After making first contact, the index backed off before aiming for a gap breakout. At this stage, still a "false" breakout ... because the index is back down to play with the primary Mars line.

Miss Polly isn't the only index driven up and down by Mars channels. Despite some positive divergence in the oscillators at the time of writing the March edition, the ASX 200 hit the lower limits of the weekly price targets I showed then ... and, instead of hanging around to fill in "time", as Polly did, it just started sliding down a primary Martian channel ... making its actual Highs and Lows very close to long-range Neptune price lines (grey on the chart below).
 That does leave the ASX more than a little vulnerable to further falls ... especially if Mars has a Bearish impact during this Rx period. You can see on the weekly planets chart below the index continues to hit those lines regularly during multi-week moves.

A drop below the blue Saturn lines, right where it finished last week, leaves a large hole to fall down.

Safe trading - RA

Randall Ashbourne (Disclaimer: This article is not advice or a recommendation to trade stocks; it is merely educational material.)
Copyright: Randall Ashbourne - 2011-2016


The Idiot and the Moon, eBook, available for purchase

Saturday, March 12, 2016

Dead cat bounce nears its likely peak

Randall Ashbourne, an associate of Astrological Investing, posts reports and articles on his web site at  theidiotandthemoon.com   The following is this weekend's Eye of RA report: Week beginning March 13, 2016 
In the last Eye of Ra, on February 7, I predicted a dead cat bounce in major stock markets was imminent.

Five weekends later, we need to go into ultra-cautious mode yet again because that bounce is probably very close to hitting its peak ... in Price, though maybe not in Time.

In the last edition, I indicated the bounce may already be underway, with the mid to late January lows marking a turning point.

That was the case in some markets, with others hanging on another few days, until February 10, to hit a final low before the bounce took off.

I also indicated it was probable that Central Banks would try desperately to stop the drop ... and we also saw that happen with the European Central Bank taking unbelievable risks with a decision to prop up corporate bonds.

This edition will be relatively short. I'll give you the all-important planetary price targets for the SP500, but use the ASX 200 as an example of why the bounce may be running out of Price, but not of Time

As usual, Wall Street has been leading the pack higher. The Pollyanna index, the SP500, ended last week only about 5% off its 2015 peak.

There is still a slim chance that we have not entered into Bear territory and that Wall Street could make new all-time Highs in the next few months. But, it is very slim.

More likely is that Pollyanna will start to roll over again, possibly around Wednesday after Jupiter trines Pluto.


The most obvious price target is $2049, a Saturn price line on the index's long-range planetary price chart. I think there is enough positive momentum in the daily, weekly and monthly charts to get Pollyanna to those levels.

In fact, it's the positive momentum, especially in weekly and monthly charts of various indices, that suggests markets are not going to hit a certain price point and then collapse and go into crash mode.

Most Bears seem to be trying to call a "top-and-crash" at every single overhead resistance level and then stand there wondering what went wrong when prices just power through that supposed resistance.

Simply, they're reading the wrong charts. Or reading the right ones wrongly.

Below is the Weekly Planets chart for the ASX 200.

It shows the 200 is about to run into heavy resistance. But the need to be wary of being overly Bearish ... here and now ... is the slow build-up of positive divergence in the Big Bird oscillator. It's distinctly possible it will need some Time to be sufficiently debased to warn of another imminent Bear leg down.

The next chart shows price is still reaching for a Fibonacci 38.2% retracement of the first downleg. It's worrying that it hasn't climbed back as far as Pollyanna, but you can see how the Fast Bird (green) and Medium Bird (red) lines mirror the Big Bird's efforts to make higher peaks at lower prices.


And if that's not sufficient to warn the Bears to be just a little cautious in growling so adamantly, take note of the higher troughs in both Fast and Medium Birds on the monthly chart below. Monthly divergence. That's not something easily wiped away ... and is why I said in the introduction to this edition, we may well be nearing the peak of the bounce in terms of Price, but not of Time.


Markets have an annoying habit of trying to fool the majority of investors.

So, that's it for this edition. We did get the strong dead cat bounce I spoke about last time. There is a slim chance it will morph into a totally-surprising final upleg of the Bull market.

I urge you to do what I always suggest:

Use the monthly and weekly charts for the long and medium range targets ... up or down. And WHEN price gets near to those targets, THEN turn your attention to daily and intraday charts for signs from the momentum of the oscillators that a trend change is starting to get really close.

Safe trading - RA

Randall Ashbourne (Disclaimer: This article is not advice or a recommendation to trade stocks; it is merely educational material.)
Copyright: Randall Ashbourne - 2011-2016


The Idiot and the Moon, eBook, available for purchase

Sunday, February 7, 2016

Waiting for the dead cat to bounce

Randall Ashbourne, an associate of Astrological Investing, posts reports and articles on his web site at  theidiotandthemoon.com   The following is this weekend's Eye of RA report: Week beginning February 7, 2016 
It is now virtually certain that all major world stock markets are in the relatively early stages of a big bad Bear.  
We discussed the probability of that in the first two reports for this year, both of which can be accessed by scrolling down.
 
There is still a chance that Central Banks will try desperately to stop the drop, but they appear to have exhausted their ammunition.

The next major rally is, given the extreme levels of technical damage, most likely to be a dead cat bounce which will provide the last chance for many traders to exit Long positions before being wiped out.

That bounce may already be underway, with the mid to late January Lows marking a turning point for a upward-leaning grind that could run into May, perhaps even early June.

Venus conjuncted Pluto and squared Uranus last week, two strongly negative aspects. This week brings a trine to Jupiter. Given both planets are "benefic" and Earth signs are involved, we could see a level of stability return.

I did promise last month to include the current position of some Asian indices; we'll do that this week, as well as taking another look at Wall Street's SP500 and the ASX 200.

 The Nasdaq took a major hit last week, with some of the big name tech stocks rolling over badly. These had been helping to hold aloft the entire American market.

Pollyanna, the SP500, has not yet, I believe, actually confirmed it is now in a Bear market. But that scenario is now leaning heavily towards the probable, rather than the possible.

Below is the 500's long-range planetary price chart. The index is still trying to hold the Pluto level in the early 1870s. It is possible a rebound could take price all the way back to the 2080s. Still, long-term history shows it finds strong levels of both support and resistance at those orange Node lines.

The Weekly Planets chart for the ASX 200 is below, with the index opening and closing last week's trading within a band between grey Neptune now at 5012 and Uranus now at 4974.

There isn't much to stop a further drop if it dives again below the blue Saturns now converging at around 4949. And any rally is likely to find barriers in the 5184 to 5249 range.

India's Nifty is playing very closely to Pluto price lines. Traders can use these lines as potential targets, keeping a very close eye on daily charts for signs of positive or negative divergence starting to show whenever these targets are approached in actual trading.

Hong Kong has already fallen off its Bullish trend line ... something which has not yet happened decisively on the SP500 or ASX 200 ... and has also completed a backtest of the line. Big Bird, the 50CCI, is gasping in the dust of the mine floor.

There is a little positive divergence in the two faster Birds, giving at least some hope for a bounce "from the obvious" level of Fibonacci support.

It's a difficult call, though, since the index is currently stalled below long-range planetary price support. You'll note that in both charts, the next layer of major support doesn't come into force until around 16,000.

Singapore is holding up a little more strongly than the Hang Seng at this stage, still just hanging onto planetary support.

We can see the alternative levels of Fibonacci support and resistance in the chart below. Fibonacci levels and planetary prices will very often be quite close to each other.

The black lines are linked to the previous Bull High and Bear Low and the red ones run from the Bear Low to last year's High, and even a quick glance will show you both sets provide a reliable guide to the likely length of rallies and declines. Again, if you're actively trading in these dangerous conditions, use these as a big picture guide and watch the daily charts like a hawk for any potential turn as the prices are approached.

If this is a major, new Bear ... and it probably is ... the biggest, nastiest, fastest section of the crash is still ahead of us.

Safe trading - RA

Randall Ashbourne (Disclaimer: This article is not advice or a recommendation to trade stocks; it is merely educational material.)
Copyright: Randall Ashbourne - 2011-2016


The Idiot and the Moon, eBook, available for purchase


Sunday, January 10, 2016

Danger ... the Bear may be underway

Randall Ashbourne, an associate of Astrological Investing, posts reports and articles on his web site at  theidiotandthemoon.com   The following is this weekend's Eye of RA report: Week beginning January 10, 2016


Last weekend I warned that the alarm bells are screaming very loudly.  (scroll down to read last weeks post,. Beware of the Bear.)

After a week of deep-diving stock markets worldwide, I will review below where we may now be in long-range Elliott Wave terms.

It is possible, Stocks would need to begin bouncing strongly and virtually immediately for that to be true.

The alternative is that virtually all major worldwide stock indices made a long-term Bull market top last year and we are already in the grip of a Bear market which could last at least another year and, if follows the "norm", will wipe out perhaps as much as 50% of your net worth. And possibly more in the Wall Street markets.

The onset of the new Bear is not yet set in concrete. However, it is only a few per cent away and as I said last weekend, it was distinctly possible even before last week's dives, that some markets, such as Australia, are already in its grip. because of major astrological  events last week, that the drop is a head fake.

We will begin this report with an updated look at the broad Elliott Wave roadmap, where Bull markets rise in 5 waves. In Forecast 2015, (still available to download) , I had drawn the red arrow on the left indicating where we were at the start of 2015.

It is possible ... but only just ... that Wall Street still has two more rallies before the current Bull is dead. If that is so, those indices are close to where I have drawn the black arrow.

However, the very real danger is that the top is in and a large-scale meltdown is already underway. If that is the case, we may already be within the early stages of a crash ... the second part of a crash which has been underway for months.

As a rough guide, my best guesstimate would place Wall Street about where the red triangle is positioned. In short, we ALL need to watch the next rally very carefully and be prepared to: Get the Hell Outa Dodge!!


We'll look this weekend at the long-range charts for the FTSE and the DAX. England has slumped back into the price zone marked by the two thin, black horizontal lines.

Its position within that zone needs to be monitored VERY closely, because the Big Bird oscillator certainly looks to be in a death dive.

If you look at what happened during the 2007-2009 Bear market on the left of the chart you have a graphic illustration of what I mean when I say we may already be in the early stages of a crash.

The monthly Idiot is now firmly in Sell mode on Germany's DAX. The blue-line Big Bird oscillator is in deep trouble and so, too, is the red-line Medium Bird, which is clearly warning that more trouble is looming. The green-line Fast Bird is showing some positive divergence, though this will not be settled until the end of the month.

Still, it is giving preliminary notification of a potential bounceback nearby.

Please note in the chart above that the Fast and Medium Bird oscillators are looking suspiciously similar to their behaviour just before the 2008 crash.

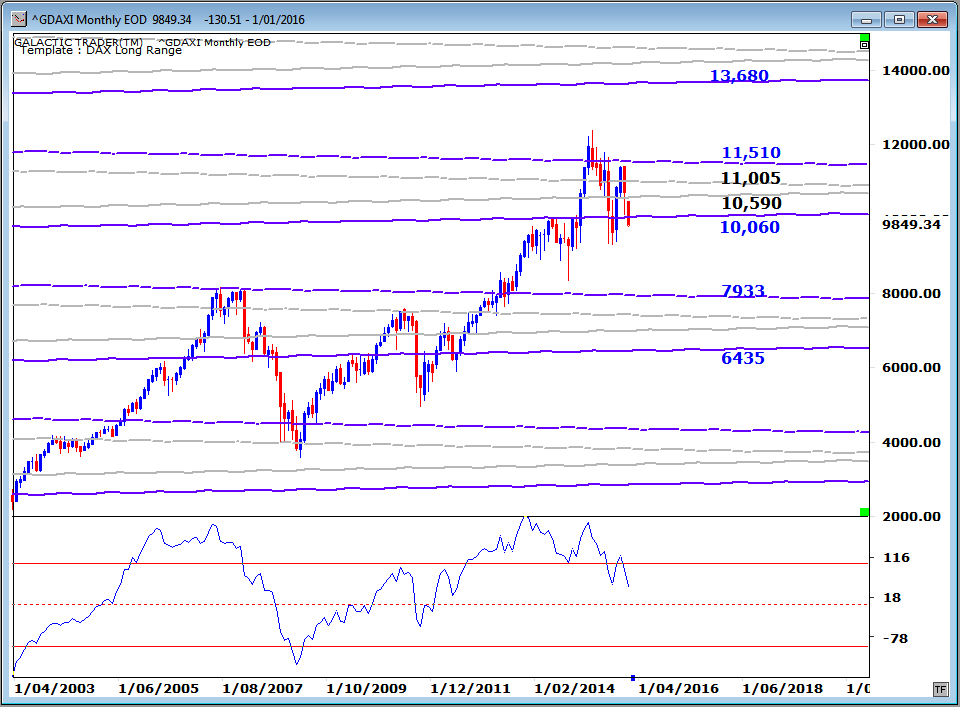
Below is the DAX's long-range planetary price chart ... and that's one big hole its price is starting to drop into.

More than at any time in the past few years ...

Safe trading - RA

Randall Ashbourne (Disclaimer: This article is not advice or a recommendation to trade stocks; it is merely educational material.)
Copyright: Randall Ashbourne - 2011-2016


The Idiot and the Moon, eBook, available for purchase