


With September and the 3rd Quarter now behind us, we'll spend a little time this weekend looking closely at two of the major American indices for signs of stress.
The danger of an unexpected Black Swan event remains in force over the coming week. This weekend's Harvest Moon provides a potential trigger for more negative energy - compounded by some major astrological energy shifts over the next few days.Four planets change signs and Jupiter goes Retrograde.
Both Mercury and Saturn make the move from Libra into Scorpio; Venus moves from Leo into Virgo; and Mars changes from Scorpio into Sagittarius.
Long-term, the most significant shift is Saturn because it will spend the next couple of years travelling through the sign associated with Big Debt, Big Money. Let me explain first how this works in a personal horoscope, though I must stress the interpretation is broad-brush and does not apply to all individuals.
In a "natural" horoscope, Scorpio rules the 8th House - which is the house relating to "other people's money".
An individual undergoing a Saturn transit to the 8th is very likely to find access to other people's money cut off.
This is a time when banks refuse you a loan or a mortgage, when your debts become a major burden to service, and when the Tax Department audits your returns for several years and decides you owe them a LOT more than you've been trying to get away with.
Now, just like you and me, nations also have a "personal" horoscope so not every country is going to suffer the same symbolism. But, because of the long-range negativity of the Uranus-Pluto square already in effect across much of the world, we can expect the sovereign debt issues affecting countries like Greece to magnify significantly over the next couple of years.
Saturn's entry into Scorpio will bring those issues to a head. Banks will be affected, the Treasuries of nations will be affected, insurance companies will be affected. Anyone with large exposure to banks, financial stocks and insurance companies should take some time in the next few weeks to closely examine the technical conditions of their holdings.
The principle of Saturn in Scorpio is that anyone who has become too reliant on "other people's money" faces an unwelcome reckoning ... because the money tap is about to turned off. Saturn transits demand we take a conservative and responsible attitude to debt - or face the consequences.
Those governments which have been blustering and bluffing face a dose of reality. We must consider the transit is a long one; Saturn takes almost three years to travel through each sign. And the Mars shift to the boundless enthusiasm of Sagittarius may provide the opportunity for one last moment of mindless enthusiasm before even the most ardent optimists are challenged.
For several weeks now, we've been exploring the likely limits of the upside in various indices and watching for the first signs of negative divergence to appear in our oscillators to warn of major roadblocks.
And with September and the 3rd Quarter now behind us, that's what we'll be looking at this weekend, concentrating on two of America's major indices, since it's only US Federal Reserve intervention and manipulation which has been holding those markets aloft.
We will begin with Pollyanna, the SP500.
 |
| click to view larger image |
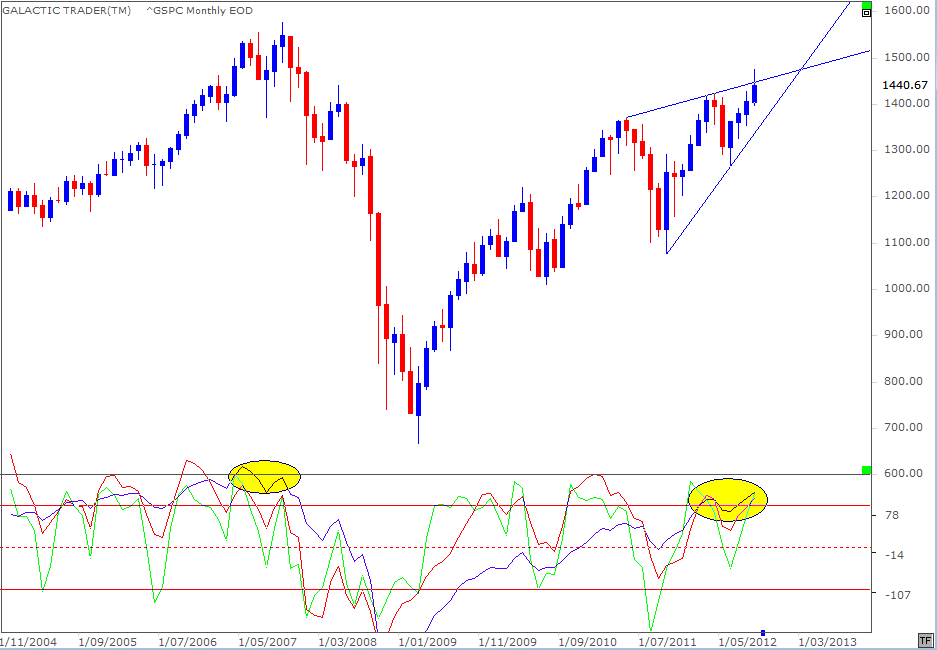
The first thing we need to take into account is that the SP500 has followed the technical "rules" fairly closely since the Bear bottom in 2009 - finding either Support or Resistance at key Fibonacci levels while rising at an overall angle determined by a pitchfork anchored at key tops and bottoms.
The long-range Canary has endorsed the September high by making a higher peak compatible with the price high.
 |
| click to view larger image |
September also behaved perfectly with the rules of the Bi-BB system, which is explained in The Technical Section of the book. Unlike the long-range Canary however, the fast MACD doesn't like the new highs at all. I've used a couple of examples over the past weekends to show you how MACD divergence actually needs time to build and if you're a new reader, you might want to revisit the last couple of editions.
The MACD divergence has been building-up in this index for a very long time now.
 |
| click to view larger image |
I also discussed, a few weeks back, the possibility that Pollyanna was marking out a termination pattern known as an Ending Diagonal and September's false break outside the upper boundary of that pattern increases the probability that it is what is happening ... and that the index is getting very, very close to breaking out or breaking down.
 |
| click to view larger image |
And we've also been regularly reviewing my long-range Old Gods chart for the 500, where I've discussed the importance of the dotted Neptune line at 1468 - as well as the potential for the index to make a final exhaustion run to 1522 or 1562 before the collapse gets underway.
Now, let's turn our attention to the state of the Nasdaq 100.
 |
| click to view larger image |
I've discussed a number of times the importance of 50% retracement and extension levels to some indices and a few weeks ago we looked at this chart, anticipating the NDX would face a major hurdle at the 2805 level.
However, that's not the most important thing on the chart. We have in the NDX what is missing in the 500's chart - a severe and increasing level of negative divergence in the long-range Canary (the blue oscillator line). All three versions of the Canary HATE the Nasdaq's new September high!
There is a very loud alarm klaxon going off in this index ... and it is even more obvious in the NDX weekly chart, below.
 |
| click to view larger image |
Since the index deals with technology-related stocks, it's no surprise to discover that Uranus is the Old God most closely associated with its long-range targets, either as Support or Resistance. Uranus is delineated on the chart below with the orange lines.
 |
| click to view larger image |
Last week found Support when price retested the Uranus barrier which had twice previously acted as Resistance. However, as with the previous chart, there is negative divergence from the height of the MACD signal line peaks, as well as the histogram peaks. This index is in danger territory. It is showing all the classic signs of getting very close to a major breakdown.
So, while we have no solid leads yet that Pollyanna is about to morph into Chicken Little on the SP500, we have very clear signals from the Nasdaq 100 that the American market internals are no longer stubbornly Bullish.
 |
| click to view larger image |
The chart above is the DAX Weekly Planets. It failed to make it all the way to the Neptune line at 7490 and has gone from a Saturn (cyan) high to a Saturn low. However, with this index, it's the grey Neptune and orange Uranus lines which are the major targets.
 |
| click to view larger image |
The FTSE Weekly Planets chart is next and needs no explanation.
And below is a really simple chart of the ASX200.
 |
| click to view larger image |
I display this chart once again as an example of just how simple - and informative - a chart can be without having to rely on expensive software. It actually flies in the face of the omens from the NDX. The downtrend angle has been broken and the long-range Canary is suggesting further upside, so long as 4266 isn't breached by October's close.
Okay, I've spent more time than usual this weekend concentrating on the 500 and the NDX, since Wall Street and the Fed seem determined to follow the American Presidential Pattern, which normally sees an October slump followed by a fast rally into the November election period.
Next weekend, I'd hope to look at the Asian markets again - especially Shanghai, since what happens in China will be important. And I also hope to have another look at the main Canadian index since it has been quite a while since we reviewed the TSX60.
In the meantime ...
Safe trading - RA

Important reading: Randall Ashbourne's article, Jupiter's cycle and its effects on Wall Street and a posting of the weekly Eye of Ra report in this blog, titled A look at the Venus Retrograde effect
(Disclaimer: This article is not advice or a recommendation to trade stocks; it is merely educational material.)
Copyright: Randall Ashbourne - 2011-2012


0 comments:
Post a Comment
Note: Only a member of this blog may post a comment.