Saturday, October 26, 2013

Uranus square Pluto ... the middle hit

Randall Ashbourne, an associate of Astrological Investing, posts a weekly market report on his web site, theidiotandthemoon.com The following is this weekend's Eye of RA report: Week beginning October 28, 2013

Uranus square Pluto ... the middle hit

This week brings the 4th exact hit of Uranus square Pluto ... and with it, an increased danger of turning the tide.

It's not the only astro show in town over the next couple of weeks. The Mercury Retrograde phase has another 2 weeks to run; there'll be a solar eclipse New Moon next weekend; and Jupiter goes Rx in the following week.

 We'll concentrate this weekend on a comparison between the SP500 and the Dow Jones Industrials.

Miss Pollyanna, the 500, has been hitting new, all-time highs while the Dow has been lagging. It's a divergence which has to be resolved, probably sooner rather than later.

Germany's DAX index has also hit new records, along with Argentina. However, it's a very small list. And there's the worry, because the old adage insists that a rising tide lifts all boats.

That simply hasn't been true of most world stock indices since the last Bear bottom in 2009.

This week's Uranus square Pluto aspect, the 4th exact hit in a rare series of 7, is likely to mark the start of an important turning point, though it might not become obvious for a few months.

In a moment, we'll have a quick look at its impact so far ... and then examine the current, long-range state of both Pollyanna and the Dow.

In the chart below, I've marked the weeks of the three previous Uranus/Pluto squares with thick red bars. The last two coincided with peaks before the 500 went into significant declines.

So, with the potential for a top of some significance to form this week or next, let's look at the big picture technical position, starting with a weekly of the Dow.

It has remained trapped within a horizontal band since earlier in the year. What began as severe negative divergence building between price and the falling peaks of the Big Bird oscillator, could resolve itself in a breakout northwards.

It doesn't seem likely, but! We should always assume normalcy. And what normally happens if Big Bird unwinds, while price tracks sideways, is that it develops into a continuation pattern, rather than a divergence pattern.

It looks as if the decision is now extremely close. Either the price and the oscillator need to turn down - sharply - in the next week or so, or the Dow should break northwards out of the box.

Now let's turn our attention to how the Dow is performing within its monthly Bull channel. I've marked the top of the channel with a red parallel, just to make it obvious.

And what is obvious is that the Dow is a long way short of it.

However, that's not the case for Miss Polly!

Broadening out the picture even further, we get a sense of why the Dow might be stalling. All the professional players know exactly what the next chart means ... IF it plays out "normally".

It is a disastrous crash scenario. It's a pattern called, moderately, a megaphone; or perjoratively, the "jaws of death". Megaphone ... because the market is screaming at you to get the hell out of Dodge real fast.

The professionals know that price must break through that top trendline decisively and unambiguously if the crash scenario is to be negated.

So the question becomes ... is the Dow gathering for a decisive breakout, or is the fear of being crunched by the jaws of death already starting to weigh?

The same pattern cannot be applied to the SP500, which double-topped in 1999 and 2007, but has broken out higher on this Bull run.

Still, the Pollyanna chart is not without its own warning signals. There have been only a couple of times since the 2009 Low that Miss Polly's monthly has breached the barrier of the upper Bollinger Band, as it's currently doing in what is normally one of the year's weakest months.

We'll leave it there for this weekend. Planetary prices for Pollyanna and various other indices were published last weekend and are still valid. You can check those charts in the Archives.

I'd intended to update a few more Weekly Planets charts for other indices this weekend, but have run out of time. Hopefully, I'll be able to do it next weekend.

Safe trading - RA

Randall Ashbourne
Astrological Investing's associate, Randall Ashbourne, author of the eBook, The Idiot and The Moon, and The Idiot and the Moon, Forecast 2013, writes a free weekly column titled, The Eye of Ra on his web site in  which he explains the potential impact of astrological aspects and the current state of technical conditions. Ashbourne's charts are revealing illustrations of exactly what has occurred in the market and the probability of what to expect.
Important reading:  Randall Ashbourne's The Idiot and The Moon, Forecast 2013
(Disclaimer: This article is not advice or a recommendation to trade stocks; it is merely educational material.)
Copyright: Randall Ashbourne - 2011-2013

Saturday, October 19, 2013

Murky Wrecks ... and more gold mystery

Randall Ashbourne, an associate of Astrological Investing, posts a weekly market report on his web site, theidiotandthemoon.com The following is this weekend's Eye of RA report: Week beginning October 21, 2013

Murky Wrecks...and more gold mystery
There are a couple of astro events this week likely to have an impact on stock markets ... Mercury goes Retrograde and the Sun shifts from Libra into Scorpio.

Firstly, the usual warning about Merc Rx - Murky Wrecks - make sure you double-check everything you do and expect some data feeds to go haywire.

Most of us make a few mental blunders during the Merc Rx periods; like hitting the Buy button when we actually meant to Sell.

It's just a lack of concentration, which is easy to overcome if we're aware of the tendency and adopt a policy of double, even triple, checking.

There is also a general tendency for stock markets to start a move in the few days around the Merc Rx date which reverses course halfway through the phase (normally about 3 weeks long).

It doesn't always happen, but it does more frequently than not ... and since the last Mercury Retrograde phase in June/July launched a strong rally throughout the period, the coming phase probably has a higher chance of returning to "normalcy" mode.

We'll take a look at a chart on the topic in a moment. We'll also be taking another look at gold, where mysterious big money buyers have replaced the mysterious sellers, and I'll start the process of updating the Weekly Planets charts for a range of indices ... starting this weekend with India's Nifty, London's FTSE and Singapore's STI.  

There is great joy across America as its politicians vote to send the nation deeper into debt while refusing to do anything about its profligate spending.

This is good. It means we can all get back to the really important stuff ... like why Miley persists in sticking her tongue out so far when it's always covered in white fuzz ... or whether there should be a law compelling Kim Kardashian to wear a full burqa so we are all spared another one of those endless "selfies" displaying buttocks that would shame a dairy cow into going on a diet.

And speaking of vacuous trolls ...

Miss Pollyanna, the SP500, gapped up on Friday into the Full Moon date, which statistically tends to be a low point in market mood. This inversion of the normal also happened at the last Full Moon - prompting a 3-week decline.

The new Price high has received an approving nod from the Big Bird oscillator, which has also recorded a higher peak ... though not as high as it recorded in May.

Next, we will look at a Mercury/Node chart for the index. In the left third of the chart I've marked the previous Merc Rx phase with two black verticals. The index rallied all the way through the phase, which is a little unusual.

Miss Polly has a tendency to travel between Node price lines, which are the orange horizontals on the chart above. And there's one of those immediately overhead.

The astrological symbolism applied to Mercury Retrograde periods is that it denotes time for a RE-think about what's happening. I showed you a few weeks ago that the Sun in Libra tends to be a bit chaotic. Libra symbolises balance and a drive to reach agreement and an harmonious outcome.

I also said it can just mean the iron fist is wrapped in a velvet glove. We had that sort of stuff happening in Washington. Nevermind. We got the agreement, which kicks the whole mess down the road until early next year.

The Sun's shift to Scorpio, in conjunction with the Merc Rx phase for the next few weeks, means it's very likely there'll be a national re-think about how to handle all the debt (Scorpio) issues.

So, we do need to be aware that the breakout could be subject to a reversal. However, it is a breakout and the next highest level of long-range planetary price resistance doesn't come into effect until the $1770s.

The optimism displayed by Pollyanna is not universally shared.

London's FTSE index remains below its May highs; in fact, it's still below its August and September highs.

The daily Big Bird is crawling higher, even with the price lower. There's not quite the same level of agreement from weekly Big Bird on the FTSE's Weekly Planets chart (below).

Still, either on this rally or the next one, the FTSE seems to have its target set at the upside Saturns - in the 6700s.

Mumbai's Nifty Weekly Planets is below and the index has been playing those close to perfection. Big Bird likes the bounce and breakout is likely to target the 6400s.

The Straits Times Index has been constrained by Saturn for many weeks - and its Big Bird is not giving clear signals for a move in either direction.

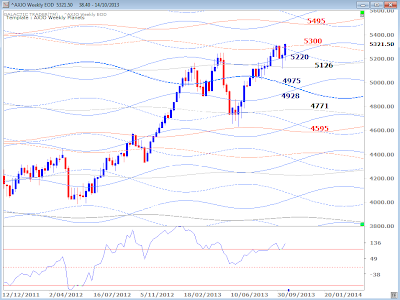
Similar to the Nifty, Auntie - the ASX200 - is playing almost perfect WP touches. We have preliminary indications of a break northwards ... and it's open space all the way to around 5500.


I'll try to update more European and Asian WP charts over the next couple of weekends. But now, let's turn our attention to the latest shenanigans in the bullion bazaar.

And bizarre it was again last week when, in the wee hours of New York's Thursday morning, a wave of Buy orders worth over $2.3 billion surged onto the markets, causing a 3% jump in prices in a matter of minutes. The manipulation continues unabated.

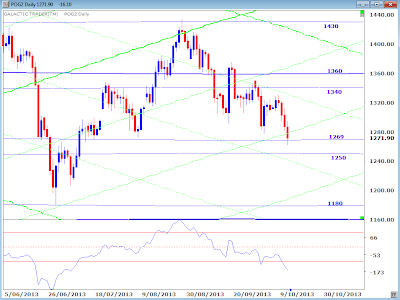
Let's look first at my planetary price chart for greenback gold. We got the lower prices when gold slumped down into the 1250 Pluto level early in the week and rebounded with all those mysterious early-am Buy orders on Thursday to finish the week capped by a falling Sun line.

Thursday's raid also produced a breakout above the red downtrend line which has controlled the market since it peaked in August. Fast Bird (green) likes the move and so does the red Medium Bird.

So, despite Friday's stall it appears higher prices are ahead. So go consult the planetary chart.

But remember that there's still a lot of overhead resistance which has yet to be overcome before we can be sure gold has embarked on a sustained rally.

Safe trading - RA

Randall Ashbourne
Astrological Investing's associate, Randall Ashbourne, author of the eBook, The Idiot and The Moon, and The Idiot and the Moon, Forecast 2013, writes a free weekly column titled, The Eye of Ra on his web site in  which he explains the potential impact of astrological aspects and the current state of technical conditions. Ashbourne's charts are revealing illustrations of exactly what has occurred in the market and the probability of what to expect.
Important reading:  Randall Ashbourne's The Idiot and The Moon, Forecast 2013
(Disclaimer: This article is not advice or a recommendation to trade stocks; it is merely educational material.)
Copyright: Randall Ashbourne - 2011-2013

Saturday, October 12, 2013

Another week ... another gold dump

Randall Ashbourne, an associate of Astrological Investing, posts a weekly market report on his web site, theidiotandthemoon.com The following is this weekend's Eye of RA report: Week beginning October 14, 2013
 This time it came at 8.52am Friday - tons of gold futures dumped for sale with no price limit.

Though only little more than half the size of the 2am dump the previous week, the sell order was massive enough to force a stall in the computer trading systems.

That's just two sell orders in two weeks which have caused the price of gold to slump.

To put it in context, it's about 40 tons of gold - or around 19% of Barrick Gold's worldwide production across four continents; more than the annual output of most individual mines.

As I said last weekend: "The reality is simple. Gold is still in a downtrend; attempts to "get in early" for the next rally phase leave ordinary traders vulnerable to being forced out of their positions at a loss while the big boyz' computers manipulate out-of-hours trading."

We'll take a look at the charts in a moment. And, unfortunately, that'll probably be it for this weekend. I've been having internet connection problems all week, making it almost impossible to upload, or download, anything other than very small files.

I'll leave a link to last weekend's edition at the bottom of this one, since I can't yet upload changes to the Archives menu. Stocks are bouncing after New York and Australia hit the downside planetary levels shown in last weekend's charts.

The bounce may be short-lived. A temporary extension of the USA debt ceiling by a few weeks simply kicks the can down the road a little so we can live through all of this nonsense again, around kick-off time for the annual Santa rally.

I'm not a big fan of conspiracy theories, but the odd timing and massive size of the two gold dumps reeks of deliberate manipulation.

Greenback gold continues to decline within a clearly-defined downtrend channel and the risk remains it could still be on its way down to a lower low before a longer-range bounceback gets underway.

The daily chart is below and I indicated last weekend the near-term, red downtrend angle remained in effect - as it did again last week.
 

Not only does the price continue to align itself with these trendlines, it also continues to heed the planetary lines - travelling within green Sun channels between Pluto horizontal levels.

Last week's drop was confirmed by a lower low in the daily Big Bird oscillator, meaning there's a high chance of even lower prices in the next few weeks.

We would want to see some sort of obvious positive divergence develop in the oscillator readings on the daily charts before we can be sure gold is set for a sustained turnaround.

Until that occurs, there is still considerable danger in starting to load-up too heavily on either gold itself, or in gold mining stocks.

And the danger continues to grow, too, with stock markets in general. There has been very little northbound movement in prices since May.

My apologies for the necessarily brief report this weekend. I'm assured I'll have a full-speed connection back online by late Monday, so should be able to update some Weekly Planets charts for major indices next weekend.

(Scroll down or click here to view last week's charts.)


Safe trading - RA

Randall Ashbourne
Astrological Investing's associate, Randall Ashbourne, author of the eBook, The Idiot and The Moon, and The Idiot and the Moon, Forecast 2013, writes a free weekly column titled, The Eye of Ra on his web site in  which he explains the potential impact of astrological aspects and the current state of technical conditions. Ashbourne's charts are revealing illustrations of exactly what has occurred in the market and the probability of what to expect.
Important reading:  Randall Ashbourne's The Idiot and The Moon, Forecast 2013
(Disclaimer: This article is not advice or a recommendation to trade stocks; it is merely educational material.)
Copyright: Randall Ashbourne - 2011-2013

Sunday, October 6, 2013

Gold ... Gone in 60 seconds

Randall Ashbourne, an associate of Astrological Investing, posts a weekly market report on his web site, theidiotandthemoon.com The following is this weekend's Eye of RA report: Week beginning October 7, 2013
Gold ... Gone in 60 seconds
Actually, it took a little longer than 60 seconds ... but not much longer.

In the early hours of the morning early last week, with most of Europe and the Americas asleep and with Asia just starting to stir, a mysterious "someone" dumped 800,000 ounces of gold contracts.

In the following few minutes, with human traders asleep and only the big boyz' computers keeping watch, the price of gold slumped. 

I'll show you the chart of what happened in a moment. I suppose there are a couple of options for why it happened.

Maybe a real, living version of Uncle Scrooge woke up suddenly, off his Prozac, and had a panic attack.

Perhaps, after the last concerted attack on the gold price, the guardians of gold deposits realised they're still hundreds of tonnes short of "finding" Germany's gold.

You know, the stuff that's supposed to be stored in Fort Knox, but which Germany was told it can't actually have back for another 7 years.

Whatever the reason, it does highlight that trading gold continues to be highly dangerous in the current climate.

One doesn't wish to become too embroiled in conspiracy theories. But seriously, who dumps that much gold at 2am unless they really want to dramatically drive down the price?

Here's a 5-minute chart of greenback gold, showing what happened. In mere minutes, gold tumbled from the 1330s to the 1280s. A lot of traders woke up that morning to find their Long gold positions had been wiped out as the plunge targeted - and triggered - their loss stops.

The bounceback has been reasonably strong, which is little comfort to those who had their profits stolen by the predawn attack, but the simple fact of the charts is that it continues to leave gold in a dangerous position.

Greenback gold remains locked in the mid-range of a downtrend channel, as we can see from the weekly chart below. The state of the 3 Canaries in the oscillator panel continues to improve.

But the gold market remains dangerous - and the swings are even wilder on individual gold mining shares.

The daily chart is below and we can see the attack forced gold out of its short-term, rising trend channel, leaving the red line, near-term downtrend angle intact.

Unfortunately, even breaking out above that near-term downtrend angle still leaves a lot of other, overhead resistance - as we can see from the next chart.


The reality is simple. Gold is still in a downtrend; attempts to "get in early" for the next rally phase leave ordinary traders vulnerable to being forced out of their positions at a loss while the big boyz' computers manipulate out-of-hours trading.

In terms of stock markets ...

We now have a small bounce into the New Moon and a potential, month-long Bradley Model trend change date last Friday or on Monday.

Obsessed with the daily squiggles, it's easy to lose touch with what is really going on. In late July, I ventured the opinion that markets were probably within a long-range topping process and that there was little upside left - and a lot of potential downside.

Let's revisit that chart to see what has happened since. Not much! I said at the time this chart was published: "But, the maximum reach for the final minor wave up in this rising leg is probably only 1.6% away. The peak of the entire post-2009 rally may be only 4.7% away."


These are long-range planetary price lines for Pollyanna, the SP500. The 1719 Pluto level was broken only briefly and marginally. You'll note this rally began last year with a downside break, of similar brief time and magnitude, of the Pluto level near 1360.

We've been discussing the strong build-up of negative divergence on weekly charts. So, at this stage, I still lean towards more chance of further downside in the next few weeks.

I'll try, next weekend, to update some Weekly Planets charts for European and Asian indices.

The ASX200 continues to hit the targets quite precisely.

Safe trading - RA

Randall Ashbourne
Astrological Investing's associate, Randall Ashbourne, author of the eBook, The Idiot and The Moon, and The Idiot and the Moon, Forecast 2013, writes a free weekly column titled, The Eye of Ra on his web site in  which he explains the potential impact of astrological aspects and the current state of technical conditions. Ashbourne's charts are revealing illustrations of exactly what has occurred in the market and the probability of what to expect.
Important reading:  Randall Ashbourne's The Idiot and The Moon, Forecast 2013
(Disclaimer: This article is not advice or a recommendation to trade stocks; it is merely educational material.)
Copyright: Randall Ashbourne - 2011-2013

Thursday, October 3, 2013

An Astrological Trip Around the New Moon in Libra

Astrological Investing New Moon forecasts show general trends and financial outlook for the month. The New Moon in Libra, 2013  - Chart from the point of view of Wall Street and the NYSE.
The New Moon in Libra, October 4, 2013
Chart from the point of view of Wall Street and the NYSE.

Last months Lunar cycle has come to an end as the Moon conjuncts the Sun in Libra triggering the energy of the Pluto- Uranus square. 
This aspect has heated things up politically at home (ruthless, negative campaigns and strong disagreements between the two political parties in the US) and world wide. (mob violence and political uprisings in the Middle East) And, economically, the Uranus and Pluto aspect has been push pulling the markets. Note - Though not always strongly in force by exact aspect, the energy of Pluto square Uranus has been an operative influence since 2012, and will be influential though 2015. 

An Astrological Trip Around the New Moon in Libra Chart


The New Moon is in the fifth house in a T-square with Pluto (eighth house) and Uranus (eleventh house) - Typically, new moons create a feeling of optimism and the markets react positively.  Research has shown that people have a greater willingness for change and acceptance at the New Moon phase. Optimism for a brighter future coming is prevalent with the new growth cycle of the Moon.  "When a new moon occurs, people, male and female, will experience a sense of calmness. Their emotions will stabilize and their willingness to accept difficulties will reach its peak. The persons will be more energetic and open-minded. Optimism will also result from this moon phase." from the article, Human Behavior with Relation to the Lunar Cycle

However, this month at the time of the New Moon, the Sun and Moon in Libra trigger the energy of a challenging Pluto- Uranus square.  Now, it may be possible that whatever has investors jittery has already been baked into the market by the time of the New Moon - just days leading up to the New Moon the Sun has squared Pluto and then went on to oppose Uranus.   So, maybe the fear has subsided? 

It's all about risk these days - especially with the New Moon in the fifth - just how much risk can you tolerate?  Read Randall Ashbourne's article The Moods of the Moon - Trading the Mood Swings of the Monthly Lunar Cycle   

Events governed by the 5th house will come to the forefront this lunar month -
 This being the Sun's "natural" house, the 5th house has much to do with public figures. Here, the Sun represents all people in authority in respect to the NYSE - that would include Ben Bernanke and the President of the US.

The Moon represents where people's attention and focus falls this month - as well as the actual mood of the people.  Frankly, in Libra, people would like to be out enjoying parties and the theater, or maybe entertaining in their homes, with Jupiter now in Cancer.  The need for a bit of balance away from the stress of every life, and the need to take time out for amusement of all sorts, is their focus of attention.  Unfortunately, this is not an easy need to fulfill with a T-square to Uranus and Pluto! Those planets have little, or nothing, to do with fun and leisure.

Public speculation, investments, gambling (having to do with risk taking in the market) will be spotlighted. Since the politics of the nation affect the fears of investors, the popularity of the President is on the line, as well as The Fed Chairman.  Social problems arise, and there is a possibility of scandal.

The ruler of the Taurus rising chart, Venus, is located in the sixth house on the cusp of the seventh - If well aspected this would be very fortunate, however, that isn't happening either!

Venus is not well placed in the sign of Scorpio, especially when opposing the chart's rising degree in Taurus. And there is an applying square from Mars. This is not good for the working class.  Unemployment, worries of an increase in taxation, and higher expenditures is of great concern.  Money, money, money is on the minds of the working people - investors are interested in stable stocks that yield high dividends.

To read the interpretation of  all the planets, Click to read newsletter

When reading the newsletter on the web site, be sure to take note of the Moon Phases section and get the "Head's Up" - upcoming astrological events list.

Commentary - Read this week's Eye of Ra Report by Randall Ashbourne (click here), or read it on his web site -  "Week beginning September 30, 2013"

Understanding the potential of planetary cycles and what the technical charts tell us is our best bet for successful trading. We need to see the whole picture!

I have been reminding readers at the end of each New Moon interpretation that astrologicalinvesting.com strives to teach financial astrology as a timing tool to use. Although the mundane reading I give each New Moon gives us a broad picture of the astrological landscape we expect to encounter during the month, I encourage all of you to look at the weekly technical charts by Randall Ashbourne.

FORECAST 2013  - 1/2 price off!  - Includes an index-by-index analysis of Moon Trading across major American, European, Asian and Australian stock indices showing variations in the performance which can help traders time Entry and Exit levels for greatly enhanced profitability - the analysis also identifies those of the major indices where following the phases of the Moon can dramatically cut profits, or even result in large losses.

Read Randall Ashbourne's 2011 article, The Moods of the Moon - Trading the Mood Swings of the Monthly Lunar Cycle

Safe Trading! Marley