Showing posts with label DJIA. Show all posts

Saturday, August 16, 2014

Crash through or crash ... Mars/Saturn

Randall Ashbourne, an associate of Astrological Investing, posts a weekly market report on his web site, theidiotandthemoon.com  The following is this weekend's Eye of RA report: Week beginning August 18,  2014 
 Well, the snugglepuss session with Venus and Jupiter making kissy-smoochy in Leo is almost over.

Now the wicked warrior is heading for a confrontation with the old guy who eats children ... and Venus will throw a hissy fit with both of them.

As expected, stock markets had a nice lull in the developing storm last week as the Prince and the Showgirl headed into their leonine love-in and the general tendency for a price rise into the aspect held firm.

Now we need to think about whether such grand passion can last. Mars, in Scorpio clothing, is heading for a conjunction with Saturn. This won't be pretty. Think ... Cesare Borgia and the "charm" of a King Cobra off for a little chat with the King of Naples. Soon to be the dead, former King.

Venus will make a tense square aspect with both of them ... and the Sun leaves sunny Leo for picky Virgo, where he'll oppose Neptune.

Now, these key aspects pack enough power to turn the markets again. They're not happening this coming week, but the following one.

Last weekend, I published a chart showing the general tendency for stock prices to rise into the annual Venus-Jupiter conjunctions. Now let's take a look at the historical track record of Venus square Saturn, Mars conjunct Saturn and Sun opposed Neptune, marked below with blue, red and green bars respectively.

The other reasonably significant astrological event is that Mercury moves into Virgo this weekend. It's indicative of a mental shift, a change in thinking from grandiose speculation and bold statements to a much more measured outlook and demands for real, hard, actual evidence.

As in ... You can say you bombed a secret Russian convoy, but now it's time to show-and-tell, not just bluff, bluster and try to bravado your way through. And that's not just a matter for little Mercury. The Sun opposed Neptune may well see a "big lie" exposed for all to see.

Still, enough with all of that. Time for some techie stuff. And since it has served us none too shabbily for the past few weeks, let's return to the Dow Jones Industrials daily. I've gone back to the really basic. As expected, the Dow had a better week and managed to climb back above the orange horizontal.

But! The bounce was not enough to get the Dow back inside its longer-term rally channel. So far, it's only a retest of the rising channel's bottom line.

And ditto at a daily level for Pollyanna, the SP500.


Okay, now let's return to some specific planetary price levels. I said last weekend: "I'd have thought she (Pollyanna) should be able to climb above Mars in the coming week, and if she does, we need to watch how she handles the $1958 Node price line." If you recall, the falling Mars line was priced at 1940 for last week. Polly regained it and on Friday attempted to break through the 1958 level. And failed.

Let's hop across the Pond and consider the state of the FTSE. I've shown you the long-range planetary price chart for the German DAX a few times recently.

London made a retest of the 6526ish planetary price level during the August spike down and has bounced again.

What worries me about the bounce, though, is its weakness. I've marked the general area of this very long sideways shuffle with a couple of thin black horizontals, which also cover the previous Bull peaks.

But the Big Bird oscillator is getting very unhappy.

Okay, the ASX200, which enjoyed a stronger love-in bounceback than most other markets. As with the Dow and Pollyanna hitting either planetary price lines or technical trendline levels, the index now has to crash through ... or face the prospect of at least a mini-crash developing.

And gold. Spikes to the topside, spikes to the downside. A shiv into the Bears one day, a skewer into the Bulls the next. Personally, I remain long-range bullish and short-range totally relaxed. And bored by the games.


Safe trading - RA

Randall Ashbourne (Disclaimer: This article is not advice or a recommendation to trade stocks; it is merely educational material.)
Copyright: Randall Ashbourne - 2011-2014


Astrological Investing's associate, Randall Ashbourne, author of the eBook, The Idiot and The Moon, and The Idiot and the Moon, Forecast 2014, writes a free weekly column titled, The Eye of Ra on his web site in  which he explains the potential impact of astrological aspects and the current state of technical conditions. Ashbourne's charts are revealing illustrations of exactly what has occurred in the market and the probability of what to expect.


Important reading:  Randall Ashbourne's The Idiot and The Moon, Forecast 2014  


  Purchase Forecast 2014 and receive a special report on GOLD   

Tuesday, November 13, 2012

The New Moon in Scorpio - Solar Eclipse - November 13, 2012

Astrological Investing New Moon forecasts show general trends and financial outlook for the month. The New Moon in Scorpio, November 13 - Chart from the point of view of Wall Street and the NYSE.
Chart from the point of view of Wall Street and the NYSE.

At last the US election is over! Final counts are still coming in, but the election outcome has been determined; and we, here in the USA, are relieved that it is over. Of the people who voted, 50% are rejoicing, and 48% and not. But we are mostly ALL glad to get back to regular TV without all the campaign ads! We voted and can't wait to move forward.

But wait! Mercury stationed retrograde on the day of the election. As it appears from planet Earth, Mercury is not moving forward - it is moving backward - and will remain retrograde until November 26.

Astrologers remind us that during Mercury Rx we should not make major decisions, should not start anything new, and they tell us that we should do things that begin with "RE" . Well, we did.

We RE-elected President Barack Obama. We Re-elected almost all of the same Congressmen and Senators (give or take a few!) REgardless, the balance of power in the United States Congress is a very close REpeat of what we had. Political pundits are REhashing and REviewing the election outcome trying to figure out this and that - why Obama won or why Romney lost - Whatever!

All my best to the winners, my condolences to the losers, and my hope that we don't end up REmorseful, as that is sometimes (often!) the case when major decisions are made on the day Mercury stations retrograde.

This New Moon in Scorpio is a Total Solar Eclipse.
And a Lunar Eclipse, Full Moon, follows on November 26.

What we really want to know is "How will these two eclipses potentially impact the financial market?" Therefore, this New Moon report will only briefly cover the chart, as we discuss the impact of eclipses.

And because Mercury is retrograde, I'm going to REpeat much of what I said in my newsletter from May, when I discussed Eclipses...

Eclipses happen on either a new Moon or a full Moon 
 A new Moon eclipse is a solar eclipse - a full Moon eclipse is a Lunar eclipse. An eclipse is important astrologically because the energy has a long lasting influence - just how long of an influence varies. Study has gone into exactly how long an eclipse has influence, yet there is actually no definitive answer. Some say energy from a solar eclipse can be felt for as many months that are equal to the minutes/hours the actual eclipse lasts, or the amount of time the shadow of the eclipse can be seen. Some simply say the energy of a solar eclipse can be felt up to 6 months, or until the next solar eclipse; Lunar Eclipses, not quite as long.

In any case, the reason the influence is long lasting is that the degree of the eclipse becomes very sensitive and the energy of the eclipse can dramatically reappear as transiting planets aspect the degree of the eclipse and other planetary positions in the eclipse chart.

Transiting planets can trigger problematic international world affairs and harsh geological events. Events that have potential to impact financial markets.

Malefic energy?
Ancient astrologers stressed the "malefic" quality of eclipses. In reality, the energy is simply increased, intensified action. Therefore, challenging aspects (squares and oppositions) from outer planets, which are difficult to begin with, have added intensity which makes them more problematical. Trines and sextiles - the so-called "easy" aspects can also be problematical, but most of the time the end results are fortunate.

Both the challenging and the easy aspects in an eclipse chart portend transformation and change. In the end, it's really how well things are managed.

In Raphael's Mundane Astrology, he notes that, "The strength of the planet ruling the sign in which the eclipse falls should be considered, and its position in the figure of such eclipse duly noted, for the significations of this planet will principally appear." This eclipse is in Scorpio, and Pluto and Mars (rulers of the eclipse) are found together in the eighth house of New Moon chart. We need to be alert as this could bring volatility in the market due to an unfortunate events which could be a military, accident, fire or crime. (All these things ruled by Mars) More information of the Benghazi incident may be brought forward.

Earthquakes are associated with eclipses
The area over where the shadow of the eclipse passes is especially susceptible to seismic disturbances - The majority of the eclipse takes place over the South Pacific Ocean, and makes no landfall with the exception of northern Australia. Here is a map showing the path of Total Solar Eclipse on November 13/14th   Because it crosses the International Dateline it actually begins on the 14th in NE Australia at dawn.

"The Moon's penumbral shadow produces a partial eclipse visible from a much larger region covering the South Pacific (including Australia and New Zealand), southern South America, and part of Antarctica () As the path progresses eastward it crosses the International Dateline moving back to the 13th as it moves towards sunset to the west of Chile." (http://eclipse.gsfc.nasa.gov/SEmono/TSE2012/TSE2012.html)

Overall increased volatility in the financial market
Near the date of the eclipse, before and after, there is a marked increase in volatility. Eclipses have coincided with market reversals in either direction. With Mercury in the first half of its retrograde period, the chances of extreme volatility increases.

Solar Eclipses have a predicable influence on individual stocks.

Check the first trade or IPO charts you are holding or considering to buy/ sell. Look to see if they have planets within 5 degrees of 21° in fixed signs. (Taurus, Leo, Scorpio and Aquarius) for the Solar Eclipse. And for the Lunar Eclipse, later in the month, look for aspects within 5° of the 6° mutable Lunar eclipse. (Gemini, Virgo, Sagittarius and Pisces)

As for individual stock prices, solar eclipses have both positive and negative effects, depending upon which planet it aspects in the stock's IPO or First Trade chart. (If the chart of incorporation is impacted by the solar eclipse it may or may not influence the price of the stock.)

With Sun, Venus, Mars, Jupiter, Uranus or Neptune you may see a positive affect on the price of the stock - but especially so with Venus and Jupiter, the money planets.

If the chart has Saturn or Pluto within 5° of the eclipse degree - this eclipse could impact the stock very negatively!

Oppositions and squares are important to watch as well, but the conjunction makes the strongest impact. Trines, sextiles and minor aspects are not reliable indicators of whether the price of a stock will move up or down

IMPORTANT!!!! Twenty six of the DJI charts will be impacted by the Solar Eclipse! And, sixteen of these charts are IPO's.

Two of the stocks to watch that will be impacted by the eclipse -

Bank of America (BAC) IPO chart has Uranus at 17° Scorpio in opposition to Venus at 22° Taurus and Mars at 15° Taurus. This financial stock may fare better than others in that sector.

Boeing (BA) Has Jupiter at 17 Scorpio with Mars at 22 Scorpio. This is very promising for the price of stock! (Also, because BA is in the sector that is governed by Jupiter)

If you are interested in obtaining all the DJI charts, click here.  Also, a great resource for researching stock charts is Michael Munkasey's Company Data.

An Astrological Trip Around the New Moon in Scorpio Chart

Note: New Moon periods tend to be a positive time for the markets, often coinciding with temporary highs relative to the direction the market is trending.  There are many of you who have been trading with the phases of the Moon and having much success; and you know by reading Randall's The Idiot & the Moon that there are times when it doesn't always work out that way! (Read Randall Ashbourne's article, The Moods of the Moon - Trading the Mood Swings of the Monthly Lunar Cycle. Purchase his eBook, The Idiot & the Moon )

Mercury in Sagittarius rules this chart set for NY.  Mercury is in the sixth house near the cusp of the seventh, in mutual reception with Jupiter in Gemini in the first house.

This is an optimistic new Moon chart, having Jupiter in the first in mutual reception to Mercury. People in the US are looking forward with great hope that the next four years will provide new jobs, a better economy and prosperity for the working class. The markets may react positively, but investors still are a bit cautious. Markets are vulnerable to Mercury retrograde energy mixed with Eclipse surprises.

Click to read this article in full on the astrologicalinvesting.com web site.  Read the interpretation of the planets in houses, the Moon phases section and get the "Head's Up" - upcoming astrological events list.

Trines,
Marley

Wednesday, July 11, 2012

Backtesting the Mars-Uranus crash cycle

Randall Ashbourne, an associate of Astrological Investing, posts a weekly market report on his web site, theidiotandthemoon.com The following  is this weekend's Eye of RA report:    Week beginning July 9, 2012

There is a very famous American financial astrologer who makes dire predictions whenever Mars is about to make a harsh aspect with the old weirdo, Uranus. So, this weekend we're going to examine the historical reality of whether there really is a Mars-Uranus crash cycle, since we have the potential for one to develop in the next couple of weeks.

And we're also going to revisit some comments I made a month ago about Jupiter's sign change to Gemini shifting the money flows.

Overall, the high-energy days for the coming week are likely to be Thursday and Friday, when both Mercury and Uranus go Retrograde ... and the Sun moves in to square Saturn. But, it is the following week which is likely to be much more volatile as Mars, now in the Cardinal (action) sign of Libra, squares Pluto and opposes Uranus

The Sun square to Saturn, coupled with Uranus going Rx as it's fired up by Mars, do symbolise a major energy shift which has the capacity to turn markets and accelerate the moves.

But, before we get to that, I want to return to some comments I made about Jupiter changing signs to Gemini.

I said: "With Jupiter in Taurus, for example, the emphasis has been on banking and debt - the Taurus/Scorpio axis; and also on technology and gold, the Aquarius/Leo axis. I think most of you will agree that banks, brokers, Apple and gold have been the topics de jour for all the time the FatBoy has been in Taurus.

Slowly, you'll see a change; transportation, travel, health, labour and oil will begin to fill the news pages."So, this weekend we're going to examine the historical reality of whether there really is a Mars-Uranus crash cycle, since we have the potential for one to develop in the next couple of weeks.

Now, let me indulge in a little bit of basic astrology for those of you unfamiliar with the arcane details of The Spooky Stuff. Jupiter was head honcho of the Old Gods and is associated with all the good things - he expands whatever he touches.

So, while he was in Taurus and opposing Scorpio, the banks and debt got exaggerated ... and because the FatBoy was squaring the Leo/Aquarius axis, the effect also impacted on gold and the technology sector.

In early June, I indicated the emphasis would start to change. Gemini rules transportation and the media; Sagittarius rules foreign travel, universities and the law; Virgo is labour, accountancy, health; and Pisces rules oil, shipping, hospitals, prisons and (with Virgo), big pharmaceuticals.

The effect of Jupiter is to expand either the supply OR the demand. I really want to emphasise that point ... the supply OR the demand.
Several news reports caught my eye during the week.

NEW YORK - US stocks have racked up solid gains in a holiday-shortened trading session, boosted by reports of strong June sales from the leading US auto makers.

Data showing that car sales in Germany are resisting the eurozone crisis drove Frankfurt's DAX 30 index up 1.26 per cent to 6,578.21 points.

DETROIT - The Big Three US car manufacturers have reported strong domestic sales for June, capping a solid first half of the year even as US economic growth overall remained weak.

DETROIT, July 3 AP - General Motors Co said its US sales rose 16 per cent in June on solid demand for small and midsize cars.

PARIS - US aircraft maker Boeing has raised its 20-year forecast for global demand for airliners by $US500 billion ($A489.21 billion).

We've also been treated to plans by News Corporation to split itself into two divisions. And, there was a very interesting story about how a massive fleet of Chinese coastal shipping - somewhere between 1500 and 2000 cargo vessels - is now competing for traffic volume worldwide because trade between northern and southern China has declined massively.

So, this is an example of how it works. Jupiter in Gemini squares the sign of Pisces, which rules shipping, and the SUPPLY of ships suddenly becomes terribly exaggerated.

Jupiter opposes Sagittarius, the sign of foreign travel, and Boeing gears up for a big increase in DEMAND.

Jupiter enters Gemini, the transportation sector, and the DEMAND for new cars surges ... or the world's biggest media conglomerate splits into TWO (always a Gemini signature!).

I revisit this issue because a sign change by Jupiter is one of the more reliable astrological predictions ... the money flow WILL change to different sectors, either the supply OR the demand will escalate dramatically in those sectors ... and there are substantial profits to be made by getting out of the former and piling into the latter.

So, it could prove to be worthwhile to look at the technical state of the charts for car manufacturers and transport companies (including railroads), big pharmaceutical companies, oil companies, media stocks, airlines ... and any companies associated with supplying services to either them, or hospitals, prisons etc.

***
Okay, now let's turn our attention to whether or not there really is a RELIABLE Mars-Uranus crash cycle. We'll concentrate purely on the opposition aspect, since that's the one due to become exact in the next couple of weeks. I do need to emphasise that this next one occurs with a simultaneous square to Pluto, so is more likely than usual to have an impact, especially since all three planets are in the early degrees of Cardinal signs.

We will begin by examining the impact on the SP500 in recent years.
Mars opp Uranus
click for larger image
We're looking at a weekly chart of the Pollyanna index and the Mars opposed Uranus aspects are marked with red bars. And it's immediately obvious that the aspect does NOT necessarily provoke a market crash. Of the seven instances marked on the chart, only two turned up near important Highs. Four of them occurred nearby important Lows.
What gets some astrologers overly-excited, is that it was one of the aspects in effect at the start of the Great Crash.
click for larger image

The chart above shows the Dow Jones Industrials from the late 1920s to early 1970s - and one can see why the arrival of Mars opposed to Uranus sets the alarm bells ringing. The aspect does have an overall tendency to occur very nearby the start of some very bad crash cycles.

But, it's not a certainty, as we can see in the chart below, which covers the Great Sideways Shuffle period in the DJIA from the early 60s to early 80s.

DJIA 1960's
click for larger image
Okay, it's almost time to stop waffling on about les Spookies and turn our attention to the techie charts. The point I wanted to make is that astrology does have its uses. There are some things it is very good at predicting reliably - which is the sector shift caused by Jupiter changing signs.

And there are other things which get some astrologers very, very excited ... but which are a tendency, rather than a reliable certainty.

At the risk of boring you all silly, I will repeat the mantra again ... Astrological expectations do NOT over-ride technical conditions!
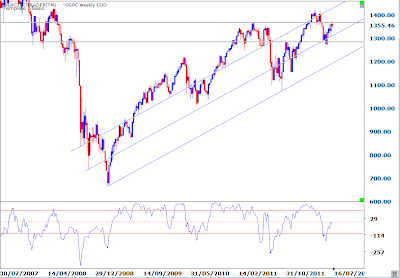
GSPC-Weekly EOD
click for larger image
As I said last week, there are only two really important horizontal lines of Support/Resistance for the 500 ... and, GeeGolly, looks like they continue to be important, eh?


And we've been discussing this one, too, for the past few weeks - expecting she'd face some hurdles at the 1340s and 1360s. We have some relatively mild divergence showing up at last week's pre-holiday peak in the height of the MACD histograms ... and the potential is showing on the earlier weekly chart for the intermediate-range Canary to be turned down from a hit of the Zero line.
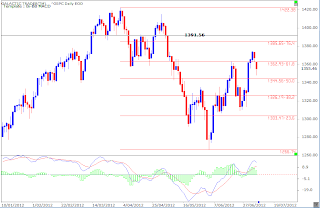
Support/Resistance SPX
click for larger image

Let's go to London's FTSE.

click for larger image
I introduced this chart a few weeks ago to show the potential for a the index to launch a rally from contact with the rising (diagonal) Sun lines ... but I'd like you to compare the planetary chart with the technical one below.
And the reason is I want to emphasise to those of you on a budget that you don't need really fancy software. In the chart below, the bounce came from a hand-drawn trendline, which then allowed us to set up some Fibonacci Retracement targets. Targets which have worked very well!

click for larger image
All of this comes back to the point that trading profitably does NOT have to be terribly difficult. WE make it difficult by clogging our brains with crap. Simple works! Simple works really bloody well. Shut out the noise ... pay attention to the simple charts you've drawn for yourself ... watch for divergence in the oscillators when Price is hitting predetermined levels of Support or Resistance.

I'll leave you once again with Auntie's Weekly Planets chart for the ASX 200.

click for larger image

Safe trading - RA

Randall Ashbourne
Astrological Investing's associate, Randall Ashbourne, author of the eBook, The Idiot and The Moon, writes a free weekly column titled, The Eye of Ra on his web site in  which he explains the potential impact of astrological aspects and the current state of technical conditions. Ashbourne's charts are revealing illustrations of exactly what has occurred in the market and the probability of what to expect.
Important reading:  Randall Ashbourne's article, Jupiter's cycle and its effects on Wall Street and a posting of the weekly Eye of Ra report in this blog, titled A look at the Venus Retrograde effect


(Disclaimer: This article is not advice or a recommendation to trade stocks; it is merely educational material.)
Copyright: Randall Ashbourne - 2011-2012


Thursday, March 1, 2012

The Jupiter Cycle and Its Effects on Wall Street

Could the position of the planet Jupiter consistently predict the timing of Bull market tops and Bear bottoms?  

According to recent research tracking 140 years of prices on Wall Street, the answer is a simple: Yes.


In the Greek mythology, Zeus/Jupiter was head honcho of the Old Gods. The ancient Greek tales, when studied in depth, are Creation stories charting the history of the world.

And the tales form the basis of the system of astrology still used in the Western world. They also have counterparts in other cultures. In Vedic astrology and the Hindu religion, for example, Zeus/Jupiter has a counterpart in the figures of Guru/Ganesh.

In both cases, this “king” of gods introduces the concept that one can break free - spiritually or materially. In brief, Jupiter is the symbol of growth and expansion.

And Jupiter’s cycle through the zodiac shows up a very interesting statistical tendency in stock markets.

Since the 1870s, Wall Street has shown a distinct tendency to peak while Jupiter is in late Aries/early Taurus … decline into Jupiter in Leo … rise again until Jupiter is in his own primary sign, Sagittarius … and drop dramatically into Jupiter in Aquarius.

The knee-jerk response of many readers will be to dismiss the assertion as superstitious nonsense. It is an understandable, if predictable, response. Most people simply don’t know anything about the complexity of astrology, its history, or the fact that the system of symbolism and prediction is based on observation by literally millions of practitioners over thousands of years.

It is simply a clearly demonstrable fact that trading The Moods of The Moon - the monthly phases of the lunar cycle - produces steady and reliable profits across any long-term time frame.

And many of those same dismissive readers will happily fork out bundles of boodle to be trained in Gann techniques, or take notice of the Bradley Model turn dates - without having a clue that both are deeply rooted in astrological aspects.

But, the proof of the pudding is in the eating and nothing paints a clearer picture than … a picture.
click to view larger image
The chart above shows The Jupiter Cycle at work since the late 1990s.

It is a monthly of the venerable Dow Jones Industrial Average and shows the statistical tendency worked perfectly at the 1999/2000 top, the 2002/03 bottom, the 2007 blow-off and the March, 2009 bottom.

The warning signals from the research are clear. If the historical tendency plays out as usual, Wall Street is reaching a peak in early 2012 and heading into a Bear market which could last until mid-2014.

In fact, the late Aries peak expected by the research data did play out on schedule in May, 2011. You’ll notice the price bars on the DJIA peaked just before the dark green solid bars which identify when Jupiter changed signs to Taurus and that the index is currently challenging that level again.

Since the May 2011 peak, Jupiter has been moving Direct and Retrograde in the early degrees of Taurus.

When I first published this chart in my Forecast 2012 early in January, I warned the position of Jupiter allowed a final rally into the first few weeks of March.

Now, the research shows a statistical tendency … not a cast-iron guarantee.

While the formula played out exactly from 1999 to 2009, there have been a few times when rallies have briefly exceeded the Jupiter in Taurus limit before diving into a Leo Bear bottom.

And 1929 was one of them.
click to view larger image

We could consider that the blow-off rally past Taurus was the technical equivalent of “a false break”. And one of the rules of a failed false break pattern is that the reversal is large and sharp, regardless of whether the break is a high or a low.

The dive into the red Jupiter in Leo bars is as obvious as the recovery rally which peaked as Jupiter again left his home sign of Sagittarius and the DJIA dropped into the first trough of a double-bottom pattern that sparked the multi-decade Bull market into the 2000/2007 peaks.

The two previous charts have shown exactly how The Jupiter Cycle performed from the late 20s to the early 40s and the late 90s to early 00s.

What is interesting to observe is how the tendency played out during the great sideways shuffle from the early 60s to 80s … and how similar that period seems to be to market performance since the 1999/2000 peak.
click to view larger image
The comparison with current market behaviour is stunning. This 20-year time frame last century was marked by sudden Bull rallies and equally sharp Bear plunges in quick succession.

And while the exact tops and bottoms fell outside the statistical tendency of The Jupiter Cycle, nevertheless there were consistent rallies into the Taurus and Sagittarius periods and sharp declines into the Leo and Aquarian periods.

Combined, the three charts show why extreme care is needed maintaining Long positions as we go further into 2012.
  • We are moving into the long-term negative tendency of Jupiter moving out of early Taurus and towards Leo, where he will take up residence from the second half of 2014 until June, 2015.
  • We are entering the exact time frame of another long-range negative astrological aspect – Uranus square Pluto, an aspect which last occurred at the bottom of the 1929-1932 crash – and the first exact hit of that aspect occurs this year in June and will continue until March, 2015.

On a technical level, Jupiter’s orbit of the Sun corresponds broadly with three and four year “cycles” in the markets. The Old God’s journey through the zodiac takes 12 years.

On my website – www.theidiotandthemoon.com – I constantly caution my readers against allowing astrological expectations to override the common sense technical conditions shown by the current state of the charts.

Accurate astrological prediction is as much a skill as it is the result of many years of study and empirical research.

Nevertheless, it’s why W.D. Gann has a large worldwide following, decades after his death – and why J.P. Morgan had the renowned astrologer, Evangeline Adams, on his payroll.

“And therefore as a stranger give it welcome.
There are more things in heaven and earth, Horatio,
Than are dreamt of in your philosophy.” – Shakespeare

About The Author

Randall Ashbourne is a former journalist and political strategist, author of the eBook, The Idiot &The Moon, which aims to provide newbie traders with the skills they need to start trading confidently.
While the book concentrates its main techniques on orthodox technical signals, Ashbourne also outlines a lunar cycle trading system he calls The Moods of The Moon and plots intermediate and long-range price targets for various indices using the planetary position of what he calls the Old Gods.
His website, www.theidiotandthemoon.com includes a free weekly column, The Eye of Ra, in which he explains the potential impact of looming astrological aspects and whether the expected symbolism is endorsed by the current state of technical conditions.