Saturday, August 16, 2014

Crash through or crash ... Mars/Saturn

Randall Ashbourne, an associate of Astrological Investing, posts a weekly market report on his web site, theidiotandthemoon.com  The following is this weekend's Eye of RA report: Week beginning August 18,  2014 
 Well, the snugglepuss session with Venus and Jupiter making kissy-smoochy in Leo is almost over.

Now the wicked warrior is heading for a confrontation with the old guy who eats children ... and Venus will throw a hissy fit with both of them.

As expected, stock markets had a nice lull in the developing storm last week as the Prince and the Showgirl headed into their leonine love-in and the general tendency for a price rise into the aspect held firm.

Now we need to think about whether such grand passion can last. Mars, in Scorpio clothing, is heading for a conjunction with Saturn. This won't be pretty. Think ... Cesare Borgia and the "charm" of a King Cobra off for a little chat with the King of Naples. Soon to be the dead, former King.

Venus will make a tense square aspect with both of them ... and the Sun leaves sunny Leo for picky Virgo, where he'll oppose Neptune.

Now, these key aspects pack enough power to turn the markets again. They're not happening this coming week, but the following one.

Last weekend, I published a chart showing the general tendency for stock prices to rise into the annual Venus-Jupiter conjunctions. Now let's take a look at the historical track record of Venus square Saturn, Mars conjunct Saturn and Sun opposed Neptune, marked below with blue, red and green bars respectively.

The other reasonably significant astrological event is that Mercury moves into Virgo this weekend. It's indicative of a mental shift, a change in thinking from grandiose speculation and bold statements to a much more measured outlook and demands for real, hard, actual evidence.

As in ... You can say you bombed a secret Russian convoy, but now it's time to show-and-tell, not just bluff, bluster and try to bravado your way through. And that's not just a matter for little Mercury. The Sun opposed Neptune may well see a "big lie" exposed for all to see.

Still, enough with all of that. Time for some techie stuff. And since it has served us none too shabbily for the past few weeks, let's return to the Dow Jones Industrials daily. I've gone back to the really basic. As expected, the Dow had a better week and managed to climb back above the orange horizontal.

But! The bounce was not enough to get the Dow back inside its longer-term rally channel. So far, it's only a retest of the rising channel's bottom line.

And ditto at a daily level for Pollyanna, the SP500.


Okay, now let's return to some specific planetary price levels. I said last weekend: "I'd have thought she (Pollyanna) should be able to climb above Mars in the coming week, and if she does, we need to watch how she handles the $1958 Node price line." If you recall, the falling Mars line was priced at 1940 for last week. Polly regained it and on Friday attempted to break through the 1958 level. And failed.

Let's hop across the Pond and consider the state of the FTSE. I've shown you the long-range planetary price chart for the German DAX a few times recently.

London made a retest of the 6526ish planetary price level during the August spike down and has bounced again.

What worries me about the bounce, though, is its weakness. I've marked the general area of this very long sideways shuffle with a couple of thin black horizontals, which also cover the previous Bull peaks.

But the Big Bird oscillator is getting very unhappy.

Okay, the ASX200, which enjoyed a stronger love-in bounceback than most other markets. As with the Dow and Pollyanna hitting either planetary price lines or technical trendline levels, the index now has to crash through ... or face the prospect of at least a mini-crash developing.

And gold. Spikes to the topside, spikes to the downside. A shiv into the Bears one day, a skewer into the Bulls the next. Personally, I remain long-range bullish and short-range totally relaxed. And bored by the games.


Safe trading - RA

Randall Ashbourne (Disclaimer: This article is not advice or a recommendation to trade stocks; it is merely educational material.)
Copyright: Randall Ashbourne - 2011-2014


Astrological Investing's associate, Randall Ashbourne, author of the eBook, The Idiot and The Moon, and The Idiot and the Moon, Forecast 2014, writes a free weekly column titled, The Eye of Ra on his web site in  which he explains the potential impact of astrological aspects and the current state of technical conditions. Ashbourne's charts are revealing illustrations of exactly what has occurred in the market and the probability of what to expect.


Important reading:  Randall Ashbourne's The Idiot and The Moon, Forecast 2014  


  Purchase Forecast 2014 and receive a special report on GOLD   

Saturday, August 9, 2014

Venus & Jupiter ... the Lion's love-in

Randall Ashbourne, an associate of Astrological Investing, posts a weekly market report on his web site, theidiotandthemoon.com  The following is this weekend's Eye of RA report: Week beginning August 11,  2014 

 
 A few weeks ago, in "Storm warnings in space", I indicated the astrological weather patterns were making a dramatic change and could generate a superstorm.

There's a good chance we'll see a lull in the storm over the next week, with Venus changing signs to Leo on Tuesday and heading for her annual conjunction with Jupiter.

In the symbolism of the Old Gods, these two are the "benefics". It's the Prince and the Showgirl heading for a kissy-smoochy love-in ... in the, uhm, theatrical sign of Leo.

Leo loves to be adored. Venus is adorable. Ask her. And Jupie ... well, he's head honcho. So, just plug Katy Perry's "Roar" into your iPod and wait out the paw-nography.

That conjunction takes place on Monday week, August 18. I suppose that amount of bliss will take a little while to come down, but it shouldn't be too long.

Because the Monday after that one, the 24th, Mars will conjunct Saturn and Venus will move to square both of them. And remember, this is not diplomatic Libran Mars ... it's fight-to-the-death Scorpio Mars.

So, let's start this weekend by looking at the past track record of the key aspects ... Venus conjunct Jupiter and Mars conjunct Saturn. In the chart below, the annual Venus-Jupiter love-ins are the blue bars; the two-yearly Mars-Saturn conjunctions are the red bars.

At least Pollyanna, the SP500, tends to rise consistently into the Venus-Jupiter aspect ... even, take note, during the Bear market from 2007 to 2009. The Mars-Saturn conjunctions aren't quite as reliable in providing strong evidence of price reversals.

I said last weekend that we should see some relief from the pressure last week. It worked for Wall Street and some other markets, but as we see increasingly now, it was far from universal.

Still, as a general indication, I'd expect Venus-Jupiter to provide a lull in this overall storm and will be interested to see just what sort of bounceback rally the Leo love-in can generate.

Before we go to Spooky Stuff planetary price charts, I thought we might return to the simple technical charts. Mercury changes signs to Virgo this coming week, so turning the "mind" to the techie side of things is really quite appropriate.

We'll start with the Dow Jones Industrials again ... and my apologies that this is now getting a little "busy". Okay, this was the one which issued the warning shot a couple of weeks ago with a break of the blue uptrend line. The January drop chomped up $1247 and last weekend the current decline had eaten $714.

I also said last weekend that the depth of the Big Bird oscillator's dive indicated the price drop had further to go. By Thursday's low, the DJI decline had reached $817.

We also took a look at the Dow's weekly chart, marked with a three-line blue uptrend channel and three orange horizontal Support and/or Resistance levels. So ... this is what happened. We got both the further price drop and the expected relief from the pressure, with the Dow still trying to stay on top of the top level of horizontal support in its weekly charts.

It will be very interesting to see if the usually positive price performance going into the Venus-Jupiter conjunctions can get the DJI back inside its uptrend channel. And that probably also now applies to the Pollyanna index. What's interesting about these two is the relative weakness of the Dow.

Note that in the earlier chart, it declined below the 382 Fibonacci Rx level, while the SP500 turned above that marker and recovered to the 236 FiboRx level on Friday.

I'll come back to Polly's planets in a moment, but there is another technical chart we need to have a look at first. I've chatted with you about the dive in the DAX and its dramatic retreat from its Pluto price high.

The German index might be double-bottoming at the level of the March Low, marked with the short, orange horizontal below. But. More to this story.

Have a look at Big Bird. Price might be same-same as March, but our long-range Canary has fallen off his perch and is gasping horribly for non-toxic air. It's a clear warning sign that the "storm" I talked about a few weeks ago hasn't blown over the horizon just yet.

Okay, enough with the techie twaddle ... let's get back to The Vacuous Troll's planetary prices. You know ... the serious stuff. Okay, last week I had the declining Mars price line at $1944 and Pollyanna's high for the week was $1942.92.

I'd have thought she should be able to climb above Mars in the coming week, and if she does, we need to watch how she handles the $1958 Node price line.

Now to my home market, the ASX. We do now have some fairly severe damage. The index has badly lost the Saturn price line, which was at 5530 for last week. It now becomes Resistance. Again.

The weekly Big Bird oscillator has also dived into unhappy mode. That sprint northwards to the 5629 Neptune level is now beginning to look more like a false break rather than a dinky-di breakout.

Safe trading - RA

Randall Ashbourne (Disclaimer: This article is not advice or a recommendation to trade stocks; it is merely educational material.)
Copyright: Randall Ashbourne - 2011-2014


Astrological Investing's associate, Randall Ashbourne, author of the eBook, The Idiot and The Moon, and The Idiot and the Moon, Forecast 2014, writes a free weekly column titled, The Eye of Ra on his web site in  which he explains the potential impact of astrological aspects and the current state of technical conditions. Ashbourne's charts are revealing illustrations of exactly what has occurred in the market and the probability of what to expect.


Important reading:  Randall Ashbourne's The Idiot and The Moon, Forecast 2014  


  Purchase Forecast 2014 and receive a special report on GOLD  

Saturday, August 2, 2014

Reviewing a few price targets

Randall Ashbourne, an associate of Astrological Investing, posts a weekly market report on his web site, theidiotandthemoon.com  The following is this weekend's Eye of RA report: Week beginning August 4,  2014 

Major stock indices went into meltdown mode last week as the money planet, Venus, fired up the long-running Uranus square with Pluto.

There is likely to be some relief from the pressure this week as Mars makes a trine with Neptune and the Sun trines Uranus.

The Moon enters Sagittarius on Tuesday and we should probably be prepared for a couple of wide-range days.

The Moon is symbolic of the public mood and Sadge exaggerates either the fear, or the optimism.

As we go into next weekend, both Mercury and the Sun will square Saturn, coinciding with the statistical low period of the Full Moon.

August can be a nasty month for stock prices, as it was in 2007 and again in 2011. But, both of those were spike Lows, with strong bouncebacks.

I indicated last weekend that the Dow Jones Industrials had fired a warning shot and the German DAX looked to be in dive mode, so there was "clear and present danger" in the markets.

It pretty much turned out that way for most of the Western indices, so let's begin this weekend by going back to the DJI chart I said then was really the only stock chart of much importance.

It was then, and remains still, a fairly basic chart with one blue uptrend line and a red horizontal price level. The daily uptrend since the early-February low is now severely broken.

The January slide wiped nearly $1250 off the price of the Dow and the decline last week has taken a $714 bite. Now remember that the high at the end of December and the mid-July high were both listed as major Bradley turn dates.


The other point I want to emphasise about the above chart is the depth to which the Big Bird oscillator has dived ... fractionally lower than it did during the drop at the start of 2014. If normalcy prevails, it's an indication the current drop has further to go.

And I think that's probably endorsed by the next chart, the DJI's weekly, starting with the major Low in 2011. Again, it's a simple chart using just a couple of techniques from The Technical Section of The Idiot & The Moon; I'm really not a fan of complicated charts.

And we have another trendline break. The Dow has closed below the lowest channel marker for the first week since this rally phase started.


I had this chart marked with three important horizontal levels and the DJI finished last week trying to stay on top of the highest of those markers.

But, as with the daily, we have had a long build-up of negative divergence in the Big Bird oscillator. In fact, the 50CCI made its highest peak back in March 2013.

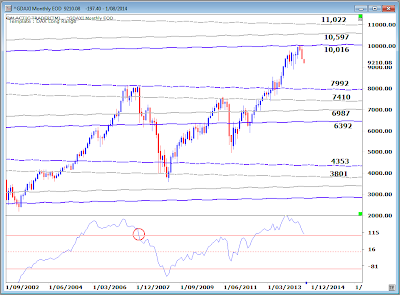
We'll go to Pollyanna's long-range planetary price chart in a moment, but have a quick look at the DAX first. That Pluto level in the early 10,000s clearly provided massive Resistance, just as the lower Pluto level did during formation of the 2007 top in the market.

Monthly Big Bird on the DAX is now getting dangerously close to losing its Bull market status. Once the oscillator loses the top red line in the oscillator panel, we can be pretty sure the big bad Bear is back.


Back to New York now and the current state of the SP500, where Pollyanna swapped her party frock for her Chicken Little outfit. The index has now lost both the Node level at $1957 and the Mars channel line, priced around $1944 for the week ahead.

Remember this is a long-range planetary price chart for the index. On the daily charts, the 500 has dropped into a zone where it could now receive a boost from rising inner planet price lines determined by the Sun, Mercury and Venus.


I didn't show you the ASX200's Weekly Planets chart last weekend, so here's the update. After the breakout above the Saturn/Uranus barrier in the 5560s, Auntie made a dash for the Neptune level in the 5600s ... and then joined the general swoon.

I indicated last weekend that if the breakout is the real deal "the negative period between New Moon and Full Moon should not cause major damage". So far, this isn't major damage. If the index can stay on top of the old Saturn resistance at 5530 by the end of this week, the old bat might just start a multi-hundred point run north.

And if she can't hold, she'll fall into a planetary price hole with no real support until several hunded dollars lower.


Gold. Yeah, yeah. Yada, yada. Waffle. Piffle. Drivel. Look, I don't give a rat's about the daily jerkarounds. One chart. Simple. Price has climbed back into and is consolidating within the upper, lower level of the monthly Bi-BBs. Both the MACD signal line and histograms are climbing. Put in your loss stops to protect your capital and go pour yourself a large gin. Sabbai, sabbai. Tidak apa apa.


Safe trading - RA

Randall Ashbourne (Disclaimer: This article is not advice or a recommendation to trade stocks; it is merely educational material.)
Copyright: Randall Ashbourne - 2011-2014


Astrological Investing's associate, Randall Ashbourne, author of the eBook, The Idiot and The Moon, and The Idiot and the Moon, Forecast 2014, writes a free weekly column titled, The Eye of Ra on his web site in  which he explains the potential impact of astrological aspects and the current state of technical conditions. Ashbourne's charts are revealing illustrations of exactly what has occurred in the market and the probability of what to expect.


Important reading:  Randall Ashbourne's The Idiot and The Moon, Forecast 2014  


  Purchase Forecast 2014 and receive a special report on GOLD