Showing posts with label 2013 Forecast. Show all posts

Friday, May 17, 2013

Gold, SP500, TSX, Europe and the ASX200

Randall Ashbourne, an associate of Astrological Investing, posts a weekly market report on his web site, theidiotandthemoon.com The following is this weekend's Eye of RA report: Week beginning May 20, 2013

Gold and price of gold
So far, the only real "sell in May" action we're seeing is in gold and mining stocks.

This week kicks off with another exact hit of the long-running Uranus square to Pluto and will end with another Full Moon Lunar Eclipse.

The Sun leaves stable and money-conscious Taurus and moves into Gemini. Volatility will increase - and in both directions. Mercury and Venus will also be in Gemini and will be joined by Mars at the end of the month.

It puts all the inner planets on course for a conjunction get-together with Jupiter. We'll take a close look at the potential implications of that next weekend; but the past two years have seen intermediate tops locked-in as the Sun and Venus conjuncted Jupiter.

Wall Street, England and Germany have now reached long-range targets published in Forecast 2013.

We'll spend this weekend looking at those targets and the technical state of the charts to see if "that's it", or whether the rally still has legs to run.

I'll update Australian readers on the state of the ASX200 and we'll take a look at the latest rundown in gold prices.

And it's gold we'll look at first.

While the topic is not raised in The Idiot & The Moon, I have on occasion discussed a technical condition called trading against a spike. The last significant one of these we saw was in stock indices in August-October, 2011. Gold now appears to be in a similar state.

Basically, what happens is this ... price produces a large-range spike; there is a strong bounceback from the low; and then the spike is retested. It is the nature of how the spike is tested which gives us an indication of whether a larger bounceback is coming, or whether the freefall continues.

The planetary charts for gold, and their explanation, were introduced in Forecast 2013 and, so far, gold continues to play to them with almost uncanny accuracy.

In the chart below, we see the sudden April plunge ... the strong bounceback ... and now the retest is underway.
click to view larger image
For a stronger bounceback to occur, or even a complete trend change, gold needs to make either a higher low, or only a marginal new low. The higher low would come from around 1337 and a marginal new low should not go significantly below the rising, primary Sun line currently priced at 1320.

The reality is that for gold to recover, stock indices probably need to drop ... and that's what we'll spend this weekend looking at.

At various times recently, I've published this chart for Pollyanna, the SP500, indicating the index may have been on a run between Uranus/Pluto planetary barriers. The target price was around 1610, though I did warn there was a higher target in the 1660s.

And ...

click to view larger image
It's interesting to see how Polly has dealt with these Uranus/Pluto price zones since bouncing off one late in 2012 to launch into very strong rally mode - the resistance has been overcome by forced jumps over the hurdles. The next Uranus/Pluto zone is the 1700s.

However, let's look at where the index is in relation to the long-range planetary targets I published in January, in Forecast 2013. The index is now hitting against strong resistance from a Node barrier. The next highest target is Pluto at 1719.

click to view larger image
We are, however, entering the statistically negative period between the 1Q and Full Moons ... and with Polly having breached the topside of the Bi-BBs. As explained in The Technical Section of the book, a breach of the upper or lower outer bands tends to cause either a sideways shuffle, or a countertrend.

Last week's price action breached the weekly upper band for only the second time in years. The previous one prompted a 9-week decline after some initial sideways shuffling. One other thing to note is that all the declines so far have travelled the full width of the bands ... so, IF one starts in the next week or two, the history suggests Chicken Little is going to want to slash 200 points from Polly.

click to view larger image
The other warning sign on the chart above relates to the condition of the fast MACD histogram peaks. The signal lines are fine. But the histogram peaks have been in constant decline throughout the rally from October, 2011.

Okay. The two other Western indices as brightly optimistic as Polly are the FTSE and the DAX. We'll deal first with Germany, which has had a breakout above the major price target published in the Forecast.

Ten-thousand plus seems like a fairytale target. But, that's the next major planetary barrier for the DAX.

click to view larger image
The planetary lines in the chart above are set at their maximum width. However, I used them because the German index has a strong track record of actually reaching them and they cannot be dismissed lightly. But we can use a Fibonacci Extension tool as a guide to potential targets within the 2000 points of "empty" space above.

Even so, the nearest higher target is several hundred more points away. AND all 3 Canaries - short, medium and long-range - are not at all unhappy.

click to view larger image
The FTSE's long-range planetary price chart is below and I discussed in Forecast 2013 how the 6300s would be a difficult area, given the index's history of stalling at Uranus/Pluto zones. London has had a strong breakout after the months-long stall in that zone ... and also broken above the Neptune barrier which stopped the 2007 Bull run.

click to view larger image
And in the chart below, the long-range Canary is singing quite happily. Note the divergence which slowly built in the indicator (the blue line in the lower oscillator panel) as price rose into the 2007 Bull peaks ... and note especially that there is absolutely no sign of divergence in its current readings.

click to view larger image
Paris is next and I again use the chart from Forecast 2013. The CAC40 finally managed to break free of the 3800 price zone.

click to view larger image
Since the CAC is not breaking out to new Bull market highs, we need to pay attention to the Fibonacci Retracement levels. There is very strong positive divergence evident in the FiboRx chart below. None of these oscillators has been this happy since the post-2009 recovery began and the higher FiboRx levels correspond with the potential planetary targets.
click to view larger image
Returning now to North America for a look at the Canadian market. The TSX is in a similar state to the CAC40 ... ie: well below its earlier recovery high.

click to view larger image
Now to my home market, Australia. Again, probably the most important thing on the chart is the state of the long-range Canary. While the short-term and medium range Birds are declining, the long-range line has hit new peaks. No negative divergence building, as it did during the push into the 2007 highs.

click to view larger image
Auntie's Weekly Planets chart is below. After being blocked by a Neptune level in March and April, the index is now testing support on top of the line - and the price targets, if it succeeds, are obvious.

click to view larger image
However, there is a warning sign flashing. The long-range Canary is holding above the +100 level, but appears to be increasingly unhappy. Remember this is a weekly chart - and the negative divergence is not present in the monthly chart.

Which suggests that any short to medium range price weakness in the index will be overcome and that higher prices are not merely possible, but are probable, over the course of the year.

Safe trading - RA

Randall Ashbourne
Astrological Investing's associate, Randall Ashbourne, author of the eBook, The Idiot and The Moon, and The Idiot and the Moon, Forecast 2013, writes a free weekly column titled, The Eye of Ra on his web site in  which he explains the potential impact of astrological aspects and the current state of technical conditions. Ashbourne's charts are revealing illustrations of exactly what has occurred in the market and the probability of what to expect.
Important reading:  Randall Ashbourne's The Idiot and The Moon, Forecast 2013 , Jupiter's cycle and its effects on Wall Street and a posting of the weekly Eye of Ra report in this blog, titled A look at the Venus Retrograde effect
(Disclaimer: This article is not advice or a recommendation to trade stocks; it is merely educational material.)
Copyright: Randall Ashbourne - 2011-2013

The Idiot and the Moon, Forecast 2013
  • Major trend change dates for the full year, plus a month-by-month breakdown of high-energy trading dates and critical reversal dates.

  • An index-by-index analysis of Moon Trading across major American, European, Asian and Australian stock indices-

  • Identifies the major indices where following the phases of the Moon can dramatically cut profits, or even result in large losses.

  • Old Gods & Gold ... a Eureka! discovery about exactly what drives gold prices during rallies and corrections and charts showing highly-reliable target levels to both the upside and downside.

These price charts are individually-tailored to each index and cover Wall Street, Australia, Canada, Hong Kong, Singapore, Shanghai, India, England, Germany and France.

You will not see these charts anywhere else on the Internet!

And much more...

It is NEVER too late in the year to have this monthly information!

Friday, May 10, 2013

The Jupiter squares ... how to make money

Randall Ashbourne, an associate of Astrological Investing, posts a weekly market report on his web site, theidiotandthemoon.com The following is this weekend's Eye of RA report: Week beginning May 13, 2013

Jupiter Squares - Cancer, Capricorn, Aries and Libra This weekend I'm going to depart from the normal format to discuss Jupiter's travels through the zodiac ... and how that causes bumps and slumps in groups of stocks.

In tech-speak, we call it "sector rotation". We've all seen it in action; investors seem to fall in love with stocks in particular groupings and they fly into the sky like Icacrus ... before their popularity fades and they tumble back down to earth.

Well, we can forecast this by watching Jupiter.

I first learned this from my old friend, the late Kaye Shinker, one of the real pioneers of research into financial astrology at a practical level.

I will explain it as simply as possible. The principle behind Jupiter symbolism is to "expand" whatever it touches. The down-to-earth meaning is that Jupiter will increase either the demand for OR the supply of a particular product as he travels through the zodiac, spending about a year in each sign before moving onto the next one.

Products ruled by Jupiter's current sign position will tend to suffer a glut. VERY bad for stock prices in that area. Products covered by the signs Jupiter is squaring will tend to be in short supply AND high demand. Very GOOD for stock prices.

We'll see how this works in action by looking at some charts.

Now what Kaye discovered is that The Jupiter Effect takes place while the FatBoy travels from the middle-range of one sign to the middle-range of the next.

Jupiter is now at 19 degrees of Gemini heading onto Cancer - and that means we are now starting the early stages of what should turn out to be a massive sector rotation over the coming year.

To be frank, Jupiter in a particular sign does not necessarily produce a glut. It is one of the reasons I am so constantly nagging you that astrological expectations do NOT over-ride technical conditions.

But, let me show you. Jupiter in Gemini should have had a dramatic impact on: telecommunications, media, travel, broadcasting. I am using Incredible Charts monthly data for all the charts in this weekend's edition - and we begin with the telecoms index of the ASX.

As we can see from the chart, Jupiter in Gemini prompted a very strong rally in telecom share prices over the past year.
click to view larger image
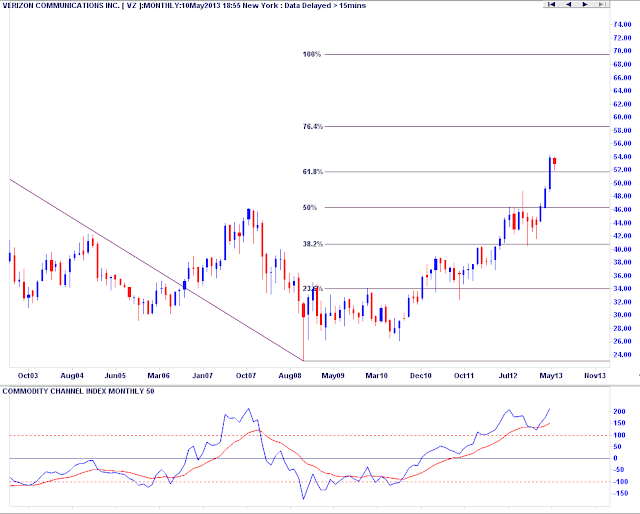
Now, if we had known ahead of time that there would be some sort of big move in communications, we could have fine-tuned our stock buys for the year ahead ... looking at, say, two of the Dow's biggest companies, Verizon and AT&T.
click to view larger image

click to view larger image
Now, these two Dow components did not enjoy quite the same strength as the ASX telecoms index. And it wasn't a particularly good year in terms of phone wars for some electronics companies.

But, what happened to stocks from those sectors that Jupiter was squaring? Well, from Gemini, the squares were to Pisces, which rules shipping, oil, alcohol, drugs and "dreams" and to Virgo, which has rulership of health and hygiene.

Here's Chevron ... which is now making all-time highs!
click to view larger image
And here's what happened with perhaps the ultimate dream/fantasy/celluoid stock, Disney ...

click to view larger image
And here's what happened with healthcare stocks over the past year, seen through the lens of the ASX healthcare index ...
click to view larger image
We get some idea from these charts exactly HOW The Jupiter Effect works. Some of the Gemini-type stocks, like the phone makers, had an awful year, while there was a glut of that Gemini trait "talk", increasing the demand for telecom service providers.

But, some of the biggest winners from the past year were from the "square" areas - Pisces and Virgo. Now, a word of warning! You'll notice that the tech signals in those stocks are starting to roll over.

And that's because from where he is now, in mid-Gemini, Jupiter's travels will cause a major shift in investor thinking.

Cancer, his next sign, and taking into account Capricorn (the sign opposite Cancer), will impact: food, restaurants, farms, hotels, restaurants, building supplies, household appliances and dwellings of all kinds.

The two signs that will be "squared" are Aries and Libra. Aries is military gear, heavy machinery, iron, steel, engineering. Libra is luxury goods, copper, jewels.

So, while it might not seem like it at the moment, it is highly likely that mines and miners and heavy industrials are about to make a big comeback.

That's the astrological expectation! But, do the technical conditions support the theory?

Well, here's the ASX materials index ...

click to view larger image
The index may now be starting that turn. On weekly charts, firms like BHP and Rio Tinto appear to be forming a long-term bottom. The effect may also impact on firms like Caterpillar, which had a very strong rise while Jupiter was actually in Aries.

click to view larger image
As well as strong miners, and heavy machinery makers like Caterpillar, we should also be trawling through our lists of engineering and building companies. The ASX engineering index chart, below, is showing signs of a potential turn northwards
click to view larger image
However, with the Cancer symbolism starting to come into play, we also need to watch for changes in the popularity of building supply companies - like Home Depot, for example.

click to view larger image
 And since Cancer specifically rules things like food we need to be aware there will be either a food glut OR food shortages.

Cancer rules consumer staples. But Libra is coming into "square" and Libra rules consumer discretionary items. Here is the ASX consumer staples index ...

click to view larger image
And below is the ASX consumer discretionary index ...
click to view larger image
Please note the vastly different status of the long-range Canary on these charts ... consumer staples are showing signs of topping-out and consumer discretionary is showing marked positive divergence.

Cancer/Capricorn also rules real estate and office accommodation. Below is the ASX property trust index ...

click to view larger image
And below is the chart of the ASX industrials index ...

click to view larger image
Okay. By now you should have some grasp of what stocks you need to start considering with caution ... and which ones have the potential to rise strongly over the course of the next year.

I stress that I have only scratched the surface here! Individual stocks having strong Jupiter transits can resist the Icarus dive for a while; and "square" stocks suffering strong Saturn aspects to their first trade chart might NOT rise as strongly as some others within the sector rotation.

Again. You MUST use a technical oscillator to help determine the direction of your trades! The purpose of this weekend's edition is to get you to start thinking about the impact of a large-scale shift in investor thinking and emphasis, now starting to get underway and which will gather momentum over the next year.

You need to remember the very first rule of trading successfully - Buy Low, Sell High! It's time to go through your portfolio stocks and look to exit those sectors starting to roll over from highs ... and start identifying those which appear to have spent some time trying to lock in a solid base from which to launch an Icarus flight.

The individual stocks will vary from market to market, but the overall principle of The Jupiter Effect knows no international boundaries.

The Jupiter squares to Aries and Libra should cause price increases for things like iron ore, steel, copper, heavy machinery and military gear, as well as luxury goods and consumer discretionary items.

It MAY cause an increase in demand for real estate and/or office accommodation, rather than a glut of supply. But, exactly which of these actually manifests will depend on local conditions.

If you're using The Idiot system properly across the three timeframes AND using one of the recommended oscillators to look for either positive or negative divergence, you should have no trouble identifying the stocks you need to be selling now ... and those showing the potential to run hard and run fast over the next year.

Safe trading - RA

Randall Ashbourne
Astrological Investing's associate, Randall Ashbourne, author of the eBook, The Idiot and The Moon, and The Idiot and the Moon, Forecast 2013, writes a free weekly column titled, The Eye of Ra on his web site in  which he explains the potential impact of astrological aspects and the current state of technical conditions. Ashbourne's charts are revealing illustrations of exactly what has occurred in the market and the probability of what to expect.
Important reading:  Randall Ashbourne's The Idiot and The Moon, Forecast 2013 , Jupiter's cycle and its effects on Wall Street and a posting of the weekly Eye of Ra report in this blog, titled A look at the Venus Retrograde effect
(Disclaimer: This article is not advice or a recommendation to trade stocks; it is merely educational material.)
Copyright: Randall Ashbourne - 2011-2013

The Idiot and the Moon, Forecast 2013
  • Major trend change dates for the full year, plus a month-by-month breakdown of high-energy trading dates and critical reversal dates.

  • An index-by-index analysis of Moon Trading across major American, European, Asian and Australian stock indices-

  • Identifies the major indices where following the phases of the Moon can dramatically cut profits, or even result in large losses.

  • Old Gods & Gold ... a Eureka! discovery about exactly what drives gold prices during rallies and corrections and charts showing highly-reliable target levels to both the upside and downside.

These price charts are individually-tailored to each index and cover Wall Street, Australia, Canada, Hong Kong, Singapore, Shanghai, India, England, Germany and France.

You will not see these charts anywhere else on the Internet!

And much more...

It is NEVER too late in the year to have this monthly information!


Sunday, April 14, 2013

Gold ... and WPs for Western indices

Randall Ashbourne, an associate of Astrological Investing, posts a weekly market report on his web site, theidiotandthemoon.com The following is this weekend's Eye of RA report: Week beginning April 15, 2013

Gold and weekly planets for Western indices


Gold plunged dramatically on Friday, ostensibly because Cyprus needs to unload $525 million of its gold reserves to help pay for the island's bail-out.

The plunge came only a day after Goldman Sachs urged customers to Short gold, with a target of $1450.

In the background is Germany's order to repatriate its French and USA bullion back to home soil.

Reportedly, the US Federal Reserve has told the Germans it will take 7 years to ship the 300 tons.  That's a bit odd, given the number of ships sitting idle. And it makes you wonder whether Pussy Galore could be bothered raiding Fort Knox these days.

Still, we should probably leave the conspiracy theories alone. The Spooky Stuff is quite weird enough ... and we'll be taking a look at some of that in relation to gold in a moment or two.

Meanwhile, the Wall Street stock indices play out the normal April strength while most other major world indices have been correcting for weeks.

In the coming week, the Sun, Venus and Mars all move out of Aries and into Taurus. Venus, ruler of boodle, is the only one of them literally at home in Taurus, which is a far more stable energy than the volatility of Arien fire.

I'll publish updates of planetary charts for a few of the Western indices in this edition, but we'll deal first with gold. Last week was marked in Forecast 2013 as a potential major turning point for gold prices.

And it turned out to be one where major planetary support at 1518 was broken with ease.

click to view larger image


I mentioned last weekend that I am indebted to American astrologer, Pat Hardy, for sharing this chart of gold, timed for the first sale of the modern era when legal restrictions on Americans owning gold were lifted. Pat runs the Energies, Trends, Cycles website at: http://www.pathardytrends.com

She produced this "birth" chart for gold trades after getting access to the hand-written logs from the floor of the Chicago Mercantile Exchange.

You'll probably have to do a bit of scrolling here to understand what I'm talking about, especially if your knowledge of astrology is scant. The inner wheel contains the planets for the first trade and the outer wheel shows the current position of transiting planets.

In the slice of the pie marked with a 2, note that Uranus, the Sun, Mars and Venus were all in Aries last week opposing gold's natal Pluto at 09.13 Libra (the 8th House). Uranus in hard aspect to Pluto - a theme we've been talking about for a long time now, though in a broader context.

In the original birth chart, the Sun and Pluto are squared ... so transiting oppositions to Pluto also square gold's natal Sun at 09.33 Capricorn. And, of course, the transiting Pluto, is conjuncting that Sun. Short version ... it's all a big deal; there's a lot of volatile energy and since Uranus is in the transit mix there will be "surprise" breakouts AND breakdowns and "normal" support/resistance levels will be sliced through like warm butter.

And the volatility is not over yet, because with the Sun, Venus and Mars now moving into Taurus, they'll all oppose gold's natal Uranus at 01.52 Scorpio (9th House).

However, there is also other symbolism at work - and that relates to the position of transiting Jupiter and Saturn. Jupiter is currently finishing a transit of gold's 4th House and will move into the 5th, which is the house with general rulership of gold and, specifically, of financial speculation. It's the gambler's house ... and the FatBoy just lurvs a good roll of the dice and spin of the wheel!

Transiting Saturn is at 09.21 Scorpio in the 9th House, moving towards a conjunction with gold's Midheaven. Now, in the chart of an individual there is a time to put yourself Out There and a time when progress in the outer world is extremely difficult. The difficult time is when Saturn travels through what Grant Lewi used to call "the obscure sector" - the first quadrant of the chart from the Ascendant to the start of the 4th House.

Once it moves past the 4th House, it is a time when we make rapid progress in the world ... and, with most people, Saturn conjuncting the Midheaven means a major career peak. The reality is it's a time when we get the recognition we deserve. For a few, that can mean ... Do not pass go, do not collect $200, Go directly to jail. Saturn's like that. Hey, we're talking about an Old God who ate his own babies!

Anyway, my point here is that both Jupiter and Saturn are past "the obscure sector" and rising in gold's natal chart. While Saturn conjunct the MC gives you the public position you deserve, Jupiter conjuncting the MC suddenly brings an unbelievable rise out-of-the-blue.

So, while the current transits to gold's natal Sun/Pluto square ... and to Uranus ... predict high-levels of volatility and sudden moves, the overall symbolism from the Jupiter/Saturn transit positions means it is very unlikely gold's bull run is finished.

And now that we've reviewed les Spookies, let's look at the technical conditions, starting with the big picture view. Below is a log-scale chart of greenback gold. See the big spike on the left as American investors piled into gold once the legal restrictions were lifted.

click to view larger image

From about the middle of the chart, we see the modern Bull run. The first significant correction lost 22% in 5 months; the second lost 29.5% in 7 months. And for the past 19 months we've been in a sideways shuffle/correction which, at Friday's close, brought down the price by 21.7%. We've had an overbalance of Time, but not of Price - not so far!

The Canary, in this case a medium-range 20CCI, has plunged to a trough level not seen for a very long time - and I've put in a grey line so you can more easily see how this trough compares with previous ones. Taking a cue from the oscillator alone, this plunge is not finished.

So, what about the planetary charts? Well, below is a weekly. The lines currently priced at 1542 and 1518 have been important before, both as Resistance and as Support.

click to view larger image
Goldman Sachs mentioned a Short target of 1450 - and there is a planetary line at that level, albiet not a particularly strong one.

Next chart is the daily ...
click to view larger image

And the interesting thing about the daily is that despite the depth of the price plunge, the Canary has not fallen so deeply as its previous trough.

It means the probability of a bounceback is strong - but may not last long.

Okay ... onto the stock markets. Firstly, the SP500.
click to view larger image

We've had a breakout above the orange Node line at 1572. I had thought it would hold for a larger correction, as most other major indices have endured. But, Pollyanna is still all goo-goo/ga-ga. It's not shown on this chart, but the breakout arrived on Wednesday when overnight trade forced a gap Open above the line.

If it's a false break, Chicken Little will be back real soon. If it's not, then the index may be embarked on a run between Uranus/Pluto planetary barriers. This long-running Santa rally began with a touch of the Uranus/Pluto zone I've marked with a yellow oval at the bottom of the chart.

Along the way, it stalled at and then had a false break of Uranus/Pluto and corrected down into Saturn ... Twice; Both of which I've marked with circled 1s and 2s. So, the target for a third repeat performance would be 1608 to 1610.

click to view larger image

The Nasdaq 100 Weekly Planet chart is above. What we'd thought was a potential Head&Shoulders pattern developing may now have morphed into something else (as they often do!). The fast MACD though, either in its signal line peaks or the height of its histograms, grows increasingly unhappy with the rally.

Over to Germany ...
click to view larger image
And onto the FTSE ...
click to view larger image
And, finally, Auntie ... the ASX 200

click to view larger image

Safe trading - RA

Randall Ashbourne
Astrological Investing's associate, Randall Ashbourne, author of the eBook, The Idiot and The Moon, and The Idiot and the Moon, Forecast 2013, writes a free weekly column titled, The Eye of Ra on his web site in  which he explains the potential impact of astrological aspects and the current state of technical conditions. Ashbourne's charts are revealing illustrations of exactly what has occurred in the market and the probability of what to expect.
Important reading:  Randall Ashbourne's The Idiot and The Moon, Forecast 2013 , Jupiter's cycle and its effects on Wall Street and a posting of the weekly Eye of Ra report in this blog, titled A look at the Venus Retrograde effect
(Disclaimer: This article is not advice or a recommendation to trade stocks; it is merely educational material.)
Copyright: Randall Ashbourne - 2011-2013

The Idiot and the Moon, Forecast 2013
  • Major trend change dates for the full year, plus a month-by-month breakdown of high-energy trading dates and critical reversal dates.

  • An index-by-index analysis of Moon Trading across major American, European, Asian and Australian stock indices-

  • Identifies the major indices where following the phases of the Moon can dramatically cut profits, or even result in large losses.

  • Old Gods & Gold ... a Eureka! discovery about exactly what drives gold prices during rallies and corrections and charts showing highly-reliable target levels to both the upside and downside.

These price charts are individually-tailored to each index and cover Wall Street, Australia, Canada, Hong Kong, Singapore, Shanghai, India, England, Germany and France.

You will not see these charts anywhere else on the Internet!

And much more...

It is NEVER too late in the year to have this monthly information!


Saturday, January 26, 2013

2013's first major trend change date

Randall Ashbourne, an associate of Astrological Investing, posts a weekly market report on his web site, theidiotandthemoon.com The following is this weekend's Eye of RA report: Week beginning January 28, 2013

Sun square Saturn / Jupiter Stationing Direct, Jan 30, 2013
This week kicks off with a critical reversal date, the first for 2013.

The Bradley Model roadmap for the year suggests that whatever starts this week won't undergo another major change of direction until the later part of June.

Triggers for the potential change are the Sun making a square aspect with Saturn and Jupiter shifting to Direct from Retrograde.

In a moment, we'll take a look at the track record of both these events, due to occur on Wednesday, NY time. While many markets have been rising steadily into this timeframe, it would be unusual - statistically - for them to top out going into the Full Moon.

The FM-3Q period, which covers all of the coming week, is normally a relatively strong rally period.

Those of you who have access to Forecast 2013 will know that last year, many of the world's top stock indices put on most of their gains during this 7-day lunar phase.

The SP500 put on 7% during the FM-3Q periods; India's Nifty, Germany's DAX and Hong Kong's Hang Seng rose 19%, 18% and 17% respectively; Singapore rose 12% and the ASX200 put on 10%, which was almost its total gain for 2012.

So, expecting a major trend change to develop here does fly in the face of the "normal" statistical tendency for many markets to rise strongly during this lunar phase. Last year, this phase was negative only 3 of the 12 times for the SP500.

Let's take a look at past performance of Jupiter going Direct and the Sun squaring off with Saturn ...

We'll use a weekly chart of Pollyanna, the SP500 - with the arrowed blue bars showing the weeks Jupiter changed to Direct and the red bars the weeks in which the Sun squared Saturn.

Of the past 6 Jupiter signatures, three came in nearby significant lows and the others led to a downturn for at least a few weeks. Of the 14 Sun/Saturn squares, 4 produced intermediate tops.

The combined strength of the two signatures, happening on the same day this week and with some negative reinforcement from Mars making a parallel aspect with Saturn, is enough to cause a trend change.

But, even if it does happen, I have some doubts that it will continue all the way to late June. And that's because my big Canary is still warbling sweetly.
Click image for larger view

Note that the oscillator has hit a new peak in line with the higher price of the SP500 weekly. In brief, no negative divergence warning.

It means, under normal circumstances, that we have not yet seen the index hit its highs for the year. It is, of course, now within a few dollars of one of the major planetary price levels which should cause a downwards reaction ... and there is resistance overhead from a channel line.
Click image for larger view

The Nasdaq 100, NDX, still can't close above the Uranus barrier which has blocked its rise for the past month ... still leaving the potential to form the right shoulder of a negative pattern. If you're trading the Nasdaq, it would be worth keeping a close eye on that level, as well as consulting the Moon Trading results on Page 24 of the Forecast.

Across the lakes ..
Click image for larger view

Canada's TSX60 (capped) continues its rise. This appears to be a Uranus-to-Uranus zone bounce and stalling here would not be a surprise. The current height of the histograms is a tad negative, even though the MACD signal lines are strong. As with Pollyanna, though, Toronto probably has higher prices as its target over the course of the year.

London is next ..
Click image for larger view

When I last published this chart for the January 14 edition, the FTSE was sitting at 6101 and I said: " ...there's a chance it's on a run between Uranus/Pluto barriers. If so, it's heading to somewhere between the 6200s and 6400s before real trouble starts."

It's now well inside that zone ... and with no warning klaxons going off in the fast MACD.

Mumbai...
Click image for larger view

India's Nifty hasn't done much since we last looked at its Weekly Planets chart, still testing the validity of a Neptune level. The oscillator is showing signs of negative divergence, but there is little reason to be unduly concerned while price holds the Neptune line and the Canary maintains itself above the +100 upper red line in the indicator panel.

 Singapore ...
Click image for larger view
The Straits Times Index still appears to be engaged in a run to Neptune in the low 3300s. The MACD histograms are making progressively lower peaks, though the signal line is strong. This Neptune has stopped the STI twice before and the index is unlikely to breakout strongly above it, without first retesting the support levels of the Saturn lines.

Australia ...
Click image for larger view

No oscillator divergence; the Canary is happy singing away. Happy Australia Day!

Safe trading - RA

Read January 21, 2013, Click Here.

Randall Ashbourne
Astrological Investing's associate, Randall Ashbourne, author of the eBook, The Idiot and The Moon, and The Idiot and the Moon, Forecast 2013, writes a free weekly column titled, The Eye of Ra on his web site in  which he explains the potential impact of astrological aspects and the current state of technical conditions. Ashbourne's charts are revealing illustrations of exactly what has occurred in the market and the probability of what to expect.
Important reading:  Randall Ashbourne's The Idiot and The Moon, Forecast 2013 , Jupiter's cycle and its effects on Wall Street and a posting of the weekly Eye of Ra report in this blog, titled A look at the Venus Retrograde effect
(Disclaimer: This article is not advice or a recommendation to trade stocks; it is merely educational material.)
Copyright: Randall Ashbourne - 2011-2013

The Idiot and the Moon, Forecast 2013
  • Major trend change dates for the full year, plus a month-by-month breakdown of high-energy trading dates and critical reversal dates.

  • An index-by-index analysis of Moon Trading across major American, European, Asian and Australian stock indices-

  • Identifies the major indices where following the phases of the Moon can dramatically cut profits, or even result in large losses.

  • Old Gods & Gold ... a Eureka! discovery about exactly what drives gold prices during rallies and corrections and charts showing highly-reliable target levels to both the upside and downside.

These price charts are individually-tailored to each index and cover Wall Street, Australia, Canada, Hong Kong, Singapore, Shanghai, India, England, Germany and France.

You will not see these charts anywhere else on the Internet!

And much more...