Showing posts with label Jupiter in Gemini. Show all posts

Friday, May 17, 2013

Gold, SP500, TSX, Europe and the ASX200

Randall Ashbourne, an associate of Astrological Investing, posts a weekly market report on his web site, theidiotandthemoon.com The following is this weekend's Eye of RA report: Week beginning May 20, 2013

Gold and price of gold
So far, the only real "sell in May" action we're seeing is in gold and mining stocks.

This week kicks off with another exact hit of the long-running Uranus square to Pluto and will end with another Full Moon Lunar Eclipse.

The Sun leaves stable and money-conscious Taurus and moves into Gemini. Volatility will increase - and in both directions. Mercury and Venus will also be in Gemini and will be joined by Mars at the end of the month.

It puts all the inner planets on course for a conjunction get-together with Jupiter. We'll take a close look at the potential implications of that next weekend; but the past two years have seen intermediate tops locked-in as the Sun and Venus conjuncted Jupiter.

Wall Street, England and Germany have now reached long-range targets published in Forecast 2013.

We'll spend this weekend looking at those targets and the technical state of the charts to see if "that's it", or whether the rally still has legs to run.

I'll update Australian readers on the state of the ASX200 and we'll take a look at the latest rundown in gold prices.

And it's gold we'll look at first.

While the topic is not raised in The Idiot & The Moon, I have on occasion discussed a technical condition called trading against a spike. The last significant one of these we saw was in stock indices in August-October, 2011. Gold now appears to be in a similar state.

Basically, what happens is this ... price produces a large-range spike; there is a strong bounceback from the low; and then the spike is retested. It is the nature of how the spike is tested which gives us an indication of whether a larger bounceback is coming, or whether the freefall continues.

The planetary charts for gold, and their explanation, were introduced in Forecast 2013 and, so far, gold continues to play to them with almost uncanny accuracy.

In the chart below, we see the sudden April plunge ... the strong bounceback ... and now the retest is underway.
click to view larger image
For a stronger bounceback to occur, or even a complete trend change, gold needs to make either a higher low, or only a marginal new low. The higher low would come from around 1337 and a marginal new low should not go significantly below the rising, primary Sun line currently priced at 1320.

The reality is that for gold to recover, stock indices probably need to drop ... and that's what we'll spend this weekend looking at.

At various times recently, I've published this chart for Pollyanna, the SP500, indicating the index may have been on a run between Uranus/Pluto planetary barriers. The target price was around 1610, though I did warn there was a higher target in the 1660s.

And ...

click to view larger image
It's interesting to see how Polly has dealt with these Uranus/Pluto price zones since bouncing off one late in 2012 to launch into very strong rally mode - the resistance has been overcome by forced jumps over the hurdles. The next Uranus/Pluto zone is the 1700s.

However, let's look at where the index is in relation to the long-range planetary targets I published in January, in Forecast 2013. The index is now hitting against strong resistance from a Node barrier. The next highest target is Pluto at 1719.

click to view larger image
We are, however, entering the statistically negative period between the 1Q and Full Moons ... and with Polly having breached the topside of the Bi-BBs. As explained in The Technical Section of the book, a breach of the upper or lower outer bands tends to cause either a sideways shuffle, or a countertrend.

Last week's price action breached the weekly upper band for only the second time in years. The previous one prompted a 9-week decline after some initial sideways shuffling. One other thing to note is that all the declines so far have travelled the full width of the bands ... so, IF one starts in the next week or two, the history suggests Chicken Little is going to want to slash 200 points from Polly.

click to view larger image
The other warning sign on the chart above relates to the condition of the fast MACD histogram peaks. The signal lines are fine. But the histogram peaks have been in constant decline throughout the rally from October, 2011.

Okay. The two other Western indices as brightly optimistic as Polly are the FTSE and the DAX. We'll deal first with Germany, which has had a breakout above the major price target published in the Forecast.

Ten-thousand plus seems like a fairytale target. But, that's the next major planetary barrier for the DAX.

click to view larger image
The planetary lines in the chart above are set at their maximum width. However, I used them because the German index has a strong track record of actually reaching them and they cannot be dismissed lightly. But we can use a Fibonacci Extension tool as a guide to potential targets within the 2000 points of "empty" space above.

Even so, the nearest higher target is several hundred more points away. AND all 3 Canaries - short, medium and long-range - are not at all unhappy.

click to view larger image
The FTSE's long-range planetary price chart is below and I discussed in Forecast 2013 how the 6300s would be a difficult area, given the index's history of stalling at Uranus/Pluto zones. London has had a strong breakout after the months-long stall in that zone ... and also broken above the Neptune barrier which stopped the 2007 Bull run.

click to view larger image
And in the chart below, the long-range Canary is singing quite happily. Note the divergence which slowly built in the indicator (the blue line in the lower oscillator panel) as price rose into the 2007 Bull peaks ... and note especially that there is absolutely no sign of divergence in its current readings.

click to view larger image
Paris is next and I again use the chart from Forecast 2013. The CAC40 finally managed to break free of the 3800 price zone.

click to view larger image
Since the CAC is not breaking out to new Bull market highs, we need to pay attention to the Fibonacci Retracement levels. There is very strong positive divergence evident in the FiboRx chart below. None of these oscillators has been this happy since the post-2009 recovery began and the higher FiboRx levels correspond with the potential planetary targets.
click to view larger image
Returning now to North America for a look at the Canadian market. The TSX is in a similar state to the CAC40 ... ie: well below its earlier recovery high.

click to view larger image
Now to my home market, Australia. Again, probably the most important thing on the chart is the state of the long-range Canary. While the short-term and medium range Birds are declining, the long-range line has hit new peaks. No negative divergence building, as it did during the push into the 2007 highs.

click to view larger image
Auntie's Weekly Planets chart is below. After being blocked by a Neptune level in March and April, the index is now testing support on top of the line - and the price targets, if it succeeds, are obvious.

click to view larger image
However, there is a warning sign flashing. The long-range Canary is holding above the +100 level, but appears to be increasingly unhappy. Remember this is a weekly chart - and the negative divergence is not present in the monthly chart.

Which suggests that any short to medium range price weakness in the index will be overcome and that higher prices are not merely possible, but are probable, over the course of the year.

Safe trading - RA

Randall Ashbourne
Astrological Investing's associate, Randall Ashbourne, author of the eBook, The Idiot and The Moon, and The Idiot and the Moon, Forecast 2013, writes a free weekly column titled, The Eye of Ra on his web site in  which he explains the potential impact of astrological aspects and the current state of technical conditions. Ashbourne's charts are revealing illustrations of exactly what has occurred in the market and the probability of what to expect.
Important reading:  Randall Ashbourne's The Idiot and The Moon, Forecast 2013 , Jupiter's cycle and its effects on Wall Street and a posting of the weekly Eye of Ra report in this blog, titled A look at the Venus Retrograde effect
(Disclaimer: This article is not advice or a recommendation to trade stocks; it is merely educational material.)
Copyright: Randall Ashbourne - 2011-2013

The Idiot and the Moon, Forecast 2013
  • Major trend change dates for the full year, plus a month-by-month breakdown of high-energy trading dates and critical reversal dates.

  • An index-by-index analysis of Moon Trading across major American, European, Asian and Australian stock indices-

  • Identifies the major indices where following the phases of the Moon can dramatically cut profits, or even result in large losses.

  • Old Gods & Gold ... a Eureka! discovery about exactly what drives gold prices during rallies and corrections and charts showing highly-reliable target levels to both the upside and downside.

These price charts are individually-tailored to each index and cover Wall Street, Australia, Canada, Hong Kong, Singapore, Shanghai, India, England, Germany and France.

You will not see these charts anywhere else on the Internet!

And much more...

It is NEVER too late in the year to have this monthly information!

Friday, May 10, 2013

The Jupiter squares ... how to make money

Randall Ashbourne, an associate of Astrological Investing, posts a weekly market report on his web site, theidiotandthemoon.com The following is this weekend's Eye of RA report: Week beginning May 13, 2013

Jupiter Squares - Cancer, Capricorn, Aries and Libra This weekend I'm going to depart from the normal format to discuss Jupiter's travels through the zodiac ... and how that causes bumps and slumps in groups of stocks.

In tech-speak, we call it "sector rotation". We've all seen it in action; investors seem to fall in love with stocks in particular groupings and they fly into the sky like Icacrus ... before their popularity fades and they tumble back down to earth.

Well, we can forecast this by watching Jupiter.

I first learned this from my old friend, the late Kaye Shinker, one of the real pioneers of research into financial astrology at a practical level.

I will explain it as simply as possible. The principle behind Jupiter symbolism is to "expand" whatever it touches. The down-to-earth meaning is that Jupiter will increase either the demand for OR the supply of a particular product as he travels through the zodiac, spending about a year in each sign before moving onto the next one.

Products ruled by Jupiter's current sign position will tend to suffer a glut. VERY bad for stock prices in that area. Products covered by the signs Jupiter is squaring will tend to be in short supply AND high demand. Very GOOD for stock prices.

We'll see how this works in action by looking at some charts.

Now what Kaye discovered is that The Jupiter Effect takes place while the FatBoy travels from the middle-range of one sign to the middle-range of the next.

Jupiter is now at 19 degrees of Gemini heading onto Cancer - and that means we are now starting the early stages of what should turn out to be a massive sector rotation over the coming year.

To be frank, Jupiter in a particular sign does not necessarily produce a glut. It is one of the reasons I am so constantly nagging you that astrological expectations do NOT over-ride technical conditions.

But, let me show you. Jupiter in Gemini should have had a dramatic impact on: telecommunications, media, travel, broadcasting. I am using Incredible Charts monthly data for all the charts in this weekend's edition - and we begin with the telecoms index of the ASX.

As we can see from the chart, Jupiter in Gemini prompted a very strong rally in telecom share prices over the past year.
click to view larger image
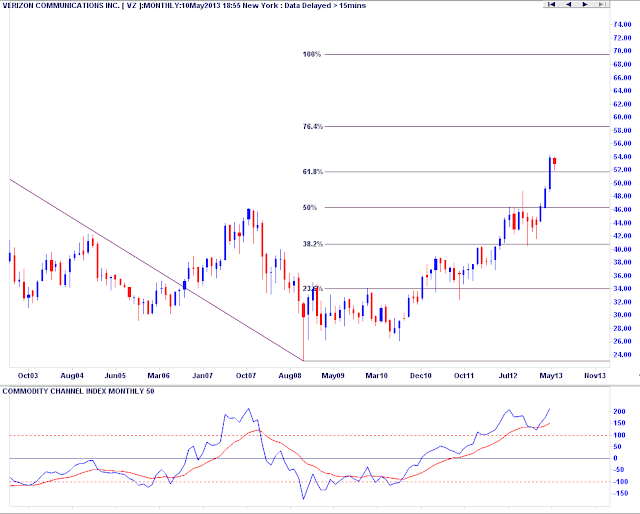
Now, if we had known ahead of time that there would be some sort of big move in communications, we could have fine-tuned our stock buys for the year ahead ... looking at, say, two of the Dow's biggest companies, Verizon and AT&T.

click to view larger image

click to view larger image
Now, these two Dow components did not enjoy quite the same strength as the ASX telecoms index. And it wasn't a particularly good year in terms of phone wars for some electronics companies.

But, what happened to stocks from those sectors that Jupiter was squaring? Well, from Gemini, the squares were to Pisces, which rules shipping, oil, alcohol, drugs and "dreams" and to Virgo, which has rulership of health and hygiene.

Here's Chevron ... which is now making all-time highs!
click to view larger image
And here's what happened with perhaps the ultimate dream/fantasy/celluoid stock, Disney ...

click to view larger image
And here's what happened with healthcare stocks over the past year, seen through the lens of the ASX healthcare index ...
click to view larger image
We get some idea from these charts exactly HOW The Jupiter Effect works. Some of the Gemini-type stocks, like the phone makers, had an awful year, while there was a glut of that Gemini trait "talk", increasing the demand for telecom service providers.

But, some of the biggest winners from the past year were from the "square" areas - Pisces and Virgo. Now, a word of warning! You'll notice that the tech signals in those stocks are starting to roll over.

And that's because from where he is now, in mid-Gemini, Jupiter's travels will cause a major shift in investor thinking.

Cancer, his next sign, and taking into account Capricorn (the sign opposite Cancer), will impact: food, restaurants, farms, hotels, restaurants, building supplies, household appliances and dwellings of all kinds.

The two signs that will be "squared" are Aries and Libra. Aries is military gear, heavy machinery, iron, steel, engineering. Libra is luxury goods, copper, jewels.

So, while it might not seem like it at the moment, it is highly likely that mines and miners and heavy industrials are about to make a big comeback.

That's the astrological expectation! But, do the technical conditions support the theory?

Well, here's the ASX materials index ...

click to view larger image
The index may now be starting that turn. On weekly charts, firms like BHP and Rio Tinto appear to be forming a long-term bottom. The effect may also impact on firms like Caterpillar, which had a very strong rise while Jupiter was actually in Aries.

click to view larger image
As well as strong miners, and heavy machinery makers like Caterpillar, we should also be trawling through our lists of engineering and building companies. The ASX engineering index chart, below, is showing signs of a potential turn northwards
click to view larger image
However, with the Cancer symbolism starting to come into play, we also need to watch for changes in the popularity of building supply companies - like Home Depot, for example.

click to view larger image
 And since Cancer specifically rules things like food we need to be aware there will be either a food glut OR food shortages.

Cancer rules consumer staples. But Libra is coming into "square" and Libra rules consumer discretionary items. Here is the ASX consumer staples index ...

click to view larger image
And below is the ASX consumer discretionary index ...
click to view larger image
Please note the vastly different status of the long-range Canary on these charts ... consumer staples are showing signs of topping-out and consumer discretionary is showing marked positive divergence.

Cancer/Capricorn also rules real estate and office accommodation. Below is the ASX property trust index ...

click to view larger image
And below is the chart of the ASX industrials index ...

click to view larger image
Okay. By now you should have some grasp of what stocks you need to start considering with caution ... and which ones have the potential to rise strongly over the course of the next year.

I stress that I have only scratched the surface here! Individual stocks having strong Jupiter transits can resist the Icarus dive for a while; and "square" stocks suffering strong Saturn aspects to their first trade chart might NOT rise as strongly as some others within the sector rotation.

Again. You MUST use a technical oscillator to help determine the direction of your trades! The purpose of this weekend's edition is to get you to start thinking about the impact of a large-scale shift in investor thinking and emphasis, now starting to get underway and which will gather momentum over the next year.

You need to remember the very first rule of trading successfully - Buy Low, Sell High! It's time to go through your portfolio stocks and look to exit those sectors starting to roll over from highs ... and start identifying those which appear to have spent some time trying to lock in a solid base from which to launch an Icarus flight.

The individual stocks will vary from market to market, but the overall principle of The Jupiter Effect knows no international boundaries.

The Jupiter squares to Aries and Libra should cause price increases for things like iron ore, steel, copper, heavy machinery and military gear, as well as luxury goods and consumer discretionary items.

It MAY cause an increase in demand for real estate and/or office accommodation, rather than a glut of supply. But, exactly which of these actually manifests will depend on local conditions.

If you're using The Idiot system properly across the three timeframes AND using one of the recommended oscillators to look for either positive or negative divergence, you should have no trouble identifying the stocks you need to be selling now ... and those showing the potential to run hard and run fast over the next year.

Safe trading - RA

Randall Ashbourne
Astrological Investing's associate, Randall Ashbourne, author of the eBook, The Idiot and The Moon, and The Idiot and the Moon, Forecast 2013, writes a free weekly column titled, The Eye of Ra on his web site in  which he explains the potential impact of astrological aspects and the current state of technical conditions. Ashbourne's charts are revealing illustrations of exactly what has occurred in the market and the probability of what to expect.
Important reading:  Randall Ashbourne's The Idiot and The Moon, Forecast 2013 , Jupiter's cycle and its effects on Wall Street and a posting of the weekly Eye of Ra report in this blog, titled A look at the Venus Retrograde effect
(Disclaimer: This article is not advice or a recommendation to trade stocks; it is merely educational material.)
Copyright: Randall Ashbourne - 2011-2013

The Idiot and the Moon, Forecast 2013
  • Major trend change dates for the full year, plus a month-by-month breakdown of high-energy trading dates and critical reversal dates.

  • An index-by-index analysis of Moon Trading across major American, European, Asian and Australian stock indices-

  • Identifies the major indices where following the phases of the Moon can dramatically cut profits, or even result in large losses.

  • Old Gods & Gold ... a Eureka! discovery about exactly what drives gold prices during rallies and corrections and charts showing highly-reliable target levels to both the upside and downside.

These price charts are individually-tailored to each index and cover Wall Street, Australia, Canada, Hong Kong, Singapore, Shanghai, India, England, Germany and France.

You will not see these charts anywhere else on the Internet!

And much more...

It is NEVER too late in the year to have this monthly information!


Saturday, October 20, 2012

A heightened sense of danger

Randall Ashbourne, an associate of Astrological Investing, posts a weekly market report on his web site, theidiotandthemoon.com The following is this weekend's Eye of RA report: Week beginning October 22, 2012

While key DNA markers normally obvious at The Top are still missing in some Western stock indices, I'm getting the sense those markets have suddenly become dangerous.

For the past 6 weeks, the broad-based Wall Street index, the SP500, has been stuck below the 1468 level marked as a key barrier on my long-range Old Gods chart.

We've remained open to the possibility of a breakout to new highs at 1522, or even a blow-off to around the 1560 level.

And the reason we've constantly looked at that possibility is the lack of a negative divergence signal from the long-range Canary on Pollyanna's monthly charts.

A few editions ago, I pointed out that key divergence signal had started to become very obvious in the Nasdaq 100, the NDX. It may now also be starting to show in the Dow Jones Industrials.

In both of those indices, the heavy-lifting over the past couple of years has been carried on the shoulders of very few stocks ... like Caterpillar and Apple.

We will take a close look this weekend at the alarm bells going off in the NDX and the general state of some other major indices.

Normally, I refuse to be jerked around by one day's movement in any index. But, I'm getting a sense that something fundamental has changed following Friday's performance on Wall Street.

It's true the drop happened with the Moon in Sagittarius and I said last weekend: "Mars is now in Sagittarius and it'll be joined by the Moon later in the week. Sagittarius has a tendency to exaggerate either the optimism ... or the fear. And wide-range days are the norm when the Moon is in Sadge."

So, even though we did get a wide-range fear day down, I still can't shake the sense there has been a change at a deeper level. The week began for Miss Pollyanna pretty much in accordance with my expectations. I outlined two important scenarios for Miss Polly on Monday, or Tuesday, which would prompt a price bounceback.

I said: "And the key to direction will be how price performs on both Monday and Tuesday. On the chart to the right, note the intersection of the falling red Mars line with the thick yellow Uranus line.

It's at 1434. Pollyanna must close decisively above this level on Monday to re-enter rally mode. She gets a second chance at an astro energy boost on Tuesday, if she fails the 1434 Monday test.

In the chart above, the Venus square Jupiter price crossing point (rising green intersection with horizontal blue) is 1426.

So there are two things to watch for ... a Monday close above 1434, or a Tuesday low at 1426, from which price bounces
."

click for larger image

We can see what happened in the chart above - and there was no need to wait for Tuesday.

Because, on Monday, Miss Polly did make a decisive close above the 1434 level and re-entered rally mode for most of the week.

But with the Moon in a Sagittarian-exaggerated fear mode, Friday's freefall wiped out almost all of the gains.

Now, maybe it's just a one-off, one-day comeback for Chicken Little.

But, what if it's not?

Firstly, let's remind ourselves of where the Pollyanna index is in terms of its long-range planetary price markers.

click for larger image

There is nothing out of the ordinary in the chart above. Well, apart from the fact the support and resistance lines happen to be determined by the position of a few rocks and giant gas balls Out There.

But, from a technical viewpoint, it still all looks hunky dory. Here we are two-thirds of the way through October and price is still largely within the spike part of September's range.

But, if you look at it on a weekly, it has been 6 weeks below the peak of that spike. That suggests it's either accumulation ... or distribution. In other words, the Big Boys have been slowly stocking up for another rally ... or they've been unloading hand-over-fist to anyone who believed Goldman's "buy, buy, buy" memo.

In the meantime, the NDX has been screaming "danger, danger, danger".

click for larger image
We've discussed the importance of 50% Fibonacci Retracement levels in the past and noted the danger it posed on the NDX. We now have quite severe negative divergence between the long-range Canary peak in March and the much lower peak it posted last month when price briefly broke above the 50% FiboRx level.

But the divergence is more dangerous when we look at the peak the Canary made in 2007 and its performance since the 2009 bottom.

As y'know, in terms of astrological predictions, I expected markets to top out in March and go into freefall until at least October. So, these days I don't go out much because that much egg on your face isn't a good look in public.

In spite of that, the apparent failure of the long-range Jupiter-in-Taurus top is beginning to look more like a regional variation on the theme, rather than a broken signal.

click for larger image

Here's another look at the NDX monthly, with the dark green bars showing the periods of Jupiter in the sign of Taurus. On the left of the chart, we can see the Nasdaq's blow-off, all-time high. As Jupiter entered Taurus, the market launched into the heavens.

We then got a secondary peak with Jupiter in early Gemini ... 3 monthly bars past the last green Jupiter bar.

And now ...

Yes, it's starting to look disturbingly familiar ... a marginal new peak 3 bars past the last of the Taurean Jupiter bars.

And London's FTSE index lends support to the NDX signals. There, the post-June rally has still not taken out the Taurean Jupiter high of March, nor the 2011 rally peaks.
click for larger image

So, we seem to have arrived at an interesting place ... and the question is whether the American Presidential cycle, whose 4Q performance I touched on last weekend, has actually displaced the Jupiter-in-Taurus signature, or has merely temporarily delayed its onset. It's a vitally important question because if it's the latter scenario, we may already have seen The Top. There's no surefire confirmation yet; Bernanke and Draghi may yet drop more make-believe moneybags into the path of the tsunami. So, here's an update of the Weekly Planets charts for various indices to help guide your decisions.  

FTSE:
click for larger image
DAX:
click for larger image
ASX 200
click for larger image

India's Nifty
click for larger image

Singapore:

click for larger image
Safe trading - RA

Randall Ashbourne
Astrological Investing's associate, Randall Ashbourne, author of the eBook, The Idiot and The Moon, writes a free weekly column titled, The Eye of Ra on his web site in  which he explains the potential impact of astrological aspects and the current state of technical conditions. Ashbourne's charts are revealing illustrations of exactly what has occurred in the market and the probability of what to expect.
Important reading:  Randall Ashbourne's article, Jupiter's cycle and its effects on Wall Street and a posting of the weekly Eye of Ra report in this blog, titled A look at the Venus Retrograde effect
(Disclaimer: This article is not advice or a recommendation to trade stocks; it is merely educational material.)
Copyright: Randall Ashbourne - 2011-2012