Sunday, July 27, 2014

The Dow drop ... a major top may be in

Randall Ashbourne, an associate of Astrological Investing, posts a weekly market report on his web site, theidiotandthemoon.com  The following is this weekend's Eye of RA report: Week beginning July 28,  2014 
Several major stock indices in North America and Asia hit new highs last week.

But it wasn't universal, especially in Europe, and there is a danger that the grand daddy of stock indices, the Dow Jones Industrials, began a significant, intermediate downtrend from its all-time closing high on July 16, right on the July 14-16 major Bradley turn date I discussed in the July 7 edition.

It is possible the Pollyanna index, the SP500, peaked on Thursday with the Sun's conjunction to Jupiter in the early degrees of Leo.

There could be an attempt at new highs on Monday when Venus opposes Pluto. Monday will be one of two major action days in the coming week.

The second will come on Friday when Venus trines Saturn and squares Uranus and Mars makes a square aspect with Jupiter.

And, of course, we're now moving past the statistical bouyancy of the New Moon.

This weekend's report will be relatively brief because there's really only one stock chart that's important ... the DJI itself. On Friday, it closed decisively below the rising trendline which has supported the entire rally after the sudden January drop.

For the past few weeks, the rally has climbed the trendline while Big Bird, the 50CCI, went in the other direction, a fairly clear and obvious example of building negative divergence warning of danger.


Pollyanna is still trading within the 1950s to 2003 range I discussed last weekend, but if the Dow is breaking down, the rest of Wall Street will be quick to follow.

And so will everybody else, including the Canadians. The German DAX looks as if it peaked a few weeks ago at the 10,000 level I'd warned was likely to prove a major barrier.

Toronto's strong run has taken it well inside the "zone" I indicated could turn out to be "it" for this Bull run. That zone runs from the early to high 15,000s. It's a Pluto-Node price zone, a higher level of a similar zone which put a stop to the last big Bear drop.


The ASX 200 finally broke through the $5533 Saturn barrier on its weekly planets chart and finished the past week above the $5565 Saturn-Uranus price lines. It's a breakout, giving the index its highest weekly Close since the bottom of the last Bear.

This week and next should tell us whether it's a "false break" or the real thing. If it's a fake-out, there'll be a fast drop immediately ahead. If it's real, the negative period between New Moon and Full Moon should not cause major damage. You can check the major price levels on last weekend's chart in the Archives.

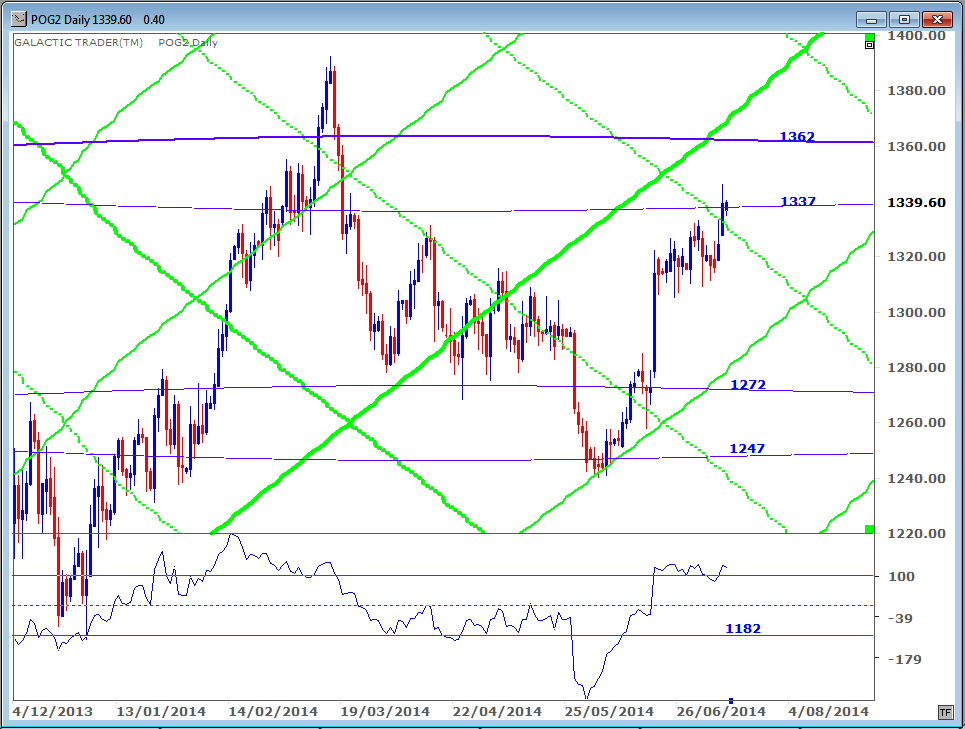
Now, if stocks are going down, gold should head north again. Again, check last weekend's edition for the overall picture if you missed it. There are two fairly clear signs that the gold Bear went back into hibernation with the double-bottom during 2013.

There was another attempt to drive gold lower last week, but it seems to have run out of steam with a false break of a rising Sun line.


If the optimistic scenario for gold is now in play, the take-off from here should be fast and it should blow past previous highs with very little hesitation until it hits the mid 1400s.

It's too early to say whether it's now certain we're entering correction mode for stock indices, or how deep the correction will be. But the Dow has fired a warning shot and the DAX looks as if it's in dive mode, so there is "clear and present danger".

Safe trading - RA

Randall Ashbourne (Disclaimer: This article is not advice or a recommendation to trade stocks; it is merely educational material.)
Copyright: Randall Ashbourne - 2011-2014


Astrological Investing's associate, Randall Ashbourne, author of the eBook, The Idiot and The Moon, and The Idiot and the Moon, Forecast 2014, writes a free weekly column titled, The Eye of Ra on his web site in  which he explains the potential impact of astrological aspects and the current state of technical conditions. Ashbourne's charts are revealing illustrations of exactly what has occurred in the market and the probability of what to expect.


Important reading:  Randall Ashbourne's The Idiot and The Moon, Forecast 2014  


  Purchase Forecast 2014 and receive a special report on GOLD  

Sunday, July 20, 2014

Storm warnings in space

Randall Ashbourne, an associate of Astrological Investing, posts a weekly market report on his web site, theidiotandthemoon.com  The following is this weekend's Eye of RA report: Week beginning July 21,  2014 
The astrological weather patterns are about to make a dramatic change.

We have planets changing signs, changing directions, and making a series of intense, high-energy aspects with each other.

And since a lot of that energy is unleashed over the next week or so, it could be enough to generate a super storm.

Jupiter has now moved into Leo and is about to be joined by the Sun; Venus has moved into Cancer; Mercury is about to oppose Pluto and square Uranus; Saturn is changing to Direct motion while Uranus goes into Retrograde mode.

And the killer change is Mars finishing an unusually long journey through the diplomatic sign of Libra, shifting into Scorpio and heading for a conjunction with Saturn ... when the "drive" energy smashes into a brick wall.

Mars is the traditional ruler of Scorpio. Mars in his primary sign, Aries, is an all-action hero; more Ego than IQ. The Scorpio version is much, much deadlier ... a deep-thinking, deep-scheming, vengeful, poisonous piece of work who fights to the death.

I've discussed with you many times before how Pollyanna, the SP500, rises and falls within Martian channels between long-range Node price levels.

Other indices tend to do the same, though Uranus, Neptune or Pluto tend to be more reliable as horizontal price stoppers.

Anyway, let's have a look at where Polly is within her long-range Mars channels. In the chart below, I'm showing only the rising channels. We can see that the last Bear bottom was recorded with a small break of what I've labelled as the primary channel bottom.

Price rebounded from there to the next higher primary Mars line, which I've labelled as the channel top. We've had only one major breach outside of that primary channel ... the countertrend down marked with a yellow oval.


Okay, now let's move in for a close-up. The horizontal orange lines marked with 2003 and 1955 are primary Node prices. As I said, the SP500 tends to move in Martian channels between Node price levels.

So the $1955 to $2003 range is a major, long-range danger zone. The declining, dotted red lines are the Martian downtrend channels. In brief, a weekly close below the $1950s could well signal the start of a major correction in this index ... possibly even the start of a new Bear trend.


The ASX 200 has stalled yet again at the $5533 Saturn barrier on its Weekly Planets chart, after a failed attempt to breakout higher, falling a tad short of hitting the Uranus price line at $5565. We've had only a single weekly Close above this line since Auntie started playing with it 22 weeks ago. Breakout or breakdown, you old bat!


Now let's have a quick look at gold. At 2am New York time last Monday, the mysterious "somebody" suddenly dumped over a billion dollars worth of gold contracts onto the market. It was followed a few hours later by a multi-billion-dollar dump.

Obviously, it was yet another calculated move with only one aim ... to end the rally in gold prices. Nobody dumps a billion dollars worth of anything onto a thinly-traded 2am market expecting it will cause a price jump. It's designed solely to cause a selling panic when the markets open for real.


One suspects it was a co-ordinated move by big central banks. It's not the first time we've seen these out-of-hours, mega-billion dumps and it probably won't be the last.

However, it was not enough to totally trash the distinct possibility that a long-range bottom in the gold price was cemented with the double-bottom in June and December of 2013.


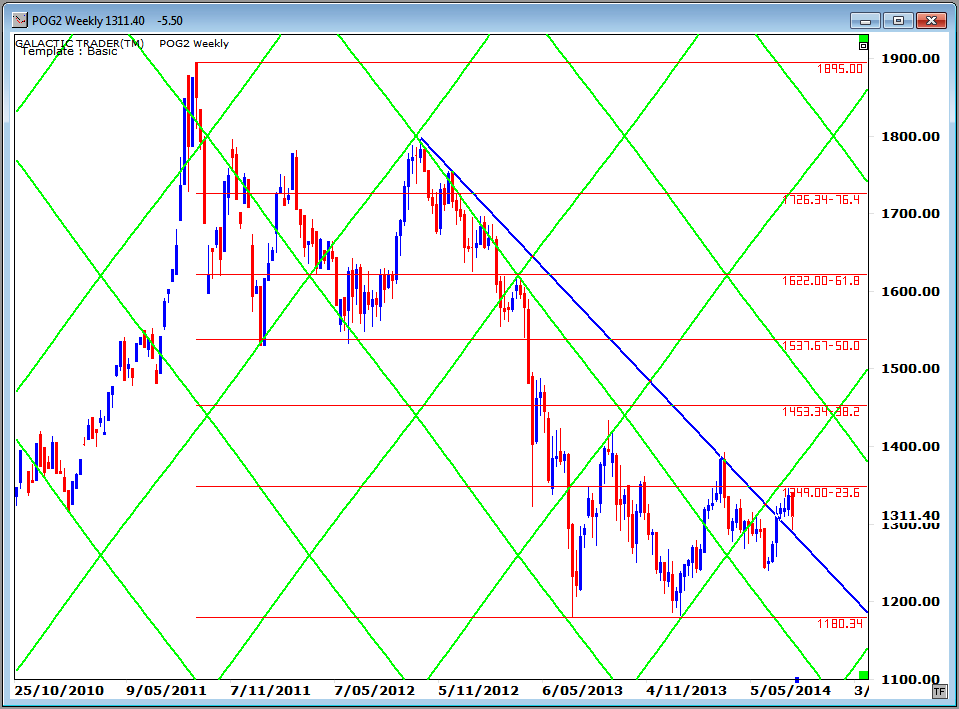
I raised the possibility some time ago that the trend had changed when gold moved out of its Sun downtrend channel. On the above chart, I add a blue technical downtrend line. It put a stop to the last rally, but it, too, has now been broken.

In fact, last week's plunge seems to be a retest of that line ... from the top side. If it holds, it is potentially very, very Bullish. We can't be too optimistic until price can break above the first Fibonacci Retracement barrier around $1350. If it can manage that, it will be doing so with quite extreme positive divergence readings in the Fast and Medium range Canaries on gold's monthly chart, indicating that the gold Bear is back in hibernation and a multi-year rally is underway.

Safe trading - RA

Randall Ashbourne (Disclaimer: This article is not advice or a recommendation to trade stocks; it is merely educational material.)
Copyright: Randall Ashbourne - 2011-2014


Astrological Investing's associate, Randall Ashbourne, author of the eBook, The Idiot and The Moon, and The Idiot and the Moon, Forecast 2014, writes a free weekly column titled, The Eye of Ra on his web site in  which he explains the potential impact of astrological aspects and the current state of technical conditions. Ashbourne's charts are revealing illustrations of exactly what has occurred in the market and the probability of what to expect.


Important reading:  Randall Ashbourne's The Idiot and The Moon, Forecast 2014  


  Purchase Forecast 2014 and receive a special report on GOLD 
 

Sunday, July 13, 2014

Jupiter in Leo ... the affected sectors

Randall Ashbourne, an associate of Astrological Investing, posts a weekly market report on his web site, theidiotandthemoon.com  The following is this weekend's Eye of RA report: Week beginning July 14,  2014 
The head honcho of the Old Gods ... Gee,Zeus, Jupiter, the Fatboy ... goes into the Fire sign, Leo, this week.

He'll be heading to the salon for a new "do" and shopping for a set of the emperor's new clothes.

I probably shouldn't be making fun of the guy who throws thunderbolts around when he's off his Adderall, but have you ever tried swapping jokes with Saturn?! Ugh.

Anyway, I received a note during the week from a reader wanting some further explanation of how Jupiter affects sector rotation ... the regular shift of money away from the popular to the unpopular.

I've touched on this a few times and you might want to take another look at the January 20 Eye of Ra in the Archives.

Basically, though, Jupiter increases either the demand, or the supply. The biggest impacts tend to be in the sectors ruled by the sign Jupiter is entering - Leo; the sign he's opposing - Aquarius; and the signs he's squaring - Taurus and Scorpio.

In January, I urged you all to look at gold and gold mining stocks for a possible long-range shift in the trend. So far, so good ... and that trend shift is giving fairly strong indications of being underway.

The other sectors ruled by Leo are: Amusement parks, gambling and casinos, games and toys, jewelry, recreational vehicles and stock brokers.

Aquarius rules: Aerospace and aircraft, computers and technology, radio and TV broadcasting, electrical equipment, satellites and stock market profits.

Taurus and Scorpio rule: Banks and insurance, debt and taxes, copper, bonds, financial institutions, cattle, candy and corn.

So, the idea is that we look at stocks in those sectors to see which ones appear to have been putting in a solid, long-range bottom OR are showing distinct signs of topping out.

Okay, a reminder that this week brings a Bradley major trend change date.

Let's see where we are ... starting with the Pollyanna index, Wall Street's SP500. She dropped to the Node line at 1952 last week, but bounced back into the Node range now priced from 1955 to a whisker above 2000.

The DJIA is riding a technical channel, unable to climb back inside the upper tier ... and with no new peak in the Big Bird canary since March 2013.

On the northern side of the lakes, Toronto is stalling at a long-range planetary price level. The index made a Bear bottom at a Pluto/Node zone and is now testing a higher level zone priced from the 15,100s to 15,900s.

On the other side of The Pond, London's FTSE continues in its range-bound torpor. It makes Midsommer Murders looks like a Michael Bay action movie.

Germany still can't keep its head above the long-range Pluto barrier in the early 10,000s.


Paris is swooning, though may have reached a bounce level.


And dear old Auntie, the ASX 200, hit 5532 again ... and reached for the smelling salts. Again.


I indicated recently I could see no instance on the gold charts where a rally stalled before hitting an upside Sun or Pluto line. And there still isn't one, since the price of gold made contact with both of them last week.

Safe trading - RA

Randall Ashbourne (Disclaimer: This article is not advice or a recommendation to trade stocks; it is merely educational material.)
Copyright: Randall Ashbourne - 2011-2014


Astrological Investing's associate, Randall Ashbourne, author of the eBook, The Idiot and The Moon, and The Idiot and the Moon, Forecast 2014, writes a free weekly column titled, The Eye of Ra on his web site in  which he explains the potential impact of astrological aspects and the current state of technical conditions. Ashbourne's charts are revealing illustrations of exactly what has occurred in the market and the probability of what to expect.


Important reading:  Randall Ashbourne's The Idiot and The Moon, Forecast 2014


  Purchase Forecast 2014 and receive a special report on GOLD 

Saturday, July 5, 2014

Heading into a major Bradley date

Randall Ashbourne, an associate of Astrological Investing, posts a weekly market report on his web site, theidiotandthemoon.com  The following is this weekend's Eye of RA report: Week beginning July 7,  2014 
The USA is having a Happy Birthday weekend ... with Wall Street the happiest of all.

But the celebration fireworks might spill over into the stock market in the next week or two.

We're now heading into one of the three major Bradley Model turn dates scheduled for this year.

In the next few days, the Sun will square Uranus and trine Saturn. The Moon will spend a couple of days in Sagittarius, which can spark wide-range days full of either fear or unbridled optimism, before heading into the Full Moon next weekend.

That Full Moon will be conjunct Pluto and square to Uranus, in a repetition of the main astrological theme being played out in the skies.

But, it'll also be a major part of what happens in north America over the next year. Astrologers often construct what's called a Solar Return chart on someone's birthday. The themes suggested in that chart tend to last for the next year.

It means the USA will spend the next year trying to deal with the social, economic and geopolitical unrest indicated by the long-range Uranus/Pluto square.

That's because, on its birthday, the USA's Sun was locked into the configuration. And so was the Moon, which was transiting through Libra. In brief, the public "mood" over the next year will want to see some fairness and balance. And that will be at odds with the other three players.

Meanwhile, the SP500 and a few other indices soared to new highs last week. Pollyanna's price has jumped above the first of the two Mars price lines within an important Node zone priced from around 1950 to just above 2000.


And it is rising into those levels as the Bradley Model heads into one of the potentially most important dates of the year. I've cautioned before that it is the dates of the Bradley which are most important ... not the direction of the oscillator, marked with a black line on the chart below.

December 31 marked a high, for example, rather than a low. It was a high which remained untested for two months as the index plunged into a February 5 low. February 3 was a minor blip on the Bradley oscillator.

As I mentioned last weekend, the mid-July Bradley date coincides with Jupiter's sign shift into Leo, which will accelerate a change in the popularity of stock sectors.

In the years when it works, the Bradley Model can be uncannily accurate ... in terms of the dates, not necessarily the implied direction.

And since it was only one day off marking December 30 as a trend change date, which led to a sharp decline, we should all probably keep a close eye on another big shift happening very soon.

The Australian market also responded positively last week, bouncing back for another touch of an upside Weekly Planets barrier.


The next resistance level is around 5570 ... with Neptune at 5625 above that, if the ASX200 can manage a breakout.

Randall AshbourneSafe trading - RA
 
(Disclaimer: This article is not advice or a recommendation to trade stocks; it is merely educational material.)
Copyright: Randall Ashbourne - 2011-2014


Astrological Investing's associate, Randall Ashbourne, author of the eBook, The Idiot and The Moon, and The Idiot and the Moon, Forecast 2014, writes a free weekly column titled, The Eye of Ra on his web site in  which he explains the potential impact of astrological aspects and the current state of technical conditions. Ashbourne's charts are revealing illustrations of exactly what has occurred in the market and the probability of what to expect.

Important reading:  Randall Ashbourne's The Idiot and The Moon, Forecast 2014


  Purchase Forecast 2014 and receive a special report on GOLD 

Sunday, June 29, 2014

Jupiter in Leo ... sector rotation to grow

Randall Ashbourne, an associate of Astrological Investing, posts a weekly market report on his web site, theidiotandthemoon.com  The following is this weekend's Eye of RA report: Week beginning June 30,  2014 

 Volatility is likely to return to stock markets in the coming month as Jupiter stops playing "mother" and orders a set of the emperor's new clothes.

The head honcho of the Old Gods is exalted in Cancer, a placement which also tends to favour the United States.

In mid-July, the FatBoy enters Leo, which might give Barack Obama a break, but tends to be not so good for Wall Street.

The winged-heel guy, Mercury, goes Direct again early this week. The Sun opposes Pluto on America's Independence Day and squares Uranus the following week.

Venus and Mars change signs ... Venus into Cancer and Mars out of polite, diplomatic Libra into fight-to-the-death Scorpio.

In Forecast 2014, I advised traders to look for the potential for a tradeable low around the 12th,13th,14th of June.

It worked ... but only for Wall Street. Other markets are starting to diverge markedly ... even Germany's DAX.

Jupiter's sign shift will have a major impact on the popularity of some stock sectors. It's one of the best indicators of stock rotation, where money starts flowing out of one sector and into others.

For those of you who have Forecast 2014, it could be worth another look at the recommendations for March and a check of the long-range technical status of stocks within the mentioned sectors.

One of the sectors which should benefit over the next year is gold mining - and we'll take a look at some gold charts shortly.

Let's look first, though, at the SP500 ... the Pollyanna index. We've been expecting at least a stall to develop at these price levels ... because the index is running into major, long-range planetary price resistance.

We looked at this chart recently and I indicated that past contact with long-range Node lines tended to provoke a strong reaction downwards.

The Node lines are at 1952 and 2005, with a couple of major Mars lines covering the intervening space. After making a low near 1926 on June 12th, Polly rose to 1968 last Tuesday, hitting the first of those Mars lines.

I indicated recently the DAX, the other gloriously optimistic Western index, was also hitting a major planetary stopper - at 10,016. The DAX managed two separate days above that price level, but has now dropped to 9815.

The ASX 200 is still dithering, unable to decide if it wants to hit the upside or downside of its Weekly Planets range.

Meanwhile, gold has embarked on another breakout attempt, though it, too, is dithering between two sets of planetary prices.

My personal "bias" leans towards more upside for gold ... and not just because of Jupiter moving to Leo and the normal seasonal factors.

For a start, on the weekly version of the Sun/Pluto gold chart, ALL rallies start at either the Sun or Pluto and DO NOT END until after making contact with higher Sun or Pluto price levels.

I'm not sure anyone can predict, with absolute certainty, what is happening with gold; there are too many big money players from central banks to the Chinese Government, with vested interests.

However, there is at least a slim chance that the gold Bear is finished and is in the early stages of a new, long-running Bullish leg. In any case, there is a chart we can use to track that possibility.

IF a new Bull is now underway, there should be nothing more than only temporary stalling at the Fibonacci extensions marked on the chart below. Reaching decisively above $1450 would increase the odds the Bear is dead.

Randall AshbourneSafe trading - RA
 
(Disclaimer: This article is not advice or a recommendation to trade stocks; it is merely educational material.)
Copyright: Randall Ashbourne - 2011-2014


Astrological Investing's associate, Randall Ashbourne, author of the eBook, The Idiot and The Moon, and The Idiot and the Moon, Forecast 2014, writes a free weekly column titled, The Eye of Ra on his web site in  which he explains the potential impact of astrological aspects and the current state of technical conditions. Ashbourne's charts are revealing illustrations of exactly what has occurred in the market and the probability of what to expect.

Important reading:  Randall Ashbourne's The Idiot and The Moon, Forecast 2014


  Purchase Forecast 2014 and receive a special report on GOLD 

Monday, June 23, 2014

Mars opposed Uranus = powder kegs

Randall Ashbourne, an associate of Astrological Investing, posts a weekly market report on his web site, theidiotandthemoon.com  The following is this weekend's Eye of RA report: Week beginning June 23,  2014 

Mars stokes the fires of rebellion again this week, as the Sun moves into protective mode and Venus turns bipolar.

I thought we might spend some time this weekend reviewing the Spooky Stuff, since one wrong move ... by anyone ... this week could easily ignite at least one of the powder kegs.

We're now getting a better sense of just how the current square between Uranus and Pluto is changing the "rules" and nothing will ever be the same again.

In Forecast 2014, I headed the first chapter: 2014 ... and let slip the dogs of war.

I continued: "There is only one real show in the skies this year … a dramatic escalation in the ongoing War of the Gods which has been underway since 2008 and is not due to end until 2015.

Hostilities are likely to hit a new peak in the first four months of 2014.

Astrologically, the primary battle is between the original Old God, Uranus, and Pluto, the ruler of the underworld."


"In ordinary, everyday terms, it manifests as a fight between the proletariat and the plutocrats.

Uranus in Aries symbolises armed rebellion or, at the very least, widespread social unrest which demands radical reform.

Pluto in Capricorn is the deep-willed desire to change nothing; at least nothing which threatens the power and control of the established elites.

Uranus in Aries is irresistible force meeting the immovable object of Pluto in Capricorn.

As the aspect between the two grinds on, the everyday symbolism seems to be spreading.

And it’s likely to reach a new climax in the first few months of 2014, simply because there are few other major astrological transits this year to alleviate the stress."


It's turning out even worse than I thought it might. At a really ordinary level, we can see the symbolism at work in the overthrow of senior House Republican, Eric Cantor, who has been defeated by a challenge from a relatively unknown Tea Party radical reformer.

Cantor, beloved of the banks and big business, is a virtual poster boy for the political power of the established elite. So, too, is Senator John McCain, a robust Republican hawk who had a series of meetings in Kiev stirring up the Ukrainian malcontents determined to overthrow their Russian-linked, elected President.

The result: Russia seized Crimea and the entire, industrialised east of Ukraine is now in armed rebellion. Since they're on "the wrong side", the Washington elites label them "terrorists".

Further south, most of north Africa is in turmoil and the generals are back in control of Egypt, planning to execute quite a lot of the people who had the bad luck to actually get elected not so long ago.

A little further east, the West's attempts to get rid of the Syrian leadership has created a situation where "radical reformers" are on the verge of creating an Islamic caliphate.

Washington is being forced to talk to the Ayatollahs in Iran ... which will anger both the Saudis and the Israelis ... and runs the risk of creating a Baghdad/Teheran coalition which could shut down the entire Persian Gulf in a flash.

Hmmmm. No gas and oil from Russia through the Ukraine pipelines ... no oil tankers getting any further than the Gulf of Oman.

It's little wonder the Chinese last week started moving another four oil rigs into "disputed" areas of the South China Sea, swatting away Vietnamese Coast Guard ships and Filipino protests like annoying gnats.

This weekend it has been revealed the CIA wanted to get into the toy business, manufacturing Osama bin Laden dolls in China whose bearded faces melted away to reveal a red-eyed devil demon. Subtle.

And a report released in London revealed the world's central banks and governments have amassed $29 trillion worth of "real" investments, at least $1 trillion of which is invested directly in stock markets. A trillion dollars, just to give it some sort of meaning we can grasp, is more than the current market value of Citigroup, Bank of America, Wells Fargo and JP Morgan Chase combined.

In other words ... run the printing presses non-stop at the Mint, launder the money through your tame banks, then overpower the financial markets to create the illusion of recovery.

This Wednesday, Mars will oppose Uranus again, lending "energy" to the "rebellious". Venus, the ruler of money and tangible assets, moves out of her comfort zone in materialistic Taurus into Gemini, where every thought bubble is quickly popped and replaced by another that seems more "interesting".

And the Sun goes into Cancer, symbolic of home, hearth and homeland. Cancer is fiercely protective against threats to the "homeland". We can expect to see the big claw come out.

And, of course, that's emphasised by the New Moon.

This is not going to end well ... and it's not going to end soon. It's one thing, I suppose, for the devil doll makers to stuff up relatively small players like Libya with a "no-fly" zone which actually meant bombing any apartment block, house or office building used by Gadaffi supporters ... and then getting all angsty because the rebels you let loose killed your ambassador.

You can tell the Egyptian generals they're naughty and non-democratic ... and then poop your pants and go running back to the generals when the "people" actually exercise democracy and elect the "wrong" leaders.

Gee, Zeus ... what a mess. And the approach of the power elites has been sooo very successful in Libya, Egypt, Syria, Iraq ... and so on ... they now want to repeat the performance against Russia and China.

Anyway, that's the Spooky Stuff background to what's going on. There'll be another spark ignited this week. No real need to update the charts.

Randall Ashbourne
Safe trading - RA
(You can refresh your memory on the current price targets and Support/Resistance levels from last weekend's report)


Astrological Investing's associate, Randall Ashbourne, author of the eBook, The Idiot and The Moon, and The Idiot and the Moon, Forecast 2014, writes a free weekly column titled, The Eye of Ra on his web site in  which he explains the potential impact of astrological aspects and the current state of technical conditions. Ashbourne's charts are revealing illustrations of exactly what has occurred in the market and the probability of what to expect.

Important reading:  Randall Ashbourne's The Idiot and The Moon, Forecast 2014
(Disclaimer: This article is not advice or a recommendation to trade stocks; it is merely educational material.)
Copyright: Randall Ashbourne - 2011-2014


  Purchase Forecast 2014 and receive a special report on GOLD

Sunday, June 15, 2014

Full Moon low ... or something else?

Randall Ashbourne, an associate of Astrological Investing, posts a weekly market report on his web site, theidiotandthemoon.com  The following is this weekend's Eye of RA report: Week beginning June 16,  2014 

It was a week when all the expectations became reality ... the war drums started sounding again, the Moon in Sadge delivered wide-range days, and Polly and the DAX turned down from long-range planetary price lines.

What we don't know yet is whether it was just a Full Moon drop, part of a Mercury Retrograde spurt-and-reverse, or the start of something significant.

If it's the first, this week should see stock prices stablise and start to rise again.

If it's the second, no real turnaround can be expected until late in the week. That's because there is a general tendency, by no means certain, for a trend which begins near the start of the Mercury Rx cycle to reverse course halfway through the phase.

There's not a lot of astrological activity this week, leading into the Solstice. The most notable event Up There is still Mars and its moves. We've had the square to Pluto and the red planet is now heading into opposition again with Uranus (exact midway through the following week).

The war drums will continue beating. They always made the cavalry nervous.

We'll begin this weekend with a quick look at Canada, which went in the opposite direction from most other Western indices. Price of the composite is still trying to reach an important Pluto/Node zone priced from the early 15,000s to just above 16,000.

If we backtrack, we can see the last two Bear bottoms came in at Pluto/Node zones ... the last one of which I've circled. The reason I highlight that zone is because it's made up of "mirror" lines and the orange Node line now priced at 16,012 was a major player in stopping the last Bull peak.

There's a general tendency for these zones to act a little like strong magnets over the longer term. That tendency is why I was fairly sure both the SP500 and Germany's DAX were due to make an exact touch of some overhead planetary prices. The DAX hit 10,033 on Tuesday, a slight overshoot, and then started backing off strongly.

Pollyanna hit her high on Monday, also with a slight overshoot. In both cases, the indices have hit long-range planet lines which should be strong enough to cause a strong countertrend. However, it's difficult to be sure of anything with Mercury Retrograde.

There is also a technical reason for last week's drop. Earlier in the year we spent several weeks discussing potential trades set up by price breaks of the outer BBs and I circled some past instances of normal behaviour when that happens.

India also ran into troubles last week, failing to break past a couple of Saturn barriers on the Nifty's Weekly Planets chart. The price bars are daily, not weekly, and so is the Big Bird oscillator which was clearly disenchanted with the new price highs.

The ASX 200 has been in an intermediate downtrend, though it's really more of a sideways shuffle so far. Weekly Big Bird suggests there is more downside to come.
The problem for the ASX continues to be the August 2007 spike low ... a resistance barrier I've talked about before, known as hitting the last low before the high.

The LLBH price is not far above an important Fibonacci Retracement level. Still, in overall terms, the index is clinging to a weak uptrend, riding external Fibonacci parallels of its main pitchfork. All 3 Birds ... Fast 6, Medium 14 and Long-Range 50 ... are stacked in decline mode.

There hasn't been a monthly close below the current Fibonacci fork extension since the index fell off the main tynes.

As stocks dropped, gold jumped ... getting a boost from holding support at the horizontal Pluto level and rising Sun. The rise brought it up to the next Pluto level.

I'm still wary about just how long this rally will last or how far it can go ... because of the technical damage done during the last big dump on the overnight markets.
.

Randall Ashbourne
Safe trading - RA
Astrological Investing's associate, Randall Ashbourne, author of the eBook, The Idiot and The Moon, and The Idiot and the Moon, Forecast 2014, writes a free weekly column titled, The Eye of Ra on his web site in  which he explains the potential impact of astrological aspects and the current state of technical conditions. Ashbourne's charts are revealing illustrations of exactly what has occurred in the market and the probability of what to expect.
Important reading:  Randall Ashbourne's The Idiot and The Moon, Forecast 2014
(Disclaimer: This article is not advice or a recommendation to trade stocks; it is merely educational material.)
Copyright: Randall Ashbourne - 2011-2014


  Purchase Forecast 2014 and receive a special report on GOLD