Sunday, November 25, 2012

A high-energy astro union of aspects

Randall Ashbourne, an associate of Astrological Investing, posts a weekly market report on his web site, theidiotandthemoon.com The following is this weekend's Eye of RA report: Week beginning November 26, 2012

The first couple of days this week are likely to be volatile as Americans get past Thanksgiving and return to their trading desks.

There are three major astrological aspects on Monday and Tuesday, followed by a lunar eclipse Full Moon as Wall Street opens on Wednesday.

And the little winged-heel guy, Mercury, goes Direct again - having delivered the "perfect" sequence of events during his Rx phase.

We discussed early in the month what is the "normal" behaviour for a Merc Rx period ... the Retrograde date starts a trend, which changes course halfway through, and that by the Direct-again date, prices tend to be back within 1% of where they started the whole phase.

Friday's jump back to the 1410-ish level marked on the SP500's long-range planet price chart ticked all the boxes.

But now things get interesting again. First cab off the rank is a Sun trine to Uranus, quickly followed by a Venus conjunction with Saturn and then a Mars conjunction with Pluto.

Then there's a lunar eclipse Full Moon in Gemini ... and just a normal Moon in Gemini usually brings wide-range days in both directions.

That's a lot of astro energy at play within a very short timeframe.

Let me chat a little about the nature of that energy. Most astrologers work on the assumption that a trine aspect is largely benevolent and interpret the symbolism as an "easy flow" of energy.

The trouble is that an easy flow of energy can be a very bad influence. The real nature of the trine aspect is the sudden removal of all obstacles. Now, this is a damn fine thing if you've been out of work for months, having trouble finding a new job. You suddenly get one ... and it'll frequently be a much better job than the one you lost or left.

However, if you happen to be facing fraud charges ... or anxiously avoiding an audit by the tax office ... the trine can suddenly pull the rug out from under you and you fall hard onto your butt in a deep pile of dung.

And then we have the Venus/Saturn conjunction in Scorpio, the sign which relates to debt, death and taxes. Venus in Scorpio is not the kind of girl you bring home to meet Mum. She's an evil, scheming, manipulative bitch who'll hump your brains out ... and then eat them. While you're still alive.

And that's her good side!

Saturn in Scorpio is even worse. On a mundane level, Saturn is "The Government" and since Scorpio relates to debt and taxes, it represents a timeframe when the business of government will relate strongly to those issues. It means time is running out for governments to continue short-term, quick-fix solutions to problems like sovereign debt and the American "fiscal cliff".

And since Mars conjuncts Pluto in the sign of Capricorn, that's a reiteration of the overall theme. Mars and Pluto rule Scorpio, where Saturn currently travels, and they're meeting in Cappy, which is Saturn's home ground. So, we get this sense that the astro pressure is about to be ramped up dramatically when it comes to money (Venus), government (Saturn) and death, debt and taxes (Mars and Pluto).

When we couple those themes with the Sun trine to Uranus and the volatility implied by a Gemini lunar eclipse Full Moon, it is possible things could get real scary, real fast.

However, let me remind you again of the house rule here ... astrological expectations do not over-ride technical conditions. So, let's look at some charts.

click to view larger image


Firstly, I want to check the historical behaviour of Venus conjunct Saturn aspects - marked with red bars on the chart above. By itself, it's not conclusive and reliable as a turning point ... which is basically the same conclusion we reached with the so-called "Mars/Uranus crash cycle" chart we looked at again last weekend.

But, what happens when we look at the four - Venus conjunct Saturn, Sun trine Uranus, and Mars conjunct Pluto and square Uranus?

click to view larger image

In the chart above, Venus/Saturn is red, Sun/Uranus dark blue; Mars/Uranus pink and Mars/Pluto light blue. Three of these were present in the formation of the two previous Bull peaks. Three of them were nearby during the two previous Bear bottoms ... and near the bottom of last year's August/October plunge.

So, the concern here is not one single aspect ... it's the combination of the punch jammed into a narrow timeframe.

Our next chart is Pollyana's performance during the Mercury Rx phase.

click to view larger image

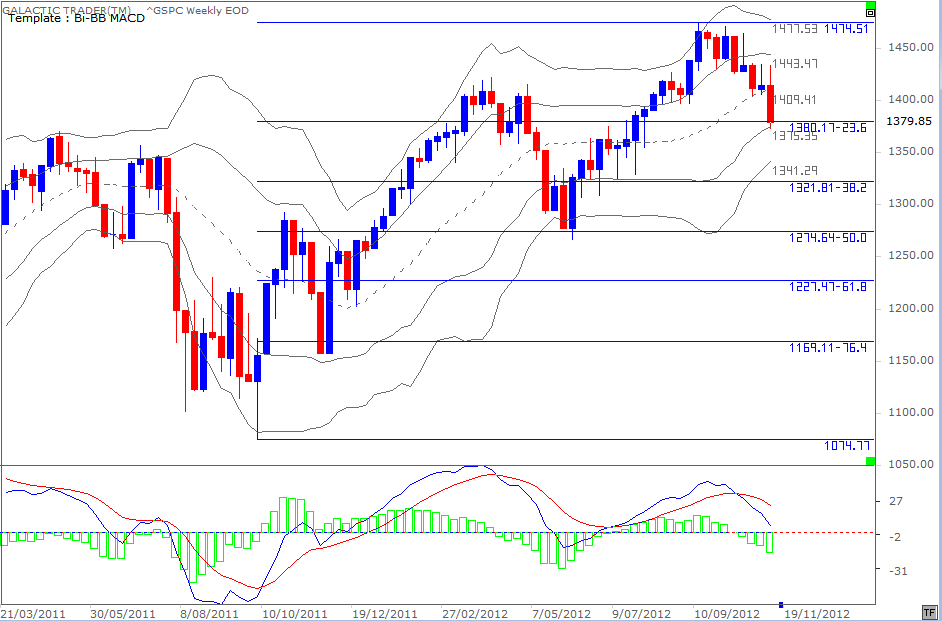
As usual, the official figures from the NYSE won't reflect the silly gap on Friday's half-day, when markets are easily manipulated. The danger is that this is a set-up and not the real start of the annual Santa Claus rally. Yes, I'm still more than mildly concerned by the lack of a positive divergence signal in the oscillators as Miss Pollyanna made her low on the 16th.

The bounceback is even more obvious on the monthly bars in the 500's long-range planetary price chart.
click to view larger image

It's interesting to look at a monthly chart of the FTSE from a technical point of view. While Polly is playing to the planets, the FTSE can't seem to break through the topside of a triangle ... at least not in a sustained way.
click to view larger image

I'll wrap up this weekend's edition with a few Weekly Planets charts and hopefully get back to a wider look at other indices next weekend when it'll be time to look at the likely ranges for December.

Just bear in mind that the Mercury Rx phase did it's "normal" thing virtually perfectly ... but that we have a combination of astro aspects happening over the next few days which have a tendency to be present when markets are marking out important turning points.

NASDAQ 100 Weekly Planets:
click to view larger image

DAX Weekly Planets:


click to view larger image

ASX 200 Weekly Planets:

click to view larger image


Safe trading - RA


Randall Ashbourne
Astrological Investing's associate, Randall Ashbourne, author of the eBook, The Idiot and The Moon, writes a free weekly column titled, The Eye of Ra on his web site in  which he explains the potential impact of astrological aspects and the current state of technical conditions. Ashbourne's charts are revealing illustrations of exactly what has occurred in the market and the probability of what to expect.
Important reading:  Randall Ashbourne's article, Jupiter's cycle and its effects on Wall Street and a posting of the weekly Eye of Ra report in this blog, titled A look at the Venus Retrograde effect
(Disclaimer: This article is not advice or a recommendation to trade stocks; it is merely educational material.)
Copyright: Randall Ashbourne - 2011-2012

Monday, November 19, 2012

December 2012 Astrological Calendar - Transits for NY NY, The NYSE

Astrology calendar showing the day and times of planetary aspects for the NYSE, for the month of December 2012.

Astrology Calendar for the NYSE, December 2012

Click image to view full size calendar.

December 2012 Astrological Calendar - Transits for London, England, The FTSE

Astrological Calendar showing the day and times of planetary aspects for the FTSE, for the month of December, 2012.
Astrological Calendar for planetary aspects for the FTSE, December 2012


Click image to view full size calendar.

December 2012 Astrological Calendar - Transits for Sydney, Australia, The ASX

Astrology calendar showing the day and times of planetary aspects for the ASX, for the month of December 2012
Astrological Calendar for planetary aspects for the ASX, December 2012
Click image to view full size calendar

Saturday, November 17, 2012

Mercury Rx & Mars meets el Weirdo

Randall Ashbourne, an associate of Astrological Investing, posts a weekly market report on his web site, theidiotandthemoon.com The following is this weekend's Eye of RA report: Week beginning November 19, 2012


We have reached the halfway mark of the current Mercury Retrograde period ... and Mars changes signs from Sagittarius to Capricorn this weekend.

Either of these astro events is enough to change the direction of the existing trend.

The big question is for how long, since by the end of the week Mars will be squaring Uranus and conjuncting Pluto.

I have discussed with you in the past the so-called Mars/Uranus crash cycle and its total, complete and utter NON-reliability to actually bring on a crash. Just because certain members of the astrological community like to make dire predictions about Mars/Uranus hard aspects, doesn't mean they know what they're talking about.

We will take a graphical look at the aspects again in a moment or two, as well as what is "normal" halfway though a Merc Rx period. And we will consider a particular technical condition which indicates the bottom of the current correction is not yet complete.

But, let me first deal with the astro symbolism. Mars is energy and drive. He's the all-action guy, not overly blessed in the brain department. Uranus is a weirdo nutbag who delights in giving everyone the irrits by doing the complete opposite of what one would expect conditions dictate.

When Action Guy meets up with Psycho Nutbag in conjunction, opposition or square, "stuff" happens ... just not necessarily the stuff you were counting on.

So let's remind ourselves of the actual historical performance, as opposed to the crash predictions.
click for larger image

In the weekly chart of Miss Pollyanna above, the Mars/Uranus conjunctions are marked in blue, the oppositions in red, and the squares are the green bars. Of the 7 oppositions shown, only 3 show up at peaks, bringing on a crash. The first shows up at the August 2000 peak and the second instance was a countertrend top just before the index made a Bear bottom in 2002. The 3rd instance was in August 2008, just before markets went into the worst of the post-2007 crash.

The blue conjunctions don't seem to signify much at all and nor do the squares, which are sometimes sort-of near tops, sometimes sort-of near bottoms, and sometimes sort-of midway through a trend which just continues in the direction it was going beforehand.

Ergo, the "Mars/Uranus crash cycle" is a cycle the way a rectangle is a wheel. It doesn't bloody work! The Mars/Uranus oppositions would seem to be more dangerous than the conjunctions and squares ... and even they seem to work only half the time.

I'm not dismissing the potential out-of-hand, merely indicating that the actual track record suggests it's not an aspect which reliably brings about a crash.

Now, let's turn our attention to the Mercury Retrograde phase. In the first report for November, I said: "What normally happens with stock markets when Merc goes Rx is that it starts a trend which goes into reverse halfway through the period. That would mean a potential trend change date on the 16th - the day Mars changes signs from Sagittarius to Capricorn and starts making its own aspects to the ongoing Uranus/Pluto square."

It's true I thought the bounceback might have started earlier last week, but the "fiscal cliff" reiterations kept markets in a freefall until Friday.

click for larger image
So, Friday went to a new Low ... and bounced; indicating that, perhaps, we are going to get the "normal" behaviour ... which is that a trend which starts when Mercury goes Retrograde, reverses course halfway through the cycle. In fact, it's fairly normal for markets to finish the Merc Rx period with prices within 1% of the level they were when the phase started.
The chart above marks the last Merc Rx period between the two black verticals and the current one is now halfway through. IF we do get a Thanksgiving week bounceback, and optimism is the mood "norm" for America in this week, it wouldn't be unusual for the index to reconnect with a Mercury planetary price line.

The prices are: 1428 if the rebound recovers within 1% of the start of the period; 1398 and 1391 as "safer" targets ... and 1308 if the plunge continues.

Now, I have a caveat about the potential length of any bounceback ... and it's not really related to the Mars/Uranus/Pluto aspects coming up as we end the coming week.
click for larger image

It's related to a technical condition, not an astrological expectation. Simply, there is no positive divergence in the state of the long-range Canary on Miss Pollyanna's daily chart. First, just an eyeball ... this is a significant correction in terms of time and price.

And because it is, we would normally expect to see an instance of divergence between price and the oscillator ... as we did during previous corrections of this significance. Divergence is explained in The Technical Section of the book and is worth re-reading if you're still trying to come to grips with it.

We can see it quite clearly in the chart above. The lack of positive divergence in the current set-up is a warning that any bounceback has a high chance of failing and that Miss Polly, the SP500, needs to make a lower price low below 1343, while the Canary makes a higher trough.

Also in the November 5 edition, available in the Archives, I published a broad range of index charts in an attempt to show the likely range for the whole month ... and here's how Polly has played with Chicken Little back on stage.
click for larger image

In brief, it's entirely possible we have seen the range for November and the final half of the month will play within that territory.

But, we need to be fully aware that the danger to continuation of the Bull recovery run is significant; the fast MACD signals on Weekly Planets charts for most indices are still in decline - and could drop much further yet.

The Nasdaq 100, NDX, chart is below, followed by similar charts for the FTSE, the DAX and the ASX 200.
click for larger image

click for larger image

click for larger image

click for larger image

You'll note the MACD decline on most of those charts is in its early stages, so I'm basing my expectation of a bounce largely on what is "normal" behaviour during a Merc Rx period ... and on the usual pattern of a Mars sign change at least temporarily changing the trend in play.

And, also, because while there's no positive divergence between price and oscillator on Miss Polly's dailies, it actually is there on my NDX charts and the Nasdaq often acts as a leading index - that is, it changes direction before the DJI or the 500.

And if Wall Street goes that way, we can assume most of the other major indices will do the same. >


Safe trading - RA


Randall Ashbourne
Astrological Investing's associate, Randall Ashbourne, author of the eBook, The Idiot and The Moon, writes a free weekly column titled, The Eye of Ra on his web site in  which he explains the potential impact of astrological aspects and the current state of technical conditions. Ashbourne's charts are revealing illustrations of exactly what has occurred in the market and the probability of what to expect.
Important reading:  Randall Ashbourne's article, Jupiter's cycle and its effects on Wall Street and a posting of the weekly Eye of Ra report in this blog, titled A look at the Venus Retrograde effect
(Disclaimer: This article is not advice or a recommendation to trade stocks; it is merely educational material.)
Copyright: Randall Ashbourne - 2011-2012

Tuesday, November 13, 2012

The New Moon in Scorpio - Solar Eclipse - November 13, 2012

Astrological Investing New Moon forecasts show general trends and financial outlook for the month. The New Moon in Scorpio, November 13 - Chart from the point of view of Wall Street and the NYSE.
Chart from the point of view of Wall Street and the NYSE.

At last the US election is over! Final counts are still coming in, but the election outcome has been determined; and we, here in the USA, are relieved that it is over. Of the people who voted, 50% are rejoicing, and 48% and not. But we are mostly ALL glad to get back to regular TV without all the campaign ads! We voted and can't wait to move forward.

But wait! Mercury stationed retrograde on the day of the election. As it appears from planet Earth, Mercury is not moving forward - it is moving backward - and will remain retrograde until November 26.

Astrologers remind us that during Mercury Rx we should not make major decisions, should not start anything new, and they tell us that we should do things that begin with "RE" . Well, we did.

We RE-elected President Barack Obama. We Re-elected almost all of the same Congressmen and Senators (give or take a few!) REgardless, the balance of power in the United States Congress is a very close REpeat of what we had. Political pundits are REhashing and REviewing the election outcome trying to figure out this and that - why Obama won or why Romney lost - Whatever!

All my best to the winners, my condolences to the losers, and my hope that we don't end up REmorseful, as that is sometimes (often!) the case when major decisions are made on the day Mercury stations retrograde.

This New Moon in Scorpio is a Total Solar Eclipse.
And a Lunar Eclipse, Full Moon, follows on November 26.

What we really want to know is "How will these two eclipses potentially impact the financial market?" Therefore, this New Moon report will only briefly cover the chart, as we discuss the impact of eclipses.

And because Mercury is retrograde, I'm going to REpeat much of what I said in my newsletter from May, when I discussed Eclipses...

Eclipses happen on either a new Moon or a full Moon 
 A new Moon eclipse is a solar eclipse - a full Moon eclipse is a Lunar eclipse. An eclipse is important astrologically because the energy has a long lasting influence - just how long of an influence varies. Study has gone into exactly how long an eclipse has influence, yet there is actually no definitive answer. Some say energy from a solar eclipse can be felt for as many months that are equal to the minutes/hours the actual eclipse lasts, or the amount of time the shadow of the eclipse can be seen. Some simply say the energy of a solar eclipse can be felt up to 6 months, or until the next solar eclipse; Lunar Eclipses, not quite as long.

In any case, the reason the influence is long lasting is that the degree of the eclipse becomes very sensitive and the energy of the eclipse can dramatically reappear as transiting planets aspect the degree of the eclipse and other planetary positions in the eclipse chart.

Transiting planets can trigger problematic international world affairs and harsh geological events. Events that have potential to impact financial markets.

Malefic energy?
Ancient astrologers stressed the "malefic" quality of eclipses. In reality, the energy is simply increased, intensified action. Therefore, challenging aspects (squares and oppositions) from outer planets, which are difficult to begin with, have added intensity which makes them more problematical. Trines and sextiles - the so-called "easy" aspects can also be problematical, but most of the time the end results are fortunate.

Both the challenging and the easy aspects in an eclipse chart portend transformation and change. In the end, it's really how well things are managed.

In Raphael's Mundane Astrology, he notes that, "The strength of the planet ruling the sign in which the eclipse falls should be considered, and its position in the figure of such eclipse duly noted, for the significations of this planet will principally appear." This eclipse is in Scorpio, and Pluto and Mars (rulers of the eclipse) are found together in the eighth house of New Moon chart. We need to be alert as this could bring volatility in the market due to an unfortunate events which could be a military, accident, fire or crime. (All these things ruled by Mars) More information of the Benghazi incident may be brought forward.

Earthquakes are associated with eclipses
The area over where the shadow of the eclipse passes is especially susceptible to seismic disturbances - The majority of the eclipse takes place over the South Pacific Ocean, and makes no landfall with the exception of northern Australia. Here is a map showing the path of Total Solar Eclipse on November 13/14th   Because it crosses the International Dateline it actually begins on the 14th in NE Australia at dawn.

"The Moon's penumbral shadow produces a partial eclipse visible from a much larger region covering the South Pacific (including Australia and New Zealand), southern South America, and part of Antarctica () As the path progresses eastward it crosses the International Dateline moving back to the 13th as it moves towards sunset to the west of Chile." (http://eclipse.gsfc.nasa.gov/SEmono/TSE2012/TSE2012.html)

Overall increased volatility in the financial market
Near the date of the eclipse, before and after, there is a marked increase in volatility. Eclipses have coincided with market reversals in either direction. With Mercury in the first half of its retrograde period, the chances of extreme volatility increases.

Solar Eclipses have a predicable influence on individual stocks.

Check the first trade or IPO charts you are holding or considering to buy/ sell. Look to see if they have planets within 5 degrees of 21° in fixed signs. (Taurus, Leo, Scorpio and Aquarius) for the Solar Eclipse. And for the Lunar Eclipse, later in the month, look for aspects within 5° of the 6° mutable Lunar eclipse. (Gemini, Virgo, Sagittarius and Pisces)

As for individual stock prices, solar eclipses have both positive and negative effects, depending upon which planet it aspects in the stock's IPO or First Trade chart. (If the chart of incorporation is impacted by the solar eclipse it may or may not influence the price of the stock.)

With Sun, Venus, Mars, Jupiter, Uranus or Neptune you may see a positive affect on the price of the stock - but especially so with Venus and Jupiter, the money planets.

If the chart has Saturn or Pluto within 5° of the eclipse degree - this eclipse could impact the stock very negatively!

Oppositions and squares are important to watch as well, but the conjunction makes the strongest impact. Trines, sextiles and minor aspects are not reliable indicators of whether the price of a stock will move up or down

IMPORTANT!!!! Twenty six of the DJI charts will be impacted by the Solar Eclipse! And, sixteen of these charts are IPO's.

Two of the stocks to watch that will be impacted by the eclipse -

Bank of America (BAC) IPO chart has Uranus at 17° Scorpio in opposition to Venus at 22° Taurus and Mars at 15° Taurus. This financial stock may fare better than others in that sector.

Boeing (BA) Has Jupiter at 17 Scorpio with Mars at 22 Scorpio. This is very promising for the price of stock! (Also, because BA is in the sector that is governed by Jupiter)

If you are interested in obtaining all the DJI charts, click here.  Also, a great resource for researching stock charts is Michael Munkasey's Company Data.

An Astrological Trip Around the New Moon in Scorpio Chart

Note: New Moon periods tend to be a positive time for the markets, often coinciding with temporary highs relative to the direction the market is trending.  There are many of you who have been trading with the phases of the Moon and having much success; and you know by reading Randall's The Idiot & the Moon that there are times when it doesn't always work out that way! (Read Randall Ashbourne's article, The Moods of the Moon - Trading the Mood Swings of the Monthly Lunar Cycle. Purchase his eBook, The Idiot & the Moon )

Mercury in Sagittarius rules this chart set for NY.  Mercury is in the sixth house near the cusp of the seventh, in mutual reception with Jupiter in Gemini in the first house.

This is an optimistic new Moon chart, having Jupiter in the first in mutual reception to Mercury. People in the US are looking forward with great hope that the next four years will provide new jobs, a better economy and prosperity for the working class. The markets may react positively, but investors still are a bit cautious. Markets are vulnerable to Mercury retrograde energy mixed with Eclipse surprises.

Click to read this article in full on the astrologicalinvesting.com web site.  Read the interpretation of the planets in houses, the Moon phases section and get the "Head's Up" - upcoming astrological events list.

Trines,
Marley

Saturday, November 10, 2012

Americans skittish ... others not so much

Randall Ashbourne, an associate of Astrological Investing, posts a weekly market report on his web site, theidiotandthemoon.com The following is this weekend's Eye of RA report: Week beginning November 12, 2012
The big astrological event for the coming week is the Solar Eclipse New Moon in Scorpio.

Two editions ago I published an historical chart showing the impact of Solar Eclipses on the SP500 - and caution again that there is no truly reliable prediction that can be made about the effect on markets.

The path of this one takes in Indonesia, northern Australia and New Zealand and into the mid-Pacific.

Since it's in Scorpio, ruled by Mars and Pluto, and since it's directly above the so-called Ring of Fire, there's probably an increased likelihood of seismic disturbances in the region.

However, let's talk about Wall Street's seismic disturbances. The Mercury Rx station had little impact on the vote - except in Florida, which used not be able to print proper ballot papers, but got over that problem and now just needs to learn how to count them.

We'll spend some time this weekend pawing over the entrails of the SP500 to see whether, and what sort of, bounce might be expected.

First, let's remind ourselves of where we are in terms of the big picture.

click to view larger image

Above we have the long-range monthly. The Jupiter-in-Taurus bars, which have a very close historical relationship with Bull market tops, are in dark green. And we discussed a couple of times recently what might be happening with the NDX in this regard.

But, what we really want to do here is just get an "eyeball" view of the current state of affairs with the broad-based SP500. The index briefly poked its head back into the irrational exuberance zone of the two previous Bull peaks ... and closed out last week, testing the first line of defence at the lower horizontal line of technical Support.

Nothing out of the ordinary so far ... though we have been chatting recently about the growing danger signs within the American indices.

Two editions ago, I published a couple of versions of the same chart, indicating where the Pollyanna index was likely to head if prices continued the correction.

click to view larger image

This was the first of them, showing Pollyanna behaving relatively routinely within a rising pitchfork since the August/October plunge a year ago.

And the next chart is simply a close-up ...

click to view larger image

The last time we looked at these charts, I made the point the index was trying to hold the upper red line of a Fibonacci-calculated zone within the bottom half of the fork and that if it failed to hold, the Bulls would mount a fight at the 1390 and/or 1370s levels.

And that's where we're at. So, the index is at an important horizontal level on the long-range monthly AND at an important level within the internal Fibonacci bands of a daily chart.

We'll look next at a couple of weekly charts. Below is a Bi-BB. Price found support on Friday at the mid-level of the lower band, which also happens to be close to a routine Fibonacci Rx level of the whole rally over the past year.
click to view larger image

And golly-gee-whizz, ditto for Polly's Weekly Planets chart.

click to view larger image

Okay. So, we know that there is a statistical tendency for New Moons to coincide with a near-term High. However, we also know from the Solar Eclipse chart from the October 29 edition, that eclipses can distort the statistical tendency ... and this may be one of those times.

I mentioned last weekend during a brief discussion about Mercury Retrograde that ... "What normally happens with stock markets when Merc goes Rx is that it starts a trend which goes into reverse halfway through the period. That would mean a potential trend change date on the 16th ..."

So, because Pollyanna is hitting Support levels - technical, Fibonacci, or planetary - on monthly, weekly and daily charts, we need to be aware of the potential for a bounce to develop in the coming week.

And, perhaps especially, because other major indices didn't go into the same sort of overly dramatic swoon as Miss Pollyanna.

Below is the Footsie Weekly Planets chart. The index traded within largely the same range as it has been for many weeks.
click to view larger image

Ditto for Germany's DAX index, below. In both indices, there was a break of planetary support which was recovered by the end of the week. The only note of caution - apart from the continued deterioration of the MACD signal - is the appearance of Bearish engulfing bars.
click to view larger image

Singapore is below, still deciding whether to bounce from, or breakdown below, a vital Neptune line at 2995.
click to view larger image

And the Hang Seng in Hong Kong dived into a Saturn level on its Weekly Planets chart (below).
click to view larger image

The ASX 200 basically didn't go anywhere and continues to hold Uranus support at 4450ish.

click to view larger image

In signing off last weekend, I said: "Regardless of what happens on Tuesday, have at least some faith in the Old Gods. In Bulls and Bears, through Goldmanesque manipulation and BenDraghi interventions, the pulse of the markets beats to coloured spaghetti trails marked by the passage of planets."

Eh. And so they did. Again. As usual. Of course, we're all educated adults and we don't actually believe in astrology and Old Gods. Do we?!?

Enough of the waffle for this week. Don't be surprised by an imminent bounceback. Virtually no major markets other than Wall Street rose so far back into irrational exuberance territory before the correction started; virtually no major markets have swooned as much as The Vacuous Troll, Pollyanna.

And, regardless of which way things go, the charts published last weekend and this one show the probable range targets - upside and down.

Oh! Thank you to Praveen and Andy, who wrote with suggestions about where to find data for those indices Yahoo has dropped from its historical price data. I'm not terribly good at formatting spreadsheets and need to fiddle with date formats and a few other things.

However, hopefully I'll be able to bring the Indian and Canadian market charts up-to-date when I get it all sorted out.

Safe trading - RA

Randall Ashbourne
Astrological Investing's associate, Randall Ashbourne, author of the eBook, The Idiot and The Moon, writes a free weekly column titled, The Eye of Ra on his web site in  which he explains the potential impact of astrological aspects and the current state of technical conditions. Ashbourne's charts are revealing illustrations of exactly what has occurred in the market and the probability of what to expect.
Important reading:  Randall Ashbourne's article, Jupiter's cycle and its effects on Wall Street and a posting of the weekly Eye of Ra report in this blog, titled A look at the Venus Retrograde effect
(Disclaimer: This article is not advice or a recommendation to trade stocks; it is merely educational material.)
Copyright: Randall Ashbourne - 2011-2012

Saturday, November 3, 2012

November price ranges for indices

Randall Ashbourne, an associate of Astrological Investing, posts a weekly market report on his web site, theidiotandthemoon.com The following is this weekend's Eye of RA report: Week beginning November 5, 2012

The USA goes into election mode this week with neither the incumbent nor the challenger clearly ahead.

And with the Old Gods' messenger, Mercury, going into Retrograde mode on election day, there's every chance the result will be murky.

Already, lawyers for both camps are ready to roll in key swing States like Ohio, Florida and Virginia.

What normally happens with stock markets when Merc goes Rx is that it starts a trend which goes into reverse halfway through the period. That would mean a potential trend change date on the 16th - the day Mars changes signs from Sagittarius to Capricorn and starts making its own aspects to the ongoing Uranus/Pluto square.

We saw it in action last week when Venus made Uranus/Pluto aspects and Superstorm Sandy wreaked havoc, forcing a 2-day closure of the NYSE.

It would take a much better astrologer than I to accurately predict what to expect in the coming week ... and I'm not going to try.

Instead, we will go through the exercise we did early last month and concentrate on defining the probable range for the month ahead.

It will be a critical month because the Dow is flirting with a trendline vital to continuation of the Bull run. Failure to hold it would most likely be confirmation that the next Bear has emerged.

This is normally the time of year, with the Sun moving towards the optimistic sign of Sagittarius, that kicks off the Santa Claus rally.

But, the entrails aren't looking so good. As we can see on the chart above, the DJI has declined into the trendline drawn from last year's August/October plunge to the June correction low ... and neither the fast MACD nor the long-range Canary is looking happy.

And the more broadly-based SP500 continues to play at the pointy end of what we've discussed a few times in the past few months as being a likely Ending Diagonal pattern ... which is extremely Bearish once the downside of the wedge is penetrated decisively.

There is, as yet, no clear and obvious negative divergence from Pollyanna's long-range Canary (the blue line). We have been watching and waiting for a lower peak to occur in that oscillator simultaneous with a higher price high to give the sort of warning it gave at the 2007 Bull top.

Nevertheless, the warning signs are there. Both the short-term (green) and intermediate-range Canaries (red line) have already diverged negatively. Just as they did when Wall Street was topping at the end of the previous Bull run. The danger continues to build.

Now, let's take a look at planetary charts for various indices to gauge the probable price ranges for November.

October turned out to be the first negative month for Pollyanna since May. But, price was largely contained within the range defined by two Neptune lines on her long-range planetary chart. We've discussed this chart fairly frequently and the implications are obvious.

If there's going to be a Santa Claus rally into the end of the year, the probable targets are 1522 or 1562. And if the index breaks down, rather than breaks out, all the major downside stalling points are listed.

For the moment, Polly needs to hold the 1410 level ... and the Nasdaq 100 needs to continue holding the Uranus line around 2650.

The NDX pretty much did last week what it did the week before ... minor breaks of the Saturn/Uranus planetary price lines, but finishing the week with price contained within the barriers.

If there's a Nasdaq breakdown this month, 2443 seems the most likely target. If it's breakout, it'll be 2940 and above by the end of the year.

Germany's DAX index is above, having spent the past 2 months in a trading range, with the downside routinely stopped by the Old God of boundaries, Saturn. From a technical viewpoint, the odds probably favour a Bullish flag pattern - with one rally left.
Last weekend, we discussed once again the potential rally signal in the FTSE as it declined into the influence of a rising Sun line.

 A bit wobbly on Wednesday, but it worked for the FTSE, even if not as a pointer to what might happen on Wall Street.

 It'll open next week with downward pressure from a falling Sun line.

And which of the two influences it decides to follow is likely to be impacted by what happens with the elections in America.

The FTSE Weekly Planets chart is below, showing the price targets likely to be hit this month, regardless of the direction of the break. A break which is highly likely given the number of weeks the FTSE has been trapped in a narrow range.

Our next chart, below, is for India's Nifty 50. It is actually missing a couple of weekly bars because Yahoo Finance has now dropped historical price coverage for that index, as well as for the Canadian indices and the DJI. I'd like to continue coverage of the Indian markets, so if any readers from Mumbai know where I can find replacement data, please drop me a line under the "contact" button in the main navigation menu.

For the moment, the Nifty is still trading the 5690s range highlighted the last time I published this chart in early October.

The Singapore exchange is above. Technically, it is trying to base on top of the previous consolidation, which tracked that grey Neptune line currently priced just a tad below 3000. You can see it also has a tendency to use the Saturn lines as a base and I've used those lines to try to define the probable November range. The upside Resistance is in the mid 3200s and the "normal" downside would be around 2953.

The Hang Seng has been on a roll, taking its cues from a potential bottoming pattern in the Shanghai composite. You can probably calculate the price of the Saturn lines by just using a crosshair to previous price bars, but I've marked the likely upper limit at 23,590.

I think I'm also missing data now for the Shanghai Composite index, charted below, so the full range of the last couple of price bars is probably inaccurate.

However, the data I have still suggests China is trying to bottom. The oscillator is trying to creep back into neutral territory - and with some Bullish divergence; not just in the short-term either. The oscillator bottomed out at a higher trough during the recent price lows, compared with its performance in September, 2011 ... when price was actually several hundred points higher.

And finally, Auntie - the ASX 200.

So, just to recap briefly. The danger continues to grow in the major American indices and the astrological weather ahead continues to mirror what the actual weather was like on the US East Coast last week. In fact, it could get a lot worse later in November when Mars sets off the Uranus/Pluto discord again.

Regardless of what happens on Tuesday, have at least some faith in the Old Gods. In Bulls and Bears, through Goldmanesque manipulation and BenDraghi interventions, the pulse of the markets beats to coloured spaghetti trails marked by the passage of planets.

All we really need to know is where the milestone markers are. And now you have them!

Safe trading - RA

Randall Ashbourne
Astrological Investing's associate, Randall Ashbourne, author of the eBook, The Idiot and The Moon, writes a free weekly column titled, The Eye of Ra on his web site in  which he explains the potential impact of astrological aspects and the current state of technical conditions. Ashbourne's charts are revealing illustrations of exactly what has occurred in the market and the probability of what to expect.
Important reading:  Randall Ashbourne's article, Jupiter's cycle and its effects on Wall Street and a posting of the weekly Eye of Ra report in this blog, titled A look at the Venus Retrograde effect
(Disclaimer: This article is not advice or a recommendation to trade stocks; it is merely educational material.)
Copyright: Randall Ashbourne - 2011-2012