Showing posts with label T-Square. Show all posts

Sunday, March 30, 2014

An Astrological Trip Around the New Moon in Aries

Astrological Investing New Moon forecasts show general trends and financial outlook for the month. The New Moon in Aries, 2014 - Chart from the point of view of Wall Street and the NYSE. 
“Those who profess to favor freedom and yet depreciate agitation, are people who want crops without ploughing the ground; they want rain without thunder and lightning; they want the ocean without the roar of its many waters. The struggle may be a moral one, or it may be a physical one, or it may be both. But it must be a struggle. Power concedes nothing without a demand. It never did and it never will.”
- Frederick Douglass

The New Moon in Aries is involved in a dynamic configuration - a T-Square - with Uranus, Jupiter and Pluto. The nature of these planets and their signs are pitted against each other to force an outcome. (Read The Spring Equinox, March 20, 2014)

The quote above reminds us, "...power concedes nothing without demand." This T- Square is extremely demanding, agitated energy.   With the Aries New Moon, Pluto, Uranus and Jupiter, the dynamic of this agitated aspect says "something's GOT to give!" So what does that mean for the NYSE?  April will be unpredictable and volatile.

Times like these are when it is extremely important to pay attention to the charts that are posted weekly on the blog and at Randall Ashbourne's web site theidiotandthemoon.com in his Eye of RA report.

 An Astrological Trip Around the New Moon in Aries Chart
 The Sun in Aries rules the Leo rising chart of the New Moon. The New Moon (Sun/ Moon) is in the ninth house conjunct Uranus - The focus this month is on global affairs, and international markets. Foreign affairs, foreign trade, overseas traffic by sea and air are matters of the ninth house.

With the New Moon conjunct Uranus, square Jupiter, and square Pluto, events may be surprising, confusing, unrestrained, and reactionary. This energy creates conditions that cause great volatility in the markets. 

Uranus is as unpredictable as lightning.  In one of my previous articles, I wrote of what Charles E. O. Carter, the great Twentieth Century British Astrologer, had to say in the book, Mundane Astrology, The Astrology of Nations and States, "Uranus represents the administration of power, the administrative officers of the State and all their functions."  Additionally Carter states, "Uranus rules power on the physical plane - dynamos and all power generators."  With such electric energy, Uranus is as unpredictable as lightning. When afflicted by difficult aspects Uranus is rebellious and anarchic.  
Jupiter's
energy is expansive and excessive - typically, Jupiter is favorable, but it can make mountains out of molehills, and when challenged will over-react.

Pluto can be very destructive, using a scorched earth policy whenever it faces noncompliance.

The houses that come into play with the T-square involving the new Moon are: ninth, eleventh, and the fifth.  All matters of these houses will be influenced, and that includes a long list! To name a few: corporations, courts of law, foreign affairs, foreign trade, religion and clergy, overseas traffic; stock and commodity exchanges; entertainment, education, gambling, and investments!


To read the newsletter in its entirety Click to read newsletter . 

When reading the newsletter on the web site, be sure to take note of the Moon Phases section and get the "Head's Up" - upcoming astrological events list.

Understanding the potential of planetary cycles and what the technical charts tell us is our best bet for successful trading. We need to see the whole picture! I encourage all of you to look at the weekly technical charts by Randall Ashbourne (posted weekly on this blog).

***
FORECAST 2014, an eBook by Randall Ashbourne -
If you have been following the blog, or reading the Eye of Ra at, www.theidiotandthemoon.com, you already know by now that Randall makes what can be a very dry and difficult subject - Financial Astrology - easy to understand, quite interesting, and sometimes amusing! With his witty and wry sense of humor, Randall never holds back, giving us his experienced professional opinion on how the markets are performing.

His latest eBook The Idiot & The Moon, Forecast 2014 has predictions, price targets and trend change dates - it is the perfect companion to his book, The Idiot & The Moon, Compleat and Utter Idiot's Guide To Trading Stocks.

The Idiot and The Moon, FORECAST 2014 by Randall Ashbourne

NOTE: Planetary price targets for gold are contained in Forecast 2014 - as are the targets for the major stock indices.

With each purchase of  FORECAST 2014 you will receive a separate special edition report on Gold. "The report details the timing of potentially important transits this year to the "birth" chart of modern gold trading, looks at the how the price of gold is performing, intermediate and long-term, in relation to the planetary price movers, and also looks closely at the technical condition of the charts."RA

            FORECAST 2014 CHAPTERS INCLUDE
  • 2014 ... and let slip the dogs of war
  • Jupiter Square Uranus ... and the danger of déjà vu
  • Mars ... the mover of markets
  • Bradley Model - 2014 major and minor trend change dates
  • Moods of the Moon - Lunar phase trading performance in 2013
  • Month by Month - monthly astrological transits in time map form
  • Technical conditions and planetary price targets
***

13 months of Astrological Investing Calendars! - The monthly transit calendars published on the blog are available to purchase as a full 2014 calendar through January 31, 2015 - for New York, London and Sydney. Download these handy PDF calendars to your iPad, or other electronic reader and/or and phone, and of course, to your computer to read. (They are printable as well.)

Included are transit to transit aspects; dates of Moon Phases, Planets Stationing (changing directions) and Eclipses; and a schedule of open hours and days for each market, New York, London, and Australia.

These calendars can be purchased individually for $8.00, but all three are available for $16.00 Click to purchase.

Saturday, July 13, 2013

Targets for The Top of the Bull market

Randall Ashbourne, an associate of Astrological Investing, posts a weekly market report on his web site, theidiotandthemoon.com The following is this weekend's Eye of RA report: Week beginning July 15, 2013
Targets for The Top of the Bull market
".. astrological expectations never over-ride
technical conditions"
We will spend some time this weekend reviewing the growing danger signals that the Bull run is topping out.

I indicated last weekend: "There is a strong chance, at least from an astrological viewpoint, that the next downleg of the multi-week correction is due to start."

However, the normal Mercury Retrograde spurt-and-reverse cycle has not played out.

I did also say: "There is some chance the correction is over and the bounce will continue. July tends to be a stronger month for the Wall Street indices than June."

However, repeating that now is just mealy-mouthed arse-covering. Basically, I got it wrong. I'd thought the normal tendency of the Merc Rx cycle, combined with the statistical negativity of the New Moon to Full Moon period would drag on stock markets and it didn't.

There is some danger everyone will do a complete "re-think" when Mercury goes Direct again at the end of this week, especially since the Grand Trine involving Jupiter, Saturn and Neptune becomes exact mid-week. I dealt with this recently and the full report can be found in the Archives.

Once that aspect finishes, the next major one will be Jupiter making a T-square with Uranus and Pluto, an aspect renowned financial astrologer Ray Merriman describes as a "classical" bankruptcy signature.

But, I am much less concerned with The Spooky Stuff  than I am with the warning sirens starting to go off in the technical condition of the markets - especially on Wall Street where everyone is hooked on the cheap money the US Federal Reserve has been pumping into the financial system.

Every few years the May to October timeframe produces market behaviour which turns out to be a major, long-range turning point. And this may well be one of those times.

So, let's begin. And, courtesy of the Incredible Charts software, we'll start with a quarterly chart of the Dow Jones Industrials. At an eyeball glance, the DJI appears to be making a multi-decade megaphone pattern. And it has the uberBears drooling. They believe the Dow is getting set to drop not just to the lower line of the "jaws of death", but will plunge down through it.

Maybe, maybe not. That's something we'll have to try to judge sometime in the future; not now. What is concerning is that these new price highs in the DJI are not being fully-endorsed by the mid-range oscillator. I've placed an orange horizontal at its recent peak - and it's a level that has shown up as marking out a topping pattern several times.

For the moment, the oscillator is maintaining its own uptrend angle from the Bear bottom in 2009. But it is starting to falter.
click for larger image
 We'll go next to a DJI monthly chart and use the 50CCI ... what I call the long-range Canary, or the Big Bird. We've been watching and waiting for a while now for Big Bird to start to diverge from the price action. If you look at the 2007 topping pattern, I've put a thick, red diagonal on the May-October price action of that year ... and while it went north, Big Bird went south during that period.

For the moment, the DJI's price continues at an angle which is too far, too fast to be sustained ... and while the price of the index has climbed above the 2007 peak, Big Bird has not reached the lofty levels it did then; which is long-range negative divergence in itself.
click for larger view
Next we go to the weekly chart. And it's here we see the warning sirens are starting to become quite strident. Divergence between the price and the weekly version of Big Bird became very, very obvious ... and the warning is not simply that Big Bird went down the falling red diagonal while price rode the climbing red diagonal in that timeframe.

You'll see a thin, orange horizontal in both price and oscillator areas. Price came down and turned back up after reaching the level of an earlier consolidation. Big Bird didn't; it plunged through. It did not lose the +100 level, which is near-term Bullish.

But! The warning sirens are going off and week-by-week, they're starting to get a little louder.
click for larger image
 In 2007, markets put in a volatile topping pattern from May through to October; in 2011 they plunged during that period. It's a timeframe which needs to be watched carefully - especially if a Bull market top is now being put in place.

And we can see the potential for that to happen in Pollyanna, the SP500, as well as the DJI. While the Dow nears the top line of the megaphone, Miss Polly is rising again to challenge the top of her channel - a redline barrier with a history of producing sharp price reversals when it's breached.
click for larger image
 Monthly Big Bird has not started to screech horribly in the chart above - though it's still below its 2007 peak, with the price of the index higher. That's not exactly a sweet, clear song.

And weekly Big Bird in the chart below is now getting distinctly unhappy.
click for larger image
 I've been stressing lately that the danger signs are increasing; which doesn't mean that The Top has already been reached. Well, not for Wall Street. I think some other indices have probably arrived at their Bull highs and are now just marking time, waiting for Wall Street to face the reality that printing money to prop-up stock prices is ... "irrational exuberance". Again. Slow learners.

To find out exactly where Miss Pollyanna might top out this Bull run, I do need to turn to The Spooky Stuff ... my long-range planetary price chart for the index.

I had fully expected this run to stop, or at least stall heavily, in the Pluto/Node range from 1519 to 1574. The state of the Birds never did agree with me. As I've said often: astrological expectations never over-ride technical conditions. And they didn't this time, either.
click for larger image
Anyway, the chart above gives three clear potential target areas for the Bull to exhaust himself at. Over the course of the next few weeks, I'll try to update the targets for other indices, including the major Europeans, India and Asia.

Fairly regularly, I update what I call my Weekly Planets charts for various indices - and if you're not taking advantage of them, you're mad. It's really not that hard. You do need to be able to use an oscillator in conjunction with the price targets to know when the technical signals for a turn are obvious.

I had a truly irritating email during the week from someone who asked: "What's an oscillator?" Well, darling, if you're too damn dumb, or too damn lazy, to spend a few minutes going through these FREE weekly reports, don't waste my bloody time.

For those of you do read and seek to learn - and that, I know, is about 99.98% of readers - here's a quick how-to using the FTSE WP and ASX200 WP charts.

Given the level of negative divergence in the Big Bird as the FTSE temporarily breached the 6849 level, it was a fairly safe place to Short that index. There was no early positive divergence signal as the index breached 6047, though the rapid recovery did indicate it was a reasonable place to go Long again.

click for larger image
It was pretty much a case of "ditto" for the 200, where there was oscillator divergence at the price high and a small case of positive divergence at the price low.

Remember these are weekly charts and the dailies can be used for fine-tuning Entry and Exit points ... Just as I did earlier in the Dow charts. The quarterly shows the danger signs starting, but not strident ... while the weekly shows just how strongly the klaxons are starting to growl.

Using the Weekly Planets charts for intermediate-range moves is just a variation. They set the potential targets, but you use daily charts to tell you whether your anticipated trade is ready for Entry or Exit. And once the move starts, in either direction, you have ideal prices to use as the base for Loss Stop provisions.
click for larger image
Okay, that's a wrap for this weekend. Frankly, I have no idea what the short-term direction is ... and I believe Benign Ben is due to make an appearance before the House this week. Personally, I live in dread anytime Ben is presented with an opportunity to "clarify" the Fed's current position!
 Safe trading - RA

Randall Ashbourne
Astrological Investing's associate, Randall Ashbourne, author of the eBook, The Idiot and The Moon, and The Idiot and the Moon, Forecast 2013, writes a free weekly column titled, The Eye of Ra on his web site in  which he explains the potential impact of astrological aspects and the current state of technical conditions. Ashbourne's charts are revealing illustrations of exactly what has occurred in the market and the probability of what to expect.
Important reading:  Randall Ashbourne's The Idiot and The Moon, Forecast 2013 , Jupiter's cycle and its effects on Wall Street and a posting of the weekly Eye of Ra report in this blog, titled A look at the Venus Retrograde effect
(Disclaimer: This article is not advice or a recommendation to trade stocks; it is merely educational material.)
Copyright: Randall Ashbourne - 2011-2013

The Idiot and the Moon, Forecast 2013  Sale price 1/2 off!
  • Major trend change dates for the full year, plus a month-by-month breakdown of high-energy trading dates and critical reversal dates.

  • An index-by-index analysis of Moon Trading across major American, European, Asian and Australian stock indices-

  • Identifies the major indices where following the phases of the Moon can dramatically cut profits, or even result in large losses.

  • Old Gods & Gold ... a Eureka! discovery about exactly what drives gold prices during rallies and corrections and charts showing highly-reliable target levels to both the upside and downside.

These price charts are individually-tailored to each index and cover Wall Street, Australia, Canada, Hong Kong, Singapore, Shanghai, India, England, Germany and France.

You will not see these charts anywhere else on the Internet!

And much more...

It is NEVER too late in the year to have this monthly information!
Sale Price $10.00

Saturday, September 22, 2012

A Harvest Moon in a Cardinal T-square

Randall Ashbourne, an associate of Astrological Investing, posts a weekly market report on his web site, theidiotandthemoon.com The following is this weekend's Eye of RA report: Week beginning September, 24 2012

The end of the coming week - the end of September - brings a Harvest Moon when we shall reap what has been sown. 

And there is at least some danger that the silhouette flying across the face of the Full Moon is ... a black swan.

Last week, we had the second exact aspect of Uranus square Pluto; it's a long-range astrological event with a history of sending the world into a financial tailspin and reoccurs a number of times heading into 2015.

I've discussed the broad symbolism of it in these columns over the past year and detailed it at length in Forecast 2012. It's basically aggressive, radical reform challenges the status quo and the desire of the plutocrats to keep tight control.

According to a news report sent to me by my colleague Marlene, at www.astrologicalinvesting.com, George Soros is now so worried by the symbolism of the aspect, he has dumped stocks and turned to gold. I don't know if the eminent investor has been in the fortune teller's tent lately, but it sure sounds like it.

"Soros, who has written extensively of a coming global paradigm shift  in his book, The Crash of 2008 and What It Means, calling the current economic and political model ”an end of an era,” has recently suggested that the financial and economic situation across the world is so serious that Europe could soon descend into chaos and conflict. He also notes that the world is entering “one of the most dangerous periods in modern history”, and foresees violent riots in America and a brutal clamp-down by the government that will dramatically curtail civil liberties."

There is a chance some of that will take centre stage over the next week or two, because the Full Moon sets off the energy ... with the Moon in Aries conjunct Uranus and square Pluto in Capricorn, while the Sun in Libra is opposed to Uranus and square Pluto.

The aspect involves three of the Cardinal signs - action signs; and with Venus squaring Mars, it's a lot of potentially negative energy.

Over the past few weeks, we've gone through long-range and weekly planetary targets for a range of indices to get an idea of what's possible for a final topping range.

Last weekend, I introduced the main part of that Eye edition with a couple of planetary charts which hit their targets fairly precisely. This week, we'll repeat the exercise, starting with India's Nifty 50.
click for larger image

I updated this chart last weekend with the new upside target listed at 5690-ish. Mission accomplished.

Similarly, in the past few weeks, we've kept a close eye on the targets for Germany's DAX index.
click for larger image

And with a high of 7478 hit on Friday, the DAX has also come very close. Now, there's something else about this chart I want to stress for any of you having trouble actually applying some of the techniques outlined in The Technical Section. As y'know, I've been discussing the lack of negative divergence apparent in the long-range Canary, particularly on the SP500.

This is another example of it, using the fast MACD. I've made the point in the book that negative divergence takes time to develop and there's a classic example of that marked with a yellow oval during the small Head&Shoulders pattern which formed the last time the DAX hit these planetary levels. The MACD peaks continued declining as price formed the topping pattern.

And, as I've been doing with the 50 CCI, I stress that sort of divergence just isn't there in any meaningful form during the current price moves.

What that means is this ... it is PROBABLE that we have NOT yet seen the final highs in most of these indices. Now, the only caveat to that is the arrival of a Black Swan. And, by their nature, Black Swans are difficult to predict. All I can say in terms of The Spooky Stuff is that the next couple of weeks sets up the conditions for the potential for one to occur. But, most of the time, we follow the rule that astrological expectations do not override technical conditions.

In discussing Pollyanna, the SP500, last weekend, I indicated the Neptune price level the index had hit was historically important and that we had probably touched at least a stalling point. Eh! There's no need to labor the point. If you need a reminder of the long-range levels, go back into the Archives.

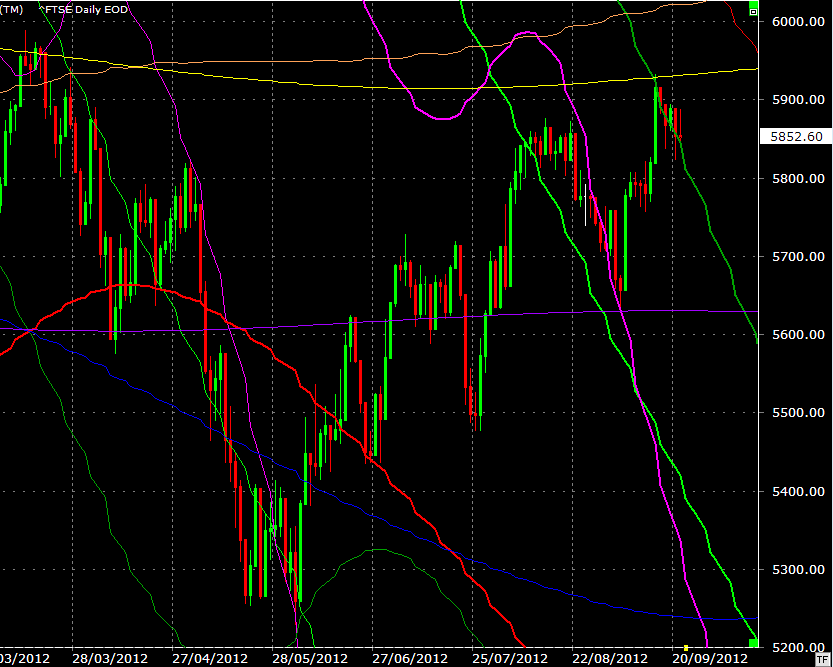
We took a look at London's FTSE last weekend and I said its failure to close above a Venus/Uranus price crossing point indicated a correction was likely to begin. And ...

Again, check the Archives for the FTSE's Weekly Planets targets. And now we're going to do something I really should have done long ago for my Asian readers ... look at the state of the Singapore and Hong Kong markets.

The Hang Seng index has hit Weekly Planets targets capable of stalling its recent rise. There are no warning signs from the state of the oscillator, but further gains require the index to move above the grey Neptune line and also get on top of the primary Saturn line (thick cyan).

The Straits Times index, of Singapore, is showing a potential double top with significant negative divergence in the height of the current MACD histogram peaks - a potential warning sign the next couple of hundred points will be difficult to achieve immediately.

Recently, I've been showing one of my private charts I use for the ASX200 when it is between levels on its Weekly Planets chart ... and the template also works for the STI.

In the coming week, price on the Straits Times will have to overcome the negative influence of a downtrending Mars line ... or drop with it.

And our final chart for this weekend is my home index, the ASX200 ... and Auntie's Weekly Planets targets, whichever way things go.

Okay ... a brief recap. Those indices which have put on a spurt, like the Nifty and the DAX, are hitting important weekly levels ... as Pollyanna did the previous week.

If we were to take our cues from a purely technical point-of-view, there are no major alarm bells going off and therefore the probability is that most of these indices are still within a Bullish run.

The only thing which would normally throw us off an optimistic course would be the arrival of a Black Swan ... and there are Spooky Stuff conditions which allow such an event to occur in the near future.

However, even though the Harvest Moon does carry that potential, we also have to consider that we're not only coming into the end of the month, but also the end-of-quarter, when the bonus boys often cook the books to line their pockets.

In the past few weeks, we've been through a range of long-range and weekly planets charts to get an idea of price targets, upside and downside, and all of that information is in the Archives.

Safe trading - RA


Randall Ashbourne
Astrological Investing's associate, Randall Ashbourne, author of the eBook, The Idiot and The Moon, writes a free weekly column titled, The Eye of Ra on his web site in  which he explains the potential impact of astrological aspects and the current state of technical conditions. Ashbourne's charts are revealing illustrations of exactly what has occurred in the market and the probability of what to expect.
Important reading:  Randall Ashbourne's article, Jupiter's cycle and its effects on Wall Street and a posting of the weekly Eye of Ra report in this blog, titled A look at the Venus Retrograde effect
(Disclaimer: This article is not advice or a recommendation to trade stocks; it is merely educational material.)
Copyright: Randall Ashbourne - 2011-2012

Wednesday, April 1, 2009

April Fool! Venus Rx T-Square Pluto, Moon

Expose Yourself to ArtSorry... It's not so funny for you who may have a natal planet or point at 3 or 4 Cardinal in your natal chart!

The Moon changes signs today as she ingresses into the cardinal zodiac sign of Cancer. At 6:06 pm EDT today the Moon will exactly oppose Pluto in Capricorn and together they will form a T- square to Venus retrograde at 4 Aries.

Venus rules the value of stocks, and the market is surely in for a bumpy ride.

The day begins with Moon square Uranus at 1:48 am, then a trine to Neptune at 5:03 am before she goes Void of Course during the NYSE trading hours. The first aspect she makes after her entrance into Cancer is the opposition to Pluto, then an exact square to Venus at 7:28 pm EDT.

Unpredictable market fluctuations occur during Void of Course Moons, and it is never a good day when Luna makes such harsh aspects. I imagine overnight trading will react from the T-square as well. And since we are half-way through the Venus Rx period, it is expected that the market will continue this pull-back that began last Friday.

About the photo -
I was always sure that the photographer who shot this photo had something completely different in mind, but back in the early 80's when I saw the poster hanging on display, all I could see when I looked at it was Pluto exposing himself to Venus! I cracked up laughing at the irony, and felt compelled to purchase a copy for myself.

It wasn't until recently that I discovered the real story behind the photo... and a regular Venus Retrograde experience to discover the history of a piece of "art" that one has owned for a while!

It is an actual photo of a popular political figure from Portland, Oregon. Bud Clark, who served as Mayor of Portland from 1985 to 1992, and was known for his eccentric behavior. Expose Yourself to Art was taken and widely distributed before he ran for Mayor; however the poster did nothing to deter his winning the election. He astonished the incumbent, Frank Ivancie, who had not taken Mr. Clark seriously as an opponent. Ivancie mocked Clark saying (his) "only claim to fame is exposing himself to a downtown statue."

According to the photographer, Michael Ryerson, who took the photo, "Bud was very active on the Venereal Disease Action Council, and he wanted to make a poster drawing attention to their cause. The Council had produced a T-shirt to promote awareness in the high schools, which at the time had an alarmingly high level of this problem. It was titled "Zap the Clap," which was on the T-shirt he was wearing (under the overcoat.)"

Although the poster now hangs on an attic room wall, it once hung in my bedroom. I can't remember if Venus was Retrograde back when I decided it needed a spot on my bedroom wall, but it must have been. The rule we astrologers give to our clients who are interested in decorating their homes is to never buy anything during Venus Rx, because you have a good chance of buying something that lacks good taste.

Still...I think it's funny.