Wednesday, July 11, 2012

Backtesting the Mars-Uranus crash cycle

Randall Ashbourne, an associate of Astrological Investing, posts a weekly market report on his web site, theidiotandthemoon.com The following  is this weekend's Eye of RA report:    Week beginning July 9, 2012

There is a very famous American financial astrologer who makes dire predictions whenever Mars is about to make a harsh aspect with the old weirdo, Uranus. So, this weekend we're going to examine the historical reality of whether there really is a Mars-Uranus crash cycle, since we have the potential for one to develop in the next couple of weeks.

And we're also going to revisit some comments I made a month ago about Jupiter's sign change to Gemini shifting the money flows.

Overall, the high-energy days for the coming week are likely to be Thursday and Friday, when both Mercury and Uranus go Retrograde ... and the Sun moves in to square Saturn. But, it is the following week which is likely to be much more volatile as Mars, now in the Cardinal (action) sign of Libra, squares Pluto and opposes Uranus

The Sun square to Saturn, coupled with Uranus going Rx as it's fired up by Mars, do symbolise a major energy shift which has the capacity to turn markets and accelerate the moves.

But, before we get to that, I want to return to some comments I made about Jupiter changing signs to Gemini.

I said: "With Jupiter in Taurus, for example, the emphasis has been on banking and debt - the Taurus/Scorpio axis; and also on technology and gold, the Aquarius/Leo axis. I think most of you will agree that banks, brokers, Apple and gold have been the topics de jour for all the time the FatBoy has been in Taurus.

Slowly, you'll see a change; transportation, travel, health, labour and oil will begin to fill the news pages."So, this weekend we're going to examine the historical reality of whether there really is a Mars-Uranus crash cycle, since we have the potential for one to develop in the next couple of weeks.

Now, let me indulge in a little bit of basic astrology for those of you unfamiliar with the arcane details of The Spooky Stuff. Jupiter was head honcho of the Old Gods and is associated with all the good things - he expands whatever he touches.

So, while he was in Taurus and opposing Scorpio, the banks and debt got exaggerated ... and because the FatBoy was squaring the Leo/Aquarius axis, the effect also impacted on gold and the technology sector.

In early June, I indicated the emphasis would start to change. Gemini rules transportation and the media; Sagittarius rules foreign travel, universities and the law; Virgo is labour, accountancy, health; and Pisces rules oil, shipping, hospitals, prisons and (with Virgo), big pharmaceuticals.

The effect of Jupiter is to expand either the supply OR the demand. I really want to emphasise that point ... the supply OR the demand.
Several news reports caught my eye during the week.

NEW YORK - US stocks have racked up solid gains in a holiday-shortened trading session, boosted by reports of strong June sales from the leading US auto makers.

Data showing that car sales in Germany are resisting the eurozone crisis drove Frankfurt's DAX 30 index up 1.26 per cent to 6,578.21 points.

DETROIT - The Big Three US car manufacturers have reported strong domestic sales for June, capping a solid first half of the year even as US economic growth overall remained weak.

DETROIT, July 3 AP - General Motors Co said its US sales rose 16 per cent in June on solid demand for small and midsize cars.

PARIS - US aircraft maker Boeing has raised its 20-year forecast for global demand for airliners by $US500 billion ($A489.21 billion).

We've also been treated to plans by News Corporation to split itself into two divisions. And, there was a very interesting story about how a massive fleet of Chinese coastal shipping - somewhere between 1500 and 2000 cargo vessels - is now competing for traffic volume worldwide because trade between northern and southern China has declined massively.

So, this is an example of how it works. Jupiter in Gemini squares the sign of Pisces, which rules shipping, and the SUPPLY of ships suddenly becomes terribly exaggerated.

Jupiter opposes Sagittarius, the sign of foreign travel, and Boeing gears up for a big increase in DEMAND.

Jupiter enters Gemini, the transportation sector, and the DEMAND for new cars surges ... or the world's biggest media conglomerate splits into TWO (always a Gemini signature!).

I revisit this issue because a sign change by Jupiter is one of the more reliable astrological predictions ... the money flow WILL change to different sectors, either the supply OR the demand will escalate dramatically in those sectors ... and there are substantial profits to be made by getting out of the former and piling into the latter.

So, it could prove to be worthwhile to look at the technical state of the charts for car manufacturers and transport companies (including railroads), big pharmaceutical companies, oil companies, media stocks, airlines ... and any companies associated with supplying services to either them, or hospitals, prisons etc.

***
Okay, now let's turn our attention to whether or not there really is a RELIABLE Mars-Uranus crash cycle. We'll concentrate purely on the opposition aspect, since that's the one due to become exact in the next couple of weeks. I do need to emphasise that this next one occurs with a simultaneous square to Pluto, so is more likely than usual to have an impact, especially since all three planets are in the early degrees of Cardinal signs.

We will begin by examining the impact on the SP500 in recent years.
Mars opp Uranus
click for larger image
We're looking at a weekly chart of the Pollyanna index and the Mars opposed Uranus aspects are marked with red bars. And it's immediately obvious that the aspect does NOT necessarily provoke a market crash. Of the seven instances marked on the chart, only two turned up near important Highs. Four of them occurred nearby important Lows.
What gets some astrologers overly-excited, is that it was one of the aspects in effect at the start of the Great Crash.
click for larger image

The chart above shows the Dow Jones Industrials from the late 1920s to early 1970s - and one can see why the arrival of Mars opposed to Uranus sets the alarm bells ringing. The aspect does have an overall tendency to occur very nearby the start of some very bad crash cycles.

But, it's not a certainty, as we can see in the chart below, which covers the Great Sideways Shuffle period in the DJIA from the early 60s to early 80s.

DJIA 1960's
click for larger image
Okay, it's almost time to stop waffling on about les Spookies and turn our attention to the techie charts. The point I wanted to make is that astrology does have its uses. There are some things it is very good at predicting reliably - which is the sector shift caused by Jupiter changing signs.

And there are other things which get some astrologers very, very excited ... but which are a tendency, rather than a reliable certainty.

At the risk of boring you all silly, I will repeat the mantra again ... Astrological expectations do NOT over-ride technical conditions!
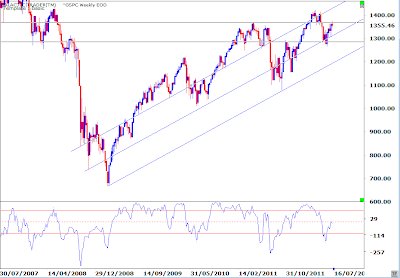
GSPC-Weekly EOD
click for larger image
As I said last week, there are only two really important horizontal lines of Support/Resistance for the 500 ... and, GeeGolly, looks like they continue to be important, eh?


And we've been discussing this one, too, for the past few weeks - expecting she'd face some hurdles at the 1340s and 1360s. We have some relatively mild divergence showing up at last week's pre-holiday peak in the height of the MACD histograms ... and the potential is showing on the earlier weekly chart for the intermediate-range Canary to be turned down from a hit of the Zero line.
Support/Resistance SPX
click for larger image

Let's go to London's FTSE.

click for larger image
I introduced this chart a few weeks ago to show the potential for a the index to launch a rally from contact with the rising (diagonal) Sun lines ... but I'd like you to compare the planetary chart with the technical one below.
And the reason is I want to emphasise to those of you on a budget that you don't need really fancy software. In the chart below, the bounce came from a hand-drawn trendline, which then allowed us to set up some Fibonacci Retracement targets. Targets which have worked very well!

click for larger image
All of this comes back to the point that trading profitably does NOT have to be terribly difficult. WE make it difficult by clogging our brains with crap. Simple works! Simple works really bloody well. Shut out the noise ... pay attention to the simple charts you've drawn for yourself ... watch for divergence in the oscillators when Price is hitting predetermined levels of Support or Resistance.

I'll leave you once again with Auntie's Weekly Planets chart for the ASX 200.

click for larger image

Safe trading - RA

Randall Ashbourne
Astrological Investing's associate, Randall Ashbourne, author of the eBook, The Idiot and The Moon, writes a free weekly column titled, The Eye of Ra on his web site in  which he explains the potential impact of astrological aspects and the current state of technical conditions. Ashbourne's charts are revealing illustrations of exactly what has occurred in the market and the probability of what to expect.
Important reading:  Randall Ashbourne's article, Jupiter's cycle and its effects on Wall Street and a posting of the weekly Eye of Ra report in this blog, titled A look at the Venus Retrograde effect


(Disclaimer: This article is not advice or a recommendation to trade stocks; it is merely educational material.)
Copyright: Randall Ashbourne - 2011-2012


Wednesday, June 20, 2012

July 2012 Astrological Calendar - Transits for NY NY, The NYSE

Astrology calendar showing the day and times of planetary aspects for the NYSE, for the month of July 2012.

Astrological Calendar with Transits for NY NY, The NYSE July 2012


Click image to view full size calendar.

July 2012 Astrological Calendar - Transits for London, England, The FTSE

Astrological Calendar showing the day and times of planetary aspects for the FTSE, for the month of July, 2012.
July 2012 Astrological Calendar - Transits for London, England, The FTSE


Click image to view full size calendar.

July 2012 Astrological Calendar - Transits for Sydney, Australia, The ASX

Astrological Calendar for planetary aspects for the ASX, July 2012
Astrology calendar showing the day and times of planetary aspects for the ASX, for the month of  July 2012


Click image to view full size calendar

Monday, June 18, 2012

A Second New Moon in Gemini !

Astrological Investing New Moon forecasts show general trends and financial outlook for the month
 Chart from the point of view of Wall Street and the NYSE.
 New Moon in Gemini, June 19- Chart from the point of view of Wall Street and the NYSE.

A second new Moon in Gemini? Yes, here we are at the second new Moon in Gemini this year. As I stated in the last New Moon Newsletter, two new Moons doesn't happen often in the sign of the twins, or any of the signs. Only when a new Moon is at the very earliest degree of a sign can it happen. The Moon's cycle is 28 1/2 days.
So... how did the solar eclipse of May 20 and the full Moon eclipse of June 4 work out for you?
Remember, the influence of an eclipse is long lasting! The influence of eclipse energy can dramatically reappear as transiting planets aspect the degree of the eclipse and other planetary positions in the eclipse chart.

Watch for planets transiting 0° and 14 °mutable - Mars will often reactivate the energy of an eclipse. These eclipses took place in Gemini, so watch Mercury transits as well.
Stocks that have first trade or IPO charts with planets within 5 degrees of 0° and 14° in mutable signs. (Gemini, Virgo, Sagittarius and Pisces) are under the influence of these eclipses.

I mentioned in the last newsletter that the IPO chart of Verizon (VZ) has Jupiter at 0° Gemini.   VZ is in the "Gemini Sector" (governed by Gemini and the planet Mercury) VZ has a very promising year as Jupiter transits Gemini.

If you are interested in obtaining all the data for first trade charts and incorporation charts of Dow Jones Industrials charts, click here.  

An Astrological Trip Around the New Moon in Gemini Chart
Note: New Moon periods tend to be a positive time for the markets, often coinciding with temporary highs relative to the direction the market is trending.  There are many of you who have been trading with the phases of the Moon and having much success; and you know by reading Randall's The Idiot and the Moon that there are times when it doesn't always work out that way! (Read Randall Ashbourne's article, The Moods of the Moon - Trading the Mood Swings of the Monthly Lunar Cycle   be sure to purchase his eBook, The Idiot and the Moon )

The New Moon brings out The Courageous and The Optimists!
Mars in the first house, waxing sextile to chart ruler, Mercury, and Jupiter conjunct the Mid Heaven
- This aspect, along with Venus, and the new Moon transiting the 10th house (Jupiter makes a conjunction to the mid heaven at the time of the new Moon)  is going to bring out the courageous and the optimists!
IF you are a risk taker, then you may very well may get your kicks taking a long position in the SP 500 right in the third quarter Moon period and up to the new Moon this lunar month. 
HOWEVER! This is definitely NOT a time to be long in the market if you are faint of heart!!!  And why I said if you are a risk taker, you very well may get your kicks being long in the market on the new Moon. Warning - the Mars aspect is waxing, and the angles of the chart move swiftly. Have an exit strategy!
Saturn in the second house applying in a hard aspect with new Moon chart ruler, Mercury - This is an indicator of dire economic news.  Earnings reports may disappoint, or if not, they may be overshadowed by European economic and political news.

Pluto in the fifth house square Uranus in the eighth house - THE MOST significant and dominating aspect in the chart! This is the first of a series of waxing squares between Uranus and Pluto during 2012 - March 2015.  According to Raymond Merriman in his book, Forecast 2012, "..this is the most challenging time for world leaders to resolve their economic and political crises.." (Read the Heads Up section on the web site in the New Moon Newsletter where I discuss Pluto square Uranus further.)

Neptune in the sixth house - Trade unions and workers are the focus both here and abroad. Unacceptable unemployment numbers and the health of the economy take a toll in the markets.

Venus and the new Moon in the tenth house, Jupiter conjunct MC - A promising new Moon, but fleeting. Be careful with Uranus square Pluto and the upcoming Neptune square Jupiter aspect. (discussed on web site in the New Moon Newsletter, Head's Up!)

Mercury in the eleventh house square Saturn - Discussions of new restrictive regulations on business create uncertainty in the market.

Commentary by Marlene Pfeifle

Knowing how astrology actually coincides with market cycles and the market trend will help you become more profitable in the market - much more so than a reading of transits in a mundane horoscope. Knowing what the outlook for the lunar month gives one a broad picture of the potential astrological energy that can affect the market, however, knowing both astrology and technical aspects is your best bet for successful trading.  Remember the old adage, "the trend is your friend".

Randall Ashbourne's charts are revealing illustrations of exactly what has occurred in the market and the probability of what to expect -  Each weekend, my associate, Randall Ashbourne writes a stock market forecast in his Eye of Ra Report on his web site, http://www.theidiotandthemoon.com/.  The information on the web site is free, I hope you take advantage of the valuable information he shares in his books and on the web site.

Important reading: Read Randall Ashbourne's article, Jupiter's cycle and its effects on Wall Street and in his archives, the weekly Eye of Ra report, titled A look at the Venus Retrograde effect, Week beginning May 14, 2012

Moon phases (for our subscribers who trade using phases of the Moon)
New Moon June 19 - 1st quarter Moon, June 26;  Full Moon, July 3;  Last quarter Moon, July 10;   Next New Moon, July 18.  (Read Randall Ashbourne's article, The Moods of the Moon - Trading the Mood Swings of the Monthly Lunar Cycle)  

Safe Trading! Marley

Read the entire New Moon Newsletter on the web site at www.astrologicalinvesting.com/html/newsletter.html
 Read HEADS UP! - A Critical Astrological Period, June 20 through 30th - Upcoming astrological events included in the newsletter. 

Sunday, June 17, 2012

Solstice, June 20, 2012, Chart Analysis with discussion of Astrological Events

June 20, 2012, Summer Solstice, Washington D.C.
Summer Solstice, June 20, 2012
Chart for Washington, D.C. USA
The first day of summer in the Northern hemisphere
*June 20, 2012 is the Winter Solstice in the Southern hemisphere
by Marlene Pfeifle, CAP
Uranus square Pluto is the astrological theme for this chart and for the summer. The season begins with, and ends with, a repeat of the Uranus square Pluto aspect in September. (see exact dates in list above) This aspect is MOST significant not only because it is the closest planetary aspect by degree, but because of the implication of its meaning.

What it suggests in the Washington D.C. chart is a summer filled with demonstrations and demands from the people. It's an election year, and people want change and reform in government. (The first house represents the people. Pluto is the demand for transformation and reform - the fourth house Uranus, is the restless urge for reform in their government.)

Actually, they want change and reform NOW - and their demands will persist.
A square aspect is tense, dynamic energy pitting the nature of the planets and the signs they are in against each other to force an outcome. Uranus in Aries is bold, impatient, impulsive and rebellious in the quest for individual freedom; Pluto in Capricorn, like a dark version of the comic book superhero, Superman, will only accept "Truth, Justice, and the American Way". Pluto will expose corruption and eliminate whatever is necessary for a positive end result. However, Pluto in Capricorn DOESN'T want to "throw the baby out with the bath water" and likes to move slowly and deliberately with control, destroying what stands in its path, but resisting impulsive, impatient rebel rousing and "change just for change sake".
       Randall Ashbourne describes Uranus - Pluto energy in his Eye of Ra Report, "... "I mentioned last weekend the symbolism of the Uranus-Pluto square as being an Aries/Capricorn confrontation of aggressive rebellions against "the powers that be" ... and I discussed in (my) Forecast 2012 how this had started with the so-called Arab Spring uprisings, which would continue to spread as they have in Syria and Bahrain, but how the same sort of energy would also manifest in other parts of the world.

And it's fairly obvious almost everywhere. There are all sorts of power struggles going on in China. Dissidents are getting bolder. Greece is an obvious Western example, but so is the growing angst in Germany. In terribly polite Britain, Prime Ministers former and current, have been called into the public forum to explain their relationship with the Murdoch empire and whether policy was traded for publicity.

Uranus represents an energy which demands change, reform and radical restructuring of everything it considers "wrong". In Aries, the demands are aggressive and, if thwarted, will turn to direct action ... from taking over the streets to taking up arms.

Pluto represents great power and great wealth concentrated very narrowly. In Capricorn, it is very much all about control by the plutocrats. There are nuances between nations in exactly how it manifests. In some of the Arab nations, it's pretty easy to pick the dictators." - Eye of Ra report, week beginning June 18, 2012"
- Eye of Ra report, week beginning June 18, 2012
It will be an intense summer in which the political climate will match the heat of the summer!

In the USA, political parties will officially nominate their presidential candidates at conventions - the Republican National Convention, during week of August 27; the Democratic National convention, during the week of September 3, 2012. With Pluto and Uranus in cardinal signs, we can expect ruthless, negative campaigns and rowdy demonstrations.

June 24 - Uranus square Pluto at 8° Capricorn (exact) - This is the first of a series of waxing squares between Uranus and Pluto during 2012 - March 2015.
    According to Raymond Merriman in his book, Forecast 2012, "..this is the most challenging time for world leaders to resolve their economic and political crises. In such a venerable climate, Gold is apt to remain a safe haven. Investors and speculators will seek protection by diversifying their portfolios with precious metals. A time that stands out in 2012 is the last tens days of June."

Uranus in the fourth house suggests the possibility of unusual, disruptive, destructive weather.  One never really can predict Uranus energy as it represents what is unexpected.  Earthquakes, floods, tornadoes, hurricanes, and loss of electricity due to the unusual weather are possible. Have a first aid kit handy, along with plenty of batteries, and extra food and water supplies in case of emergency. Keep your fuel tank filled in case you need to evacuate quickly.

Uranus turns retrograde July 13 When Uranus turns retrograde, Kaye Shinker taught that for the markets "about 4 days before the exact retrograde Uranus reverses the market trend.  Following the Rx motion 80% of the time the markets creep up."(The Textbook for Financial Astrology)

Click here to read the rest of the upcoming astrological events and chart anaylsis by Marlene Pfeifle

Monday, June 11, 2012

Jupiter to Gemini ... the Big Sector Shift

Jupiter
The God Jupiter
Randall Ashbourne, an associate of Astrological Investing, posts a weekly market report on his web site, theidiotandthemoon.com The following  is this weekend's Eye of RA report:.

The head honcho of the heavens changes signs in the coming week, shifting the emphasis of money flows into the markets over the coming year.

According to ancient symbolism, Jupiter is weakened in Gemini. The Old God we associate with expansion … he whom I call the FatBoy … goes on a diet and expansion loses some weight.

It’s part of the rationale behind The Jupiter Cycle (see Articles); markets have an historical tendency to peak with Jupiter in Taurus and decline until Jupie enters Leo, a Fire sign which sparks him up again.

It also means the money flow starts to move more rapidly into different sectors. The late Kaye Shinker, from www.astrologicalinvesting.com and the author of several textbooks on financial astrology, researched this effect at some length.

With Jupiter in Taurus, for example, the emphasis has been on banking and debt – the Taurus/Scorpio axis; and also on technology and gold, the Aquarius/Leo axis. I think most of you will agree that banks, brokers, Apple and gold have been the topics du jour for all the time the FatBoy has been in Taurus.

Slowly, you’ll see a change; transportation, travel, health, labour and oil will begin to fill the news pages. It does not mean the bank problems are about to disappear. All of that will continue because of the longer-term Uranus square to Pluto … the Aries/Capricorn confrontation of aggressive rebellions against “the powers that be”.

There are a few other, more minor, astrological events also coming this week … the 3Q Moon, Mercury squaring Uranus and opposing Pluto (GeeZeus! Yet more bank blabber.) And the Sun will trine Saturn mid-week.

Still, it’s Jupie’s sign change that’s the big event and I needed to give you the heads-up on that so you can trawl through your sector charts and consider adjusting where you have your boodle invested.

Now let’s have a wander through some charts. Last weekend, I indicated markets had to “bottom now” or they were likely to continue crashing badly … and I showed a couple of FTSE charts to highlight the potential for the optimistic outcome, even though Lunar Eclipse Full Moons didn’t have a particularly reliable record of bringing in a bottom.

I confess I’d completely forgotten the English cousins were going to shut down for a bit of pomp. Not that it made any difference; the signals were there … and, as it happened, played out.
FTSE - Rising Sun Lines
click to view larger chart
We began last week with a chart showing the FTSE’s normal reaction to rising Sun lines and I said: ”The index has had a distinct tendency to attach itself to one of these rising Sun lines during almost all of its uptrends, even the ones which have been relatively short-lived.”

So, the cousins bounced back. Rather strongly. In fact, probably too much so. Pay special attention to the state of the red Canary in the oscillator panel. We’ve had a few of these strong spikes since last November’s Low … and in each case, they’ve caused Price to stop the rally temporarily and go into a sideways shuffle.

Often, the shuffle continued until Price again made contact with the rising Sun lines.
FTSE’s Weekly Planet Lines
click to view larger chart
We can see the strength of the two-day move more clearly by just how far it travelled on the FTSE’s Weekly Planets chart, above.

The planetary Price resistance around last week’s High is obvious on both of the above charts … as are the targets for either a confirmed breakout or breakdown.

Okay, so the potential for a return to optimism was heralded by the FTSE’s “normal” reaction to rising Sun lines … but the real question is whether the rally can be sustained for any length of time.
Let’s revisit the Lunar Eclipse Full Moon chart …
S&P 500 - Full Moons
click to view larger chart
 Last week was the 8th Lunar Eclipse Full Moon since the Bear bottom in 2009. The 1st and the 6th of them coincided with downtrend Lows … and now, maybe, another one.

But, to be a reliable Low, Miss Pollyanna – the SP500 – needs to make a solid weekly break above primary Node resistance around 1325.

S&P 500 - Weekly Planets
click to view larger chart

If you consult last weekend’s edition, you’ll see the first harmonic Node line is a real long-term barrier for Miss Polly.
And the long-term uptrend is now under threat.

Jupiter Cycle Chart
click to view larger chart


The chart to the right is The Jupiter Cycle chart … markets peak with Jupiter in Taurus (dark green), drop into Jupiter in Leo (red) and rise again into Jupiter in Sagittarius (blue).

If the cycle plays out its usual tune, we could get a lower, secondary High with Jupiter in early Gemini … but it’s usually all downhill from there.

It’s why I’m more Bearish than Bullish. You’ll note the Canary has given two examples of negative divergence now … a lower peak at the most recent Price High and a deeper trough during the August/October spikes down.

Fibonacci Rx levels on Jupiter Cycle chart
click to view larger chart
The Fibonacci Rx levels marked on The Jupiter Cycle chart show the downside Price targets if we are now in the early stages of a renewed Bear market.

The 50% level is a particularly interesting one. Bill McLaren, an American/Australian market forecaster of long experience, has noted over the years that major consolidations during an uptrend, tend to become the halfway marker for the total rally. McLaren uses that consolidation to predict what he thinks will be “the final top” for a Bull run.

As you can see from that chart, the first long consolidation after completion of the first major wave up, marked out territory likely to become just as important on the way down.

We’ve discussed at various times over the past few months, how the ASX200 has responded to 50% markers.

So, with Pollyanna’s daily chart above, we would expect strong resistance to this bounceback rally to start showing up in the 1344-1360s region … IF she can break through the Node/Fibonacci barrier around 1325.
click to view larger chart
Now, let’s take a look at the ASX200 … and the omens continue to be just awful. Last week was a bounce from “obvious” Support … and very, very low support at that.

In the coming weeks, we’ll take a look at just how far down the Aussie market is likely to go if the Bear is back on the prowl. Believe me, it’s far, far too depressing to discuss this week!

I’ll leave you instead with an update of Auntie’s Weekly Planets chart.                    
                                click to view larger chart
Safe Trading - RA 

Randall Ashbourne
Astrological Investing's associate, Randall Ashbourne, author of the eBook, The Idiot and The Moon, writes a free weekly column titled, The Eye of Ra on his web site in  which he explains the potential impact of astrological aspects and the current state of technical conditions. Ashbourne's charts are revealing illustrations of exactly what has occurred in the market and the probability of what to expect.
Important reading:  Randall Ashbourne's article, Jupiter's cycle and its effects on Wall Street and a posting of the weekly Eye of Ra report in this blog, titled A look at the Venus Retrograde effect


Friday, June 8, 2012

Venus Retrograde - Example in the Markets

In my next new Moon newsletter I remind readers that Venus is retrograde until June 27.

Reiterating last month's warning of what to expect with Venus retrograde "The markets enter an ever- changing environment of unpredictability. Since Venus rules money, it is possible that the Federal Reserve Board goes back and forth on decisions made as it revisits and reevaluates past polices."

Yesterday's opening rally and the disappointing close is an example of that. Within minutes of the opening the Dow industrials were over 150 points higher than Wednesday’s impressive 287-point gain. This was the result of the news of China’s central bank's decision to cut interest rates for the first time in four years, and the hopeful anticipation of Fed Chairman Ben Bernanke to announce QE3 in the near future. 

However Bernanke failed to outline any new stimulus plans and within an hour of the close, profit-taking took back almost all of the early gains.

Sunday, June 3, 2012

More Downside in World Markets

SP Planetary Lines June 2012Tomorrow is a full Moon Lunar Eclipse. Be prepared for much more downside in the market. The eclipse is in a T-square to Mars, Neptune changes directions, stationing Rx a day before the Venus transit.
Randall Ashbourne's Eye of RA Market Report illustrates in the chart on the left what planetary lines are involved using Galactic Trader for the SP500.  In his report he discusses the condition of world markets. Click chart for larger image; for more illustrations read Randall's report:  http://www.theidiotandthemoon.com/eyeofra.html

Sunday, May 20, 2012

The New Moon in Gemini, May 20, 2012

Read this New Moon report in it's entirety at www.astrologicalinvesting.com/html/newsletter.html    New Moon forecasts show the general trends and financial outlook for the lunar month based upon location of the chart.* (see note )

 The New Moon in Gemini, May 20, 2012 (Chart from the point of view of Wall Street and the NYSE. (Click for larger PDF image)

Are you ready for this? TWO new Moons in Gemini this year! Gemini is the sign of the twins so it naturally makes perfect sense to have two in Gemini - however, two new Moons in the same sign doesn't happen often in Gemini, or any of the signs.  Only when a new Moon is at the very earliest degree of a sign can it happen. The Moon's cycle is 28 1/2 days - this new Moon in Gemini is at 0° 20' Gemini; the next new Moon in Gemini will be at 28°43' on June 19th.
But more importantly than twin new Moons, this New Moon is a solar eclipse!
And a Lunar Eclipse, Full Moon, follows on June 4.
I'm going to digress from my usual format of presenting the new Moon report, and discuss eclipses... and how this eclipse, and the following Lunar eclipse could potentially impact the financial market.

Eclipses happen on either a new Moon or a full Moon
A new Moon eclipse is a solar eclipse - a full Moon eclipse is a Lunar eclipse.  An eclipse is important astrologically because the energy has a long lasting influence - just how long of an influence varies.   Study has gone into exactly how long an eclipse has influence, yet there is actually no definitive answer.  Some say energy from a solar eclipse can be felt for as many months that are equal to the minutes/hours the actual eclipse lasts, or the amount of time the shadow of the eclipse can be seen.  Some simply say the energy of a solar eclipse can be felt up to 6 months, or until the next solar eclipse; Lunar Eclipses, not quite as long.

In any case, the reason the influence is long lasting is that the degree of the eclipse becomes very sensitive and the energy of the eclipse can dramatically reappear as transiting planets aspect the degree of the eclipse and other planetary positions in the eclipse chart.  

Transiting planets can trigger problematic international world affairs and harsh geological events.  Events that have potential to impact financial markets.

Malefic energy?
Ancient astrologers stressed the "malefic" quality of eclipses.  In reality, the energy is simply increased, intensified action. Therefore, challenging aspects (squares and oppositions) from outer planets, which are difficult to begin with, have added intensity which makes them more problematical.  Trines and sextiles - the so-called "easy" aspects can also be problematical, but most of the time the end results are fortunate.

Both the challenging and the easy aspects in an eclipse chart portend transformation and change.  In the end, it's really how well things are managed.

Earthquakes are associated with eclipses
The area over where the shadow of the eclipse passes is especially susceptible to seismic disturbances.  This solar eclipse begins in eastern Asia and crosses the North Pacific Ocean where it ends in the western United States. The greatest point of the eclipse is in the Pacific Ocean at 49°05.3'N 176°16.8'E. The ring of fire will be activated. View image of the path of the eclipse

Overall increased volatility in the financial market
Near the date of the eclipse, before and after,  there is a marked increase in volatility.  Eclipses have coincided with market reversals in either direction.

Check the first trade or IPO charts you are holding or considering to buy/ sell.  Look to see if they have planets within 5 degrees of 0° and 14° in mutable signs. (Gemini, Virgo, Sagittarius and Pisces)
As for individual stock prices, solar eclipses have both positive and negative effects, depending upon which planet it aspects in the stock's IPO or First Trade chart.   (If the chart of incorporation is impacted by the solar eclipse it may or may not influence the price of the stock.)

Solar Eclipses have a predicable influence on individual stocks.

  • With Sun, Venus, Mars, Jupiter, Uranus or Neptune you may see a positive affect on the price of the stock - but especially so with Venus and Jupiter, the money planets.
  • If the chart has Saturn or Pluto within 5° of 0° Gemini be careful - this eclipse could impact the stock very negatively!
  • Oppositions and squares are important to watch as well, but the conjunction makes the strongest impact. Trines, sextiles and minor aspects are not reliable indicators of whether the price of a stock will move up or down
  • Sixteen of the DJI incorporation charts will be impacted by this eclipse. However, only four of the Dow's IPO charts will be.
  • Exxon-Mobil (XOM) and AT&T ( T ) have Pluto at 0° Gemini in their chart incorporation. This suggests some sort of shake-up or transformation of the corporation. It will be interesting to see if it will have an influence on the price of the stock.
  • The IPO chart of Verizon (VZ) has Jupiter at 0° Gemini. This is very promising for the price of stock! Also, because VZ is in the "Gemini Sector" (governed by Gemini and the planet Mercury) this eclipse foreshadows a very promising year for VZ as Jupiter transits Gemini.

If you are interested in obtaining all the DJI charts, click here. The charts and data can be purchased separately, but are also found in Kaye Shinker's, The Textbook for Financial Astrology, Book 3.

An astrological trip around the Solar Eclipse chart:
Intense, high energy is suggested by the planetary positions.

The very powerful Scorpio chart rulers, Mars and Pluto, are trine - meaning, energy flows easily and in support of each other when in action.

The high energy of the chart is even more pronounced because the solar eclipse falls in an angular house.
Angular houses in the horoscope are dynamic. Planets in, and rulers of, angular houses express the most action and have the strongest impact.

Mars, co-ruler of the chart, is in an angular house (10th); Uranus is the 4th house, also angular; and, one must to give importance to how close Jupiter is to the 7th house cusp. Jupiter this close can act as if it were actually IN the 7th, which is very fortunate.

What makes this new Moon Solar Eclipse formidable is the square between Neptune and the 7th house Solar Eclipse, and Uranus in the fourth house square Pluto in the second. These could be considered ill-fated and very challenging aspects; yet there is a lot of supportive, favorable energy suggested in the chart otherwise, by house rulers and planetary rulers.

The Solar Eclipse New Moon in the seventh house square Neptune in the third house
Eclipses portend powerful change and transformation governed by the house and sign it falls in the horoscope.

In the 7th house and square Neptune, this eclipse suggests increased tensions and threatening developments arising in foreign affairs. Scandal, especially involving women, and outbursts of sensationalism in the media are prevalent. There is outrage over various forms of vice. Markets react unfavorably to dire political news, the issues of the current debt, national credit and monetary policy.

Solar eclipses in the sign of Gemini suggest multiple newsworthy events
Unexpected incidents involving travel - in the air, by rail, land, and on the sea - are possible, as well as events involving all types of communications, the media, and education.

Venus in the seventh house trine Saturn in the 11th house
Venus in her own house gives strength to Venusian energy, favoring a positive outcome in events. Even though Venus is retrograde and not strong by sign, Venus is trine an exalted Saturn in Libra. Saturn gives steadiness and fortitude to an otherwise flighty and unfocused Venus. Additionally, the sign Venus is in is governed by - ruled by - is Mercury. Mercury is in a very favorable aspect with Jupiter - conjunct - and all this mitigates problems and any anxiety resulting from the negative events suggested by the eclipse.

Venus in the seventh house is fortunate for foreign affairs. Therefore, a fortunate outcome will result even if there are tensions, difficulties and misunderstandings in foreign affairs and with foreign diplomats and state visitors.

With Venus being retrograde, old problems may resurface regarding money and finances. However, Venus trine Saturn is fortunate for the general prosperity of the country, and for all money matters, resulting in increased revenue, business, and the value of stocks.

Mars in the tenth house trine Pluto in the second house
High energy. This adds to the volatility of the market. National expenditures may increase, as well as taxes and Wall Street is angry over government actions.

Mars in the tenth causes military questions to rise, warlike rumors and activity is in the news.

A prominent person either in business or politics may become ill, or die.

Pluto in the second house square Uranus in the fourth house
The house where Pluto falls in a New Moon chart is where to expect transformation and change. Change in monetary policy should be no surprise - especially with Venus retrograde. However, Uranus energy is always surprising and unpredictable. So what's the shocking surprise? Who can predict Uranus?!?!

This aspect comes within 1 degree at the full Moon, so we will have to wait and see -

Uranus in the fourth house square Pluto
This spells problems for the current administration. Uranus here puts obstacles in the way and gives the opposition power.

Mercury conjunct Jupiter in the sixth
This is very fortunate for employment. Public services benefit and new regulations may be introduced. Good for trade and commerce abroad, railways, shipping and education. Jupiter favors prosperity in general. Mercury gets the word out - lots of media and coverage on the news.

***

Comments - Always keep this in mind:
  • New Moons statistically are times when the market is up - Full Moons statistically are not.
  • Eclipses are times of increased volatility in the market and exaggerated energy.
  • There is always risk in the market! More so during an eclipse. 

Knowing how astrology actually coincides with market cycles and understanding the market trend will help you become more profitable in the market - more so than just reading transits in a mundane horoscope. Knowing both astrology and technical aspects is your best bet. Each weekend, my associate, Randall Ashbourne writes a stock market forecast in his Eye of Ra Report on his web site, http://www.theidiotandthemoon.com/. The information on the web site is free, I hope you take advantage of the valuable information he shares in his books and on the web site.


Saturday, May 19, 2012

June 2012 Astrological Calendar - Transits for NY NY, The NYSE

Astrology calendar showing the day and times of planetary aspects for the NYSE, for the month of June 2012.

Planetary aspects for the NYSE, for the month of June 2012.


Click image to view full size calendar.

June 2012 Astrological Calendar - Transits for London, England, The FTSE

Astrological Calendar showing the day and times of planetary aspects for the FTSE, for the month of June, 2012.

June 2012 Astrological Calendar - Transits for London, England, The FTSE


Click image to view full size calendar.

June 2012 Astrological Calendar - Transits for Sydney, Australia, The ASX

Astrology calendar showing the day and times of planetary aspects for the ASX, for the month of June 2012
Astrological Calendar for planetary aspects for the ASX, June 2012.


Click image to view full size calendar

Monday, May 14, 2012

A look at the Venus Retrograde Effect


Last week, I sent out the New Moon newsletter early because of the upcoming Venus Retrograde station.  In the newsletter I said:   "May 15 - Venus turns retrograde for 33 days. The markets enter an ever- changing environment of unpredictability. Since Venus rules money, it is possible that the Federal Reserve Board goes back and forth on decisions made and revisits and reevaluates past polices. When monetary policy changes occur one should not be surprised to see reversals in interest rates, currencies, and the stock market. Venus Rx coincides with reversals when there is a cycle crest due, or a trough due. Have firm stops in place - this is an extremely volatile time in the market! 
Randall Ashbourne, an associate of Astrological Investing,  posts a weekly market report on his web site, theidiotandthemoon.com This weekend he posted charts which are revealing illustrations of exactly what has occurred in the past during Venus Rx coinciding with a Sun-Jupiter conjunction.   In the following report from Mr. Ashbourne's Eye of RA Weekly Market Report, Week beginning May 14, 2012, he discusses how statistically the chance of a significant trend change is higher than normal, considering not only Venus Retrograde, but the May 13 Jupiter- Sun conjunction in Taurus.   Astrological events will be extremely important for the markets this coming week, so with his permission, I am posting...

The chances of a significant trend change nearby are much - MUCH - higher than normal. That's not a guarantee, but it is a statistical imperative we shouldn't ignore out-of-hand.
I realise that, often, "show me" works a lot better than "tell me" - and in a few moments I'll do just that and your brain can draw its own conclusions.

The coming week is one of this year's extreme high energy zones in terms of astrological impacts. This week kicks off with the Sun conjuncting Jupiter in the sign of Taurus.  Mercury and Mars will make a Grand Trine with Pluto.  It is the statistically positive period between the 3Q and New Moon. 
(Read Randall's article, The Moods of the Moon)

But the most significant event of the week is that Venus turns retrograde. It's an optical illusion; when viewed from the Earth, the planet appears to be going backwards.

Yeah, yeah ... we all know that couldn't possibly have any impact at all on stock markets, gold prices, currency swaps etc.

It's Spooky Stuff.  Just like the ASX200 and the FTSE halted last week's declines pretty much exactly at price lines worked out from the position of Saturn in the sky.  You can check that out on the charts in a little while.

Okay, so the Bears are growling, happily slurping up the honey from their Shorts and looking forward to making lots more as the dive continues.

Last weekend, I made a couple of comments ... that "from a purely technical reading it sure looks like the Chicken Little roadshow is back in the Big Apple" ... and also that "The problem, as I see it, for a resumption of the Bear trend is the Sun's approach to a conjunction with Jupiter."

So, let's review the state of the markets and try to work out which is more likely to play out this week - more of the Chicken, or a Bullish revival.

We'll begin by looking at the lunar phases, since we are now in the Quarter phase leading up to the statistical high timeframe of a New Moon ... and this New Moon will be a Solar Eclipse in very early Gemini, one of the two signs which can spark wide-range price moves.


Here we have the New Moon-Full Moon chart for Pollyanna, the SP500. (click chart to view larger image) 

New Moons are solid red bars (prices should fall or flatline from that point) ... Full Moons are solid blue bars (prices have a statistical tendency to rise after the Full Moon).

Okay, we're between a blue and a red. Since the spike Low last August, there have been only 3 occasions when Pollyanna prices have been lower at the red bar than they were at the preceding blue bar.

There is only one red bar which came in at a Low. In every other instance, there was a distinct tendency for prices to rise in the few days immediately leading into a New Moon red bar.

To be blunt, it is statistically a bad bet to be Short the market in the week before a New Moon.

Okay, so that's the first part of this weekend's "show me" exercise.  


Now we're going to turn our attention to the Venus Retrograde effect.This is an astrological event which has the power to turn markets on their head! (Click chart to view larger image)

Now, it's not always the case ... but, as I said earlier, it's a statistical imperative we shouldn't lightly dismiss. This chart is an SP500 Weekly going back to the late 90s and the red bars are the weeks in which Venus went Retrograde.

THE Low of two Bear markets ... and the almost-final High of the 2007 Bull market.
Okay, so the coming week is going to have one of those solid red Venus Rx bars ... but it's also going to coincide with the Sun conjunct Jupiter aspect.

As I've indicated a couple of times in the past few weeks, this is another one of those astrological aspects that has a very high historical tendency to move markets. 

In this chart, the annual Sun conjunct Jupiter weeks are marked with the solid blue bars.

Now here is a monthly chart of the Dow Jones Industrial Average spanning from the early 50s into the 1980s ... showing what happened in the months after the Sun met up with Jupiter, or Venus went Retrograde. (click chart to view larger image)

Both of these aspects have a distinct tendency to be in effect as markets are making important trend changes.  And this week, we get both of them together.


Okay, let's take a quick look at how things went last week. (click chart to view larger image)
 Last weekend, I posted a Bi-BB weekly for Pollyanna ... a technical system outlined in the book and which can be used profitably without relying in any way on The Spooky Stuff. I indicated last weekend it provided alternative weekly price targets for the 500 - and the middle band was then priced at 1350.28

Polly's Low for the week was 1343 ... so 1350 was a pretty good target to aim for.  
 

I mention this merely to emphasise that simple not only works, it actually works great. You do NOT need expensive software and complicated techniques to be able to trade reliably, safely and successfully.

The next couple of charts are the Weekly Planets for the FTSE and the ASX200 and need no explanation. (click charts to view larger image) 


Both indices hit weekly price targets and have bounced - and if you consult the Canary on the FTSE daily, you'll notice some positive divergence between the oscillator and the price behaviour. (Read Randall's eBook titled, The Idiot and The Moon for complete information on his trading tools, "the Canaries" and the oscillators he recommends using.)
 
I'd thought the high astro energy this coming week might produce a secondary High in the markets - and I guess that's still possible.

As you can see from past performance, there's a tendency for Venus Rx and Sun/Jupiter to be present at either High OR Low points.

Whichever one it turns out to be, the odds are it will set the tone for the months to come
Safe trading - RA


(Disclaimer: Randall Ashbourne's report is not advice or a recommendation to trade stocks; it is merely educational material.)

Sunday, May 13, 2012

Venus retrograde orb showing an effect

It is clear that the orb of the Venus retrograde station is showing an effect. On Thursday the big news reported was of how an overconfident J.P. Morgan trader Bruno Iksil - whose very fitting Neptune in Pisces nickname, "The London Whale" - made an ill-fated attempt to hedge derivatives.

What? Derivatives - AGAIN?!?!? No doubt this will call for stricter regulation of Wall Street and will complicate the efforts of banks to fight certain regulatory changes.

Thursday, May 10, 2012

Heads Up! Venus Rx May 15

Venus goes retrograde on May 15, five days before the new Moon Solar Eclipse.  Venus going retrograde often coincides with a market reversal when a cycle crest or tough is due.   

The markets have entered an ever- changing climate of unpredictability now as the impact of  the station of Venus retrograde begins to have an affect. On the day of Venus retrograde world markets will be extremely volatile.

Since Venus rules money,  don't be caught by surprise if the  Federal Reserve Board goes back and forth on decisions made.  World leaders and global banks will revisit and reevaluate past polices. When monetary policy changes occur one should not be surprised to see reversals in interest rates, currencies, and the stock market.  
 Venus rules values, and when retrograde it is not the best time for mergers, acquisitions, new business partnerships, social events, and weddings.  Nor is it a good time to purchase high ticket items.


In the market Venus Rx coincides with reversals.    Have firm stops in place - this is an extremely volatile time in the market!


June 5/6 - Transiting Venus crosses over the face of the Sun!More than a century will elapse before the next transit in 2117. You might want to go outside and have a look!  After that, there will not be another Venus transit crossing the Sun until 2117 (December 11).