Sunday, July 29, 2012

Why would the Fed goose markets now?

Randall Ashbourne, an associate of Astrological Investing, posts a weekly market report on his web site, theidiotandthemoon.com The following is this weekend's Eye of RA report: Week beginning July 30, 2012
The strange disconnect between Wall Street and most other major world indices continues.

Last week's two-day surge raised the SP500 and DJI back within the range of the two most significant bubble tops in modern history. Yet, the Street is convinced that in the coming week, both the FOMC and the ECB will announce new stimulus measures.

Astrologically, the main aspects in play over the coming week fall into the "beneficial" category - the Sun trines Uranus and sextiles Jupiter and Venus will trine Saturn.

It also brings us up on a major Bradley Model turn window - and is halfway through the Mercury Retrograde cycle, where spurt-and-reverse tendencies come into effect.

I'll update the Mercury and Bradley charts in a few minutes.

It's interesting that the freefall in the early part of the week was suddenly reversed by Mario Draghi promising to do "whatever it takes" to backstop the Euro - and, more broadly, the whole European financial system. It is very much a modern banker's solution and is probably no surprise coming from a former Goldmans executive.

But, usually, statements made and policies outlined while Mercury is Rx, tend to have to be revisited once the planet resumes Direct motion.

In any case, one wonders exactly why the US Federal Reserve, in particular, would act now with further monetary easing.


click for larger image

The chart above is a monthly of the SP500, showing the 1999-2000 and 2007 "bubble" tops - the peak of the Nasdaq boom and the height of the CDO madness. Last week's spurt put the index back into bubble territory ... and the "logic" on the streets is now not so much that the good times will roll forever, it's that economies are so bad, central banks will print more money.

It seems like a strange place for central banks to prop up the stock markets. Logic would seem to dictate they don't actually need to prop up markets already back in Bubbleville.

The red, intermediate-range oscillator displayed negative divergence at the last price peak and seems set to give another instance of it. However, the state of the long-range (blue) oscillator confirmed that previous peak - what I pointed out earlier in the year as being the elephant in the room which indicated the rally would run longer-and-stronger that the astrological expectations forecast.

click for larger image
 An update of the Bradley Model chart is next, showing the spurt higher into the next major turn date predicted to occur in this timeframe, before markets go into a series of waterfall declines.

And a couple of weekends ago, I showed you the tendency of the 500 to do a spurt-and-reverse act during those periods when Mercury goes Retrograde - remarking the index has a tendency to travel within defined Mercurial corridors.
click for larger image

Last week, the index bottomed with a touch of the downside level of the current corridor, before bouncing strongly over Thursday and Friday to hit the top of the range. Breakout from that corridor, would target the dotted Mercury line in the early 1400s.

click for larger image

And that price level is also highlighted on the 500's long-range planetary price chart, above.


click for larger image
 Probably the key technical price level to watch is $1391, which is the last low before the high, and normally produces a strong reversal the first time it's touched again. I've mentioned recently the tendency of the 500 to move in divisions of 30-day cycles. The next "timing" in that cycle arrives on Tuesday.

click for larger image

Last weekend, I indicated the ASX200 was running into a downtrending Sun line that was likely to have an impact - the reverse of the rising Sun line chart we've followed for several weeks on the FTSE. The expected impact did have an effect in sending the 200 south for the first part of the week before the Draghi bounce. It looks as if she will yet make at least a kissy/smoochy with the grey Neptune line after all.

The next chart is a weekly of the ASX200, showing the target levels in Fibonacci levels, rather than planetary prices.

click for larger image

Turning to the FTSE ...

click for larger image

Before showing the ASX about to fall under the influence of a falling Sun line last weekend, I also remarked we had seen the first close below the rising Sun line on the FTSE planets chart we'd been looking at since early June.

The index dropped dramatically down to the horizontal planetary levels which have been shown many times on the FTSE's Weekly Planets chart - proving yet again those weekly planet charts provide excellent Entry and Exit levels for short and medium trades.
Safe trading - RA
Randall Ashbourne
Astrological Investing's associate, Randall Ashbourne, author of the eBook, The Idiot and The Moon, writes a free weekly column titled, The Eye of Ra on his web site in  which he explains the potential impact of astrological aspects and the current state of technical conditions. Ashbourne's charts are revealing illustrations of exactly what has occurred in the market and the probability of what to expect.
Important reading:  Randall Ashbourne's article, Jupiter's cycle and its effects on Wall Street and a posting of the weekly Eye of Ra report in this blog, titled A look at the Venus Retrograde effect
(Disclaimer: This article is not advice or a recommendation to trade stocks; it is merely educational material.)
Copyright: Randall Ashbourne - 2011-2012

Friday, July 20, 2012

August 2012 Astrological Calendar - Transits for NY NY, The NYSE

Astrology calendar showing the day and times of planetary aspects for the NYSE, for the month of August 2012.

Astrological Calendar with Transits for NY NY, The NYSE August 2012


Click image to view full size calendar.

August 2012 Astrological Calendar - Transits for London, England, The FTSE

Astrological Calendar showing the day and times of planetary aspects for the FTSE, for the month of  August, 2012.

August 2012 Astrological Calendar - Transits for London, England, The FTSE


Click image to view full size calendar.

August 2012 Astrological Calendar - Transits for Sydney, Australia, The ASX

Astrology calendar showing the day and times of planetary aspects for the ASX, for the month of August 2012
Astrological Calendar for planetary aspects for the ASX, August 2012


Click image to view full size calendar

Wednesday, July 18, 2012

The New Moon in Cancer

Astrological Investing New Moon forecasts show general trends and financial outlook for the month
Cancer New Moon, July 19, 2012, NY, NY
Summer is here and it is hot, hot, hot - unless you live in the UK where it is cloudy and wet, wet, wet! Global weather certainly has seen it's extremes, and this will continue throughout the summer season.

In the Summer Solstice article (click to read) Uranus is in the fourth house of the chart suggesting the unusual, disruptive, destructive weather we have been having. "One never really can predict Uranus energy as it represents
what is unexpected - Earthquakes, floods, tornadoes, hurricanes, and loss of electricity due to the unusual weather are possible."   
We have had it all!

The New Moon in Cancer, July 19- Chart from the point of view of Wall Street and the NYSE.- The New Moon brings out The Courageous and The Optimists... again!

Mars in the sixth house trine Jupiter in the 2nd - One can't help but believe these risk takers are walking a tight rope. Mars is involved in a T-square with Uranus and Pluto.

Alone, Mars in opposition to Uranus has received a bad reputation, but involve Pluto and it certainly has the
potential to live up to it! Read Randall Ashbourne's recent Eye of Ra Report where he discusses "Back testing the Mars-Uranus crash " (Read Week beginning July 9, 2012)

An Astrological Trip Around the New Moon in Cancer Chart
New Moon in the 4th house, unaspected. In fact, six planets in this chart are not involved in a major transiting planetary aspect. It's not unusual to have a few planets unaspected in these mundane charts - because one needs to consider only close waxing aspects - however, this month there is more than usual.

Unaspected planets are free to act with pure archetypical energy, unfiltered and unaffected by the other planets.  But because they lack dynamic energy prompted by hard aspects, or have the grace of easy aspects it's hard to predict if they will act at all.

The New Moon is near the last degrees of Cancer and the Moon goes void of course after making the conjunction with the Cancer Sun. The market really doesn't know what to expect this month - is the Fed going to offer QE3 or not?  Will the European banks ease again? What is happening in Asia? Looking at technical charts appearing somewhat positive while the world’s economies appear in trouble, we are not really ready to trust this market.

In Mundane Astrology the New Moon in the fourth house is considered favorable for land and real estate, and good for crops; generally favorable for the opposing party in government, and unfavorable for the current government in power.

Venus, ruler of the Taurus rising chart, is in the 2nd house along with Jupiter. But not closely involved with other planets either! The waning conjunction with Jupiter and waning trine to Mars are aspects that have happened before the new Moon, and not worth considering after the fact.

However, Venus in the second house is a favorable position, so this New Moon has the potential to live up to the New Moon Promise of a temporary high at the time of the New Moon relative to the direction the market is trending.  (Read Randall Ashbourne's article, The Moods of the Moon - Trading the Mood Swings of the Monthly Lunar Cycle

Mercury is Retrograde in the fifth house - Again, here we have a planet not involved in any major aspects! No news is good news? REally??? The stationing retrograde has occurred on the 15th. (Read the HEAD'S UP section below)

Mars in the sixth house - Opposing Uranus in the twelfth house and Square Pluto in the ninth
Pluto square Uranus is THE most significant and dominating aspect of the summer. Mars is setting this aspect off with an opposition from the sixth house. With Uranus we can expect only the unexpected - if we can manage that! Uranus traveling through a veiled and mysterious space in the chart, the twelfth house suggests hospitals, charitable institutions, and prisons are the areas that may be highlighted. With Pluto in Capricorn we can pretty much be assured the unexpected events will have something to do with money, debt, and world governments.

Saturn in the sixth house - the waning square with the Moon and Sun has past - Frustrated trade union workers and unacceptable unemployment numbers... the health of the economy and the bleak job picture is a serious concern. Where are the jobs? The Supreme Court has upheld the Affordable Health Care Act, but many wonder "is it really affordable?" The US election has become a referendum on the health of the economy and Obama's signature legislative act.

Neptune in the eleventh house - Yet ANOTHER planet not in aspect with another planet in the chart! There isn't much possibility of the legislative body in government getting anything done.

***
Commentary - Reading a mundane horoscope for the lunar month gives us a broad picture of the astrological landscape we expect to encounter during the month. Astrological energy affects the market, however, astrology is a timing tool to use - knowing the potential of planetary cycles and what the technical charts tell us is our best bet for successful trading. We need to see the whole picture.

Randall Ashbourne's charts are revealing illustrations of exactly what has occurred in the market and the
probability of what to expect - Each weekend, my associate, Randall Ashbourne writes a stock market forecast in his Eye of Ra Report on his web site, http://www.theidiotandthemoon.com/. The information on the web site is free, I hope you take advantage of the valuable information he shares in his books and on the web site.

My bad - Last month I alerted ya'll to Neptune square Jupiter on June 25 I said, "In all probability there will be higher fuel prices and an increase in demand for crude oil. The zodiac sign Pisces, and the planets Jupiter and Neptune all have "rulership" over crude oil in modern astrology. A square aspect suggests either an increased demand or an decrease in supply of what the planets rule. Considering the Uranus square Pluto aspect on the 24th and the current world's political atmosphere, prepare for higher fuel prices." I was wrong - prices went lower.

However, I am correct about the square aspect with Jupiter. A Jupiter square does promise either an increase in demand and/or decrease in supply of what the planets and signs signify. In this case, with both Jupiter and Neptune ruling oil, it is the oil industry. Supply has become greater than demand because of a weak world economy. I was considering the world's political atmosphere in my prediction and didn't factor in the condition of a weak global economy. This is a case of the astrology being right, but the astrologer missing the mark.

***
Moon Phases (for our subscribers who trade using phases of the Moon) New Moon July 19 - 1st quarter Moon, July 26; Full Moon, Aug. 1; Last quarter Moon, Aug. 9; Next New Moon, Aug. 17.

HEADS UP! - Critical Astrological Transits this Lunar Month -  Read the Heads Up section of this report in it's entirety at www.astrologicalinvesting.com/html/newsletter.html


The New Moon forecast does do not get posted until the day of the New Moon. The next New Moon will be: New Moon in Leo, August 17, 2012.    

Subscribe to our newsletter if you would like to receive the next forecast before the next New Moon.  Announcements are delivered along with the Astrological Investing New Moon Newsletter before the new moon is posted to the web site and the blog. Click to subscribe to the newsletter.


Safe Trading!  Marley


Sunday, July 15, 2012

Analysing the risk of a high speed U-turn

Randall Ashbourne, an associate of Astrological Investing, posts a weekly market report on his web site, theidiotandthemoon.com The following is this weekend's Eye of RA report: Week beginning July 16, 2012


Analysing the risk of a high speed U-turn

 High volatility is likely to continue in world stock markets over the next week ... with a higher-than-normal risk of a severe U-turn developing into the end of the month.

This weekend, we will examine the tendency of markets to go into a spurt-and-reverse cycle when the boy messenger of the Old Gods goes Rx. The retrograde movement of planets is an optical illusion. They never actually reverse course.

However, when viewed from the Earth, they sometimes seem to go backwards ... and as ancient astrologers watched the waltz of the planets, they added nuances to the symbolism of their interpretations. For example, if you happen to have Saturn Rx in your birth chart, there's a very, very strong chance your father will "go missing" by the time you reach your early teens.

Oh, I know that has nothing to do with financial astrology! But then, we both know you don't come peeking into the fortune teller's tent just to hear me waffle on about the dead Italian guy or whether the Canaries are croaking.

So, we're going to begin this week with a little look at The Trickster ... Mercury in Rx mode.

Let me start with some background.  The late Kaye Shinker, who was kind enough to review The Idiot and The Moon when I published it online a year ago, made a specific study of the Merc Rx impact on the Dow Jones Industrials and came to the conclusion that most of the time, the Dow would end the Merc Rx period with price within 1% of where it started the cycle.

To put this simply ... on August 8, the price of the DJI should be within 1% of where it closed last week.

Ray Merriman, the guru of financial astrologers, has noted a tendency for stock markets to start a move at the Rx date and then reverse course halfway through the cycle; which is just a variation on Kaye's findings.

Now, I guess if I were an American, I'd probably be from Missouri; IF my memory serves me correctly, that's the "don't tell me, SHOW me" State.

So, I'll show you.
click for larger image
There's a lot to absorb from the chart above, but firstly let me apologise for that irritating thick, pink vertical; it's a glitch in the software that occurs when a planet enters Aries. Please try to ignore it.

Okay, so this is a daily chart of the SP500 and it's obvious the index has a general tendency to travel within Mercurial corridors and finds either Support or Resistance when it meets up with the planetary price lines.

The retrograde periods begin when the pink lines stop rising and start dropping for a few weeks, before resuming their upward direction ... which is the shift from Rx to Direct again.

I've inserted black verticals at both the Rx and Direct dates. If you look closely at the three most recent instances, it's fairly easy to see what Kaye and Ray talked about. In the first example to the left of the chart, the index was dropping already, but continued the drop before bouncing roughly halfway through. By the time of the second black line for that cycle, price had climbed back very near to the bar marked by the very first black vertical.

In the second instance, the Merc Rx date produced a strong rebound ... changed direction about halfway through ... and then began climbing again after Mercury Direct.

The effect isn't quite as obvious in the third instance, but it is true that the price of the index at the second black line of the cycle was pretty damn close to where it was at the first vertical.

So, what does it all portend, eh? Well, as I said earlier ... a higher-than-normal chance of a spurt-and-reverse ... either a rally or a decline which goes high-speed into a U-turn halfway through the cycle, which means around July 27.

Okay, so that's the "show me" part. Now let me deal with some other astrological stuff about Mercury Rx. Some astrologers warn against trading during this period; others will tell you that the technical read-outs will give an abnormal number of "false" signals. I'm not one of them.

Mercury goes Rx for a few weeks at a time three or four times a year. I don't know about you, but I think life is too short to spend a quarter of the year sitting on your butt worrying and doing nothing because some pissant rock appears to be going backwards.

My real-life experience of Mercury Rx is this ... YOU make mistakes. And, usually, because you're not concentrating. I've learned over the years that the worst that happens is that I occasionally hit the bloody Buy button when I meant to hit the Sell. So, double-check everything you do for the next few weeks and make sure you actually did what you intended to do. And the chances are you'll get through the cycle totally unscathed.

Now, I guess I could tell you that's the end of The Spooky Stuff for this week ... but ... cue the X Files theme music, please ...
click for larger image
Yes ... it's the FTSE ... and yet another bounce from contact with the rising Sun line!! Spooky, indeed. How long will it last? GeeZeus, why are you asking me?! Okay, we're starting to get increasing fade-out in the state of the green and red Canaries - the green one is short-term and the red is intermediate. The yellow bird, the long-range, is still okay. But, the internal strength of the rally is starting to wane. That's the only daily we'll be looking at this week because I want to have a look at the big picture, especially with the high volatility implied by the Mercury Rx cycle and the Mars-Uranus potential for a crash cycle we went into last weekend.
click for larger image
The chart above is a monthly Gann for the FTSE. She lost the primary Gann angle on a closing basis in May, but has regained it, though June ... and July so far ... have failed to recapture the totality of the earlier losses.
click for larger image
Turning our attention again to Pollyanna, the SP500, it has also failed to recapture the earlier losses. It is playing by the Bi-BB rules outlined in The Technical Section of the book. I draw your attention to the three instances of negative divergence in the height of the fast MACD histograms, compounded at the price high by a lower peak in the MACD signal lines. The climate grows increasingly toxic, despite the hopes of a QE3 bailout from Ben.
click for larger image
Last week's decline stopped on contact with the 1325 long-range Node target and bounced back to finish near the Pluto line at 1358.
click for larger image
The ASX 200 has recovered about two-tenths-of-bugger-all of the May plunge. The extremely small range consolidation over June and July-to-date is either extremely Bullish or unbelievably Bearish. I have a very strong leaning towards the latter scenario. The depth of the long-range Canary plunge last August and the index's extremely weak recovery ... in an economy supposed to be one of the strongest in the Western world ... suggest things could get really ugly, really fast.
click for larger image
I've mentioned a couple of times recently the importance of the 50% retracement levels. The blue Fibonacci lines are the range of the 2007-2009 plunge and the red ones are the Rx levels for the 2009-2010 recovery rally. As y'can see, the post-plunge recovery stalled out at a 50% Rx ... and last week found Support at the 50% level of the smaller range. Okay, that's the show for this week, folks! At some stage, hopefully within the next week or so, I'll write a new piece for the Articles section of the site dealing with how to use The Idiot and a couple of really basic techie tools to trade intraday charts.
In the meantime ... Safe trading - RA
Randall Ashbourne
Astrological Investing's associate, Randall Ashbourne, author of the eBook, The Idiot and The Moon, writes a free weekly column titled, The Eye of Ra on his web site in  which he explains the potential impact of astrological aspects and the current state of technical conditions. Ashbourne's charts are revealing illustrations of exactly what has occurred in the market and the probability of what to expect.
Important reading:  Randall Ashbourne's article, Jupiter's cycle and its effects on Wall Street and a posting of the weekly Eye of Ra report in this blog, titled A look at the Venus Retrograde effect
(Disclaimer: This article is not advice or a recommendation to trade stocks; it is merely educational material.)
Copyright: Randall Ashbourne - 2011-2012

Wednesday, July 11, 2012

Backtesting the Mars-Uranus crash cycle

Randall Ashbourne, an associate of Astrological Investing, posts a weekly market report on his web site, theidiotandthemoon.com The following  is this weekend's Eye of RA report:    Week beginning July 9, 2012

There is a very famous American financial astrologer who makes dire predictions whenever Mars is about to make a harsh aspect with the old weirdo, Uranus. So, this weekend we're going to examine the historical reality of whether there really is a Mars-Uranus crash cycle, since we have the potential for one to develop in the next couple of weeks.

And we're also going to revisit some comments I made a month ago about Jupiter's sign change to Gemini shifting the money flows.

Overall, the high-energy days for the coming week are likely to be Thursday and Friday, when both Mercury and Uranus go Retrograde ... and the Sun moves in to square Saturn. But, it is the following week which is likely to be much more volatile as Mars, now in the Cardinal (action) sign of Libra, squares Pluto and opposes Uranus

The Sun square to Saturn, coupled with Uranus going Rx as it's fired up by Mars, do symbolise a major energy shift which has the capacity to turn markets and accelerate the moves.

But, before we get to that, I want to return to some comments I made about Jupiter changing signs to Gemini.

I said: "With Jupiter in Taurus, for example, the emphasis has been on banking and debt - the Taurus/Scorpio axis; and also on technology and gold, the Aquarius/Leo axis. I think most of you will agree that banks, brokers, Apple and gold have been the topics de jour for all the time the FatBoy has been in Taurus.

Slowly, you'll see a change; transportation, travel, health, labour and oil will begin to fill the news pages."So, this weekend we're going to examine the historical reality of whether there really is a Mars-Uranus crash cycle, since we have the potential for one to develop in the next couple of weeks.

Now, let me indulge in a little bit of basic astrology for those of you unfamiliar with the arcane details of The Spooky Stuff. Jupiter was head honcho of the Old Gods and is associated with all the good things - he expands whatever he touches.

So, while he was in Taurus and opposing Scorpio, the banks and debt got exaggerated ... and because the FatBoy was squaring the Leo/Aquarius axis, the effect also impacted on gold and the technology sector.

In early June, I indicated the emphasis would start to change. Gemini rules transportation and the media; Sagittarius rules foreign travel, universities and the law; Virgo is labour, accountancy, health; and Pisces rules oil, shipping, hospitals, prisons and (with Virgo), big pharmaceuticals.

The effect of Jupiter is to expand either the supply OR the demand. I really want to emphasise that point ... the supply OR the demand.
Several news reports caught my eye during the week.

NEW YORK - US stocks have racked up solid gains in a holiday-shortened trading session, boosted by reports of strong June sales from the leading US auto makers.

Data showing that car sales in Germany are resisting the eurozone crisis drove Frankfurt's DAX 30 index up 1.26 per cent to 6,578.21 points.

DETROIT - The Big Three US car manufacturers have reported strong domestic sales for June, capping a solid first half of the year even as US economic growth overall remained weak.

DETROIT, July 3 AP - General Motors Co said its US sales rose 16 per cent in June on solid demand for small and midsize cars.

PARIS - US aircraft maker Boeing has raised its 20-year forecast for global demand for airliners by $US500 billion ($A489.21 billion).

We've also been treated to plans by News Corporation to split itself into two divisions. And, there was a very interesting story about how a massive fleet of Chinese coastal shipping - somewhere between 1500 and 2000 cargo vessels - is now competing for traffic volume worldwide because trade between northern and southern China has declined massively.

So, this is an example of how it works. Jupiter in Gemini squares the sign of Pisces, which rules shipping, and the SUPPLY of ships suddenly becomes terribly exaggerated.

Jupiter opposes Sagittarius, the sign of foreign travel, and Boeing gears up for a big increase in DEMAND.

Jupiter enters Gemini, the transportation sector, and the DEMAND for new cars surges ... or the world's biggest media conglomerate splits into TWO (always a Gemini signature!).

I revisit this issue because a sign change by Jupiter is one of the more reliable astrological predictions ... the money flow WILL change to different sectors, either the supply OR the demand will escalate dramatically in those sectors ... and there are substantial profits to be made by getting out of the former and piling into the latter.

So, it could prove to be worthwhile to look at the technical state of the charts for car manufacturers and transport companies (including railroads), big pharmaceutical companies, oil companies, media stocks, airlines ... and any companies associated with supplying services to either them, or hospitals, prisons etc.

***
Okay, now let's turn our attention to whether or not there really is a RELIABLE Mars-Uranus crash cycle. We'll concentrate purely on the opposition aspect, since that's the one due to become exact in the next couple of weeks. I do need to emphasise that this next one occurs with a simultaneous square to Pluto, so is more likely than usual to have an impact, especially since all three planets are in the early degrees of Cardinal signs.

We will begin by examining the impact on the SP500 in recent years.
Mars opp Uranus
click for larger image
We're looking at a weekly chart of the Pollyanna index and the Mars opposed Uranus aspects are marked with red bars. And it's immediately obvious that the aspect does NOT necessarily provoke a market crash. Of the seven instances marked on the chart, only two turned up near important Highs. Four of them occurred nearby important Lows.
What gets some astrologers overly-excited, is that it was one of the aspects in effect at the start of the Great Crash.
click for larger image

The chart above shows the Dow Jones Industrials from the late 1920s to early 1970s - and one can see why the arrival of Mars opposed to Uranus sets the alarm bells ringing. The aspect does have an overall tendency to occur very nearby the start of some very bad crash cycles.

But, it's not a certainty, as we can see in the chart below, which covers the Great Sideways Shuffle period in the DJIA from the early 60s to early 80s.

DJIA 1960's
click for larger image
Okay, it's almost time to stop waffling on about les Spookies and turn our attention to the techie charts. The point I wanted to make is that astrology does have its uses. There are some things it is very good at predicting reliably - which is the sector shift caused by Jupiter changing signs.

And there are other things which get some astrologers very, very excited ... but which are a tendency, rather than a reliable certainty.

At the risk of boring you all silly, I will repeat the mantra again ... Astrological expectations do NOT over-ride technical conditions!
GSPC-Weekly EOD
click for larger image
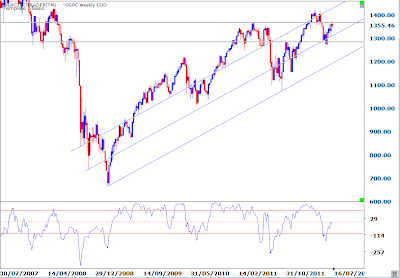
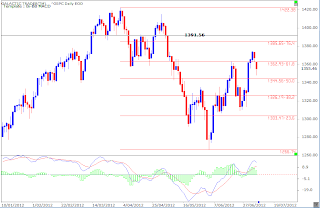
As I said last week, there are only two really important horizontal lines of Support/Resistance for the 500 ... and, GeeGolly, looks like they continue to be important, eh?


And we've been discussing this one, too, for the past few weeks - expecting she'd face some hurdles at the 1340s and 1360s. We have some relatively mild divergence showing up at last week's pre-holiday peak in the height of the MACD histograms ... and the potential is showing on the earlier weekly chart for the intermediate-range Canary to be turned down from a hit of the Zero line.
Support/Resistance SPX
click for larger image

Let's go to London's FTSE.

click for larger image
I introduced this chart a few weeks ago to show the potential for a the index to launch a rally from contact with the rising (diagonal) Sun lines ... but I'd like you to compare the planetary chart with the technical one below.
And the reason is I want to emphasise to those of you on a budget that you don't need really fancy software. In the chart below, the bounce came from a hand-drawn trendline, which then allowed us to set up some Fibonacci Retracement targets. Targets which have worked very well!

click for larger image
All of this comes back to the point that trading profitably does NOT have to be terribly difficult. WE make it difficult by clogging our brains with crap. Simple works! Simple works really bloody well. Shut out the noise ... pay attention to the simple charts you've drawn for yourself ... watch for divergence in the oscillators when Price is hitting predetermined levels of Support or Resistance.

I'll leave you once again with Auntie's Weekly Planets chart for the ASX 200.

click for larger image

Safe trading - RA

Randall Ashbourne
Astrological Investing's associate, Randall Ashbourne, author of the eBook, The Idiot and The Moon, writes a free weekly column titled, The Eye of Ra on his web site in  which he explains the potential impact of astrological aspects and the current state of technical conditions. Ashbourne's charts are revealing illustrations of exactly what has occurred in the market and the probability of what to expect.
Important reading:  Randall Ashbourne's article, Jupiter's cycle and its effects on Wall Street and a posting of the weekly Eye of Ra report in this blog, titled A look at the Venus Retrograde effect


(Disclaimer: This article is not advice or a recommendation to trade stocks; it is merely educational material.)
Copyright: Randall Ashbourne - 2011-2012


Wednesday, June 20, 2012

July 2012 Astrological Calendar - Transits for NY NY, The NYSE

Astrology calendar showing the day and times of planetary aspects for the NYSE, for the month of July 2012.

Astrological Calendar with Transits for NY NY, The NYSE July 2012


Click image to view full size calendar.

July 2012 Astrological Calendar - Transits for London, England, The FTSE

Astrological Calendar showing the day and times of planetary aspects for the FTSE, for the month of July, 2012.
July 2012 Astrological Calendar - Transits for London, England, The FTSE


Click image to view full size calendar.

July 2012 Astrological Calendar - Transits for Sydney, Australia, The ASX

Astrological Calendar for planetary aspects for the ASX, July 2012
Astrology calendar showing the day and times of planetary aspects for the ASX, for the month of  July 2012


Click image to view full size calendar

Monday, June 18, 2012

A Second New Moon in Gemini !

Astrological Investing New Moon forecasts show general trends and financial outlook for the month
 Chart from the point of view of Wall Street and the NYSE.
 New Moon in Gemini, June 19- Chart from the point of view of Wall Street and the NYSE.

A second new Moon in Gemini? Yes, here we are at the second new Moon in Gemini this year. As I stated in the last New Moon Newsletter, two new Moons doesn't happen often in the sign of the twins, or any of the signs. Only when a new Moon is at the very earliest degree of a sign can it happen. The Moon's cycle is 28 1/2 days.
So... how did the solar eclipse of May 20 and the full Moon eclipse of June 4 work out for you?
Remember, the influence of an eclipse is long lasting! The influence of eclipse energy can dramatically reappear as transiting planets aspect the degree of the eclipse and other planetary positions in the eclipse chart.

Watch for planets transiting 0° and 14 °mutable - Mars will often reactivate the energy of an eclipse. These eclipses took place in Gemini, so watch Mercury transits as well.
Stocks that have first trade or IPO charts with planets within 5 degrees of 0° and 14° in mutable signs. (Gemini, Virgo, Sagittarius and Pisces) are under the influence of these eclipses.

I mentioned in the last newsletter that the IPO chart of Verizon (VZ) has Jupiter at 0° Gemini.   VZ is in the "Gemini Sector" (governed by Gemini and the planet Mercury) VZ has a very promising year as Jupiter transits Gemini.

If you are interested in obtaining all the data for first trade charts and incorporation charts of Dow Jones Industrials charts, click here.  

An Astrological Trip Around the New Moon in Gemini Chart
Note: New Moon periods tend to be a positive time for the markets, often coinciding with temporary highs relative to the direction the market is trending.  There are many of you who have been trading with the phases of the Moon and having much success; and you know by reading Randall's The Idiot and the Moon that there are times when it doesn't always work out that way! (Read Randall Ashbourne's article, The Moods of the Moon - Trading the Mood Swings of the Monthly Lunar Cycle   be sure to purchase his eBook, The Idiot and the Moon )

The New Moon brings out The Courageous and The Optimists!
Mars in the first house, waxing sextile to chart ruler, Mercury, and Jupiter conjunct the Mid Heaven
- This aspect, along with Venus, and the new Moon transiting the 10th house (Jupiter makes a conjunction to the mid heaven at the time of the new Moon)  is going to bring out the courageous and the optimists!
IF you are a risk taker, then you may very well may get your kicks taking a long position in the SP 500 right in the third quarter Moon period and up to the new Moon this lunar month. 
HOWEVER! This is definitely NOT a time to be long in the market if you are faint of heart!!!  And why I said if you are a risk taker, you very well may get your kicks being long in the market on the new Moon. Warning - the Mars aspect is waxing, and the angles of the chart move swiftly. Have an exit strategy!
Saturn in the second house applying in a hard aspect with new Moon chart ruler, Mercury - This is an indicator of dire economic news.  Earnings reports may disappoint, or if not, they may be overshadowed by European economic and political news.

Pluto in the fifth house square Uranus in the eighth house - THE MOST significant and dominating aspect in the chart! This is the first of a series of waxing squares between Uranus and Pluto during 2012 - March 2015.  According to Raymond Merriman in his book, Forecast 2012, "..this is the most challenging time for world leaders to resolve their economic and political crises.." (Read the Heads Up section on the web site in the New Moon Newsletter where I discuss Pluto square Uranus further.)

Neptune in the sixth house - Trade unions and workers are the focus both here and abroad. Unacceptable unemployment numbers and the health of the economy take a toll in the markets.

Venus and the new Moon in the tenth house, Jupiter conjunct MC - A promising new Moon, but fleeting. Be careful with Uranus square Pluto and the upcoming Neptune square Jupiter aspect. (discussed on web site in the New Moon Newsletter, Head's Up!)

Mercury in the eleventh house square Saturn - Discussions of new restrictive regulations on business create uncertainty in the market.

Commentary by Marlene Pfeifle

Knowing how astrology actually coincides with market cycles and the market trend will help you become more profitable in the market - much more so than a reading of transits in a mundane horoscope. Knowing what the outlook for the lunar month gives one a broad picture of the potential astrological energy that can affect the market, however, knowing both astrology and technical aspects is your best bet for successful trading.  Remember the old adage, "the trend is your friend".

Randall Ashbourne's charts are revealing illustrations of exactly what has occurred in the market and the probability of what to expect -  Each weekend, my associate, Randall Ashbourne writes a stock market forecast in his Eye of Ra Report on his web site, http://www.theidiotandthemoon.com/.  The information on the web site is free, I hope you take advantage of the valuable information he shares in his books and on the web site.

Important reading: Read Randall Ashbourne's article, Jupiter's cycle and its effects on Wall Street and in his archives, the weekly Eye of Ra report, titled A look at the Venus Retrograde effect, Week beginning May 14, 2012

Moon phases (for our subscribers who trade using phases of the Moon)
New Moon June 19 - 1st quarter Moon, June 26;  Full Moon, July 3;  Last quarter Moon, July 10;   Next New Moon, July 18.  (Read Randall Ashbourne's article, The Moods of the Moon - Trading the Mood Swings of the Monthly Lunar Cycle)  

Safe Trading! Marley

Read the entire New Moon Newsletter on the web site at www.astrologicalinvesting.com/html/newsletter.html
 Read HEADS UP! - A Critical Astrological Period, June 20 through 30th - Upcoming astrological events included in the newsletter. 

Sunday, June 17, 2012

Solstice, June 20, 2012, Chart Analysis with discussion of Astrological Events

June 20, 2012, Summer Solstice, Washington D.C.
Summer Solstice, June 20, 2012
Chart for Washington, D.C. USA
The first day of summer in the Northern hemisphere
*June 20, 2012 is the Winter Solstice in the Southern hemisphere
by Marlene Pfeifle, CAP
Uranus square Pluto is the astrological theme for this chart and for the summer. The season begins with, and ends with, a repeat of the Uranus square Pluto aspect in September. (see exact dates in list above) This aspect is MOST significant not only because it is the closest planetary aspect by degree, but because of the implication of its meaning.

What it suggests in the Washington D.C. chart is a summer filled with demonstrations and demands from the people. It's an election year, and people want change and reform in government. (The first house represents the people. Pluto is the demand for transformation and reform - the fourth house Uranus, is the restless urge for reform in their government.)

Actually, they want change and reform NOW - and their demands will persist.
A square aspect is tense, dynamic energy pitting the nature of the planets and the signs they are in against each other to force an outcome. Uranus in Aries is bold, impatient, impulsive and rebellious in the quest for individual freedom; Pluto in Capricorn, like a dark version of the comic book superhero, Superman, will only accept "Truth, Justice, and the American Way". Pluto will expose corruption and eliminate whatever is necessary for a positive end result. However, Pluto in Capricorn DOESN'T want to "throw the baby out with the bath water" and likes to move slowly and deliberately with control, destroying what stands in its path, but resisting impulsive, impatient rebel rousing and "change just for change sake".
       Randall Ashbourne describes Uranus - Pluto energy in his Eye of Ra Report, "... "I mentioned last weekend the symbolism of the Uranus-Pluto square as being an Aries/Capricorn confrontation of aggressive rebellions against "the powers that be" ... and I discussed in (my) Forecast 2012 how this had started with the so-called Arab Spring uprisings, which would continue to spread as they have in Syria and Bahrain, but how the same sort of energy would also manifest in other parts of the world.

And it's fairly obvious almost everywhere. There are all sorts of power struggles going on in China. Dissidents are getting bolder. Greece is an obvious Western example, but so is the growing angst in Germany. In terribly polite Britain, Prime Ministers former and current, have been called into the public forum to explain their relationship with the Murdoch empire and whether policy was traded for publicity.

Uranus represents an energy which demands change, reform and radical restructuring of everything it considers "wrong". In Aries, the demands are aggressive and, if thwarted, will turn to direct action ... from taking over the streets to taking up arms.

Pluto represents great power and great wealth concentrated very narrowly. In Capricorn, it is very much all about control by the plutocrats. There are nuances between nations in exactly how it manifests. In some of the Arab nations, it's pretty easy to pick the dictators." - Eye of Ra report, week beginning June 18, 2012"
- Eye of Ra report, week beginning June 18, 2012
It will be an intense summer in which the political climate will match the heat of the summer!

In the USA, political parties will officially nominate their presidential candidates at conventions - the Republican National Convention, during week of August 27; the Democratic National convention, during the week of September 3, 2012. With Pluto and Uranus in cardinal signs, we can expect ruthless, negative campaigns and rowdy demonstrations.

June 24 - Uranus square Pluto at 8° Capricorn (exact) - This is the first of a series of waxing squares between Uranus and Pluto during 2012 - March 2015.
    According to Raymond Merriman in his book, Forecast 2012, "..this is the most challenging time for world leaders to resolve their economic and political crises. In such a venerable climate, Gold is apt to remain a safe haven. Investors and speculators will seek protection by diversifying their portfolios with precious metals. A time that stands out in 2012 is the last tens days of June."

Uranus in the fourth house suggests the possibility of unusual, disruptive, destructive weather.  One never really can predict Uranus energy as it represents what is unexpected.  Earthquakes, floods, tornadoes, hurricanes, and loss of electricity due to the unusual weather are possible. Have a first aid kit handy, along with plenty of batteries, and extra food and water supplies in case of emergency. Keep your fuel tank filled in case you need to evacuate quickly.

Uranus turns retrograde July 13 When Uranus turns retrograde, Kaye Shinker taught that for the markets "about 4 days before the exact retrograde Uranus reverses the market trend.  Following the Rx motion 80% of the time the markets creep up."(The Textbook for Financial Astrology)

Click here to read the rest of the upcoming astrological events and chart anaylsis by Marlene Pfeifle

Monday, June 11, 2012

Jupiter to Gemini ... the Big Sector Shift

Jupiter
The God Jupiter
Randall Ashbourne, an associate of Astrological Investing, posts a weekly market report on his web site, theidiotandthemoon.com The following  is this weekend's Eye of RA report:.

The head honcho of the heavens changes signs in the coming week, shifting the emphasis of money flows into the markets over the coming year.

According to ancient symbolism, Jupiter is weakened in Gemini. The Old God we associate with expansion … he whom I call the FatBoy … goes on a diet and expansion loses some weight.

It’s part of the rationale behind The Jupiter Cycle (see Articles); markets have an historical tendency to peak with Jupiter in Taurus and decline until Jupie enters Leo, a Fire sign which sparks him up again.

It also means the money flow starts to move more rapidly into different sectors. The late Kaye Shinker, from www.astrologicalinvesting.com and the author of several textbooks on financial astrology, researched this effect at some length.

With Jupiter in Taurus, for example, the emphasis has been on banking and debt – the Taurus/Scorpio axis; and also on technology and gold, the Aquarius/Leo axis. I think most of you will agree that banks, brokers, Apple and gold have been the topics du jour for all the time the FatBoy has been in Taurus.

Slowly, you’ll see a change; transportation, travel, health, labour and oil will begin to fill the news pages. It does not mean the bank problems are about to disappear. All of that will continue because of the longer-term Uranus square to Pluto … the Aries/Capricorn confrontation of aggressive rebellions against “the powers that be”.

There are a few other, more minor, astrological events also coming this week … the 3Q Moon, Mercury squaring Uranus and opposing Pluto (GeeZeus! Yet more bank blabber.) And the Sun will trine Saturn mid-week.

Still, it’s Jupie’s sign change that’s the big event and I needed to give you the heads-up on that so you can trawl through your sector charts and consider adjusting where you have your boodle invested.

Now let’s have a wander through some charts. Last weekend, I indicated markets had to “bottom now” or they were likely to continue crashing badly … and I showed a couple of FTSE charts to highlight the potential for the optimistic outcome, even though Lunar Eclipse Full Moons didn’t have a particularly reliable record of bringing in a bottom.

I confess I’d completely forgotten the English cousins were going to shut down for a bit of pomp. Not that it made any difference; the signals were there … and, as it happened, played out.
FTSE - Rising Sun Lines
click to view larger chart
We began last week with a chart showing the FTSE’s normal reaction to rising Sun lines and I said: ”The index has had a distinct tendency to attach itself to one of these rising Sun lines during almost all of its uptrends, even the ones which have been relatively short-lived.”

So, the cousins bounced back. Rather strongly. In fact, probably too much so. Pay special attention to the state of the red Canary in the oscillator panel. We’ve had a few of these strong spikes since last November’s Low … and in each case, they’ve caused Price to stop the rally temporarily and go into a sideways shuffle.

Often, the shuffle continued until Price again made contact with the rising Sun lines.
FTSE’s Weekly Planet Lines
click to view larger chart
We can see the strength of the two-day move more clearly by just how far it travelled on the FTSE’s Weekly Planets chart, above.

The planetary Price resistance around last week’s High is obvious on both of the above charts … as are the targets for either a confirmed breakout or breakdown.

Okay, so the potential for a return to optimism was heralded by the FTSE’s “normal” reaction to rising Sun lines … but the real question is whether the rally can be sustained for any length of time.
Let’s revisit the Lunar Eclipse Full Moon chart …
S&P 500 - Full Moons
click to view larger chart
 Last week was the 8th Lunar Eclipse Full Moon since the Bear bottom in 2009. The 1st and the 6th of them coincided with downtrend Lows … and now, maybe, another one.

But, to be a reliable Low, Miss Pollyanna – the SP500 – needs to make a solid weekly break above primary Node resistance around 1325.

S&P 500 - Weekly Planets
click to view larger chart

If you consult last weekend’s edition, you’ll see the first harmonic Node line is a real long-term barrier for Miss Polly.
And the long-term uptrend is now under threat.

Jupiter Cycle Chart
click to view larger chart


The chart to the right is The Jupiter Cycle chart … markets peak with Jupiter in Taurus (dark green), drop into Jupiter in Leo (red) and rise again into Jupiter in Sagittarius (blue).

If the cycle plays out its usual tune, we could get a lower, secondary High with Jupiter in early Gemini … but it’s usually all downhill from there.

It’s why I’m more Bearish than Bullish. You’ll note the Canary has given two examples of negative divergence now … a lower peak at the most recent Price High and a deeper trough during the August/October spikes down.

Fibonacci Rx levels on Jupiter Cycle chart
click to view larger chart
The Fibonacci Rx levels marked on The Jupiter Cycle chart show the downside Price targets if we are now in the early stages of a renewed Bear market.

The 50% level is a particularly interesting one. Bill McLaren, an American/Australian market forecaster of long experience, has noted over the years that major consolidations during an uptrend, tend to become the halfway marker for the total rally. McLaren uses that consolidation to predict what he thinks will be “the final top” for a Bull run.

As you can see from that chart, the first long consolidation after completion of the first major wave up, marked out territory likely to become just as important on the way down.

We’ve discussed at various times over the past few months, how the ASX200 has responded to 50% markers.

So, with Pollyanna’s daily chart above, we would expect strong resistance to this bounceback rally to start showing up in the 1344-1360s region … IF she can break through the Node/Fibonacci barrier around 1325.
click to view larger chart
Now, let’s take a look at the ASX200 … and the omens continue to be just awful. Last week was a bounce from “obvious” Support … and very, very low support at that.

In the coming weeks, we’ll take a look at just how far down the Aussie market is likely to go if the Bear is back on the prowl. Believe me, it’s far, far too depressing to discuss this week!

I’ll leave you instead with an update of Auntie’s Weekly Planets chart.                    
                                click to view larger chart
Safe Trading - RA 

Randall Ashbourne
Astrological Investing's associate, Randall Ashbourne, author of the eBook, The Idiot and The Moon, writes a free weekly column titled, The Eye of Ra on his web site in  which he explains the potential impact of astrological aspects and the current state of technical conditions. Ashbourne's charts are revealing illustrations of exactly what has occurred in the market and the probability of what to expect.
Important reading:  Randall Ashbourne's article, Jupiter's cycle and its effects on Wall Street and a posting of the weekly Eye of Ra report in this blog, titled A look at the Venus Retrograde effect