Travis asked about the future of the Australian dollar AUD in relationship to the US Dollar USD.
The Australian dollar became official Feruary 14, 1966 and I gave it the time of 12:00 pm half way through the business day which is what we do in financial astrology when we do not have an exact time. When you see 12:00 pm on a chart it means pay attention to the planets and their aspects and ignore the houses. The capital of Australia is Canberra.
For the history of the AUD verses USD I used the statistics available on the web site http://www.forecast-chart.com/usd-australian-dollar.html Fortunately the historical chart of the exchange rate between the AUD and USD tracks the currency for 20 years. and gave me the opportunity to check
Here is a brief history of the AUD verses the USD.
In 1972 it cost 84 Australian dollars to buy 100 US dollars. In 1982 the dollars were par. In 1992 it cost 136 AUD to buy 100 USD and in 2001 it cost 194 AUD to buy 200 and in 2002 it cost 184 AUD to buy 100 USD.
When the AUD began its Sun was at 24 Aquarius where Jupiter is currently transiting and it had a stellium of Mercury Mars and Saturn in Pisces.
At the moment it costs 110 AUD to purchase 100USD. The question is will it take fewer AUD to buy USD or more and how will Jupiter influence the exchange.
1982 Par Jupiter in Scorpio trine the Pisces planets
1992 Jupiter in Virgo opposed the Pisces planets
2001 Jupiter in Gemini conjunct the AUD’s natal Jupiter
2002 Jupiter in Cancer trine the AUD Pisces planets
It appears that Jupiter produces too many AUD in relation to the USD.
Trend for Jupiter transiting Pisces
Jupiter was in Pisces in 1986 when the AUD was allowed to float. That year it cost 150 AUD for 100 USD and the following year 1987 the AUD was 143 to 100 USD. Therefore the AUD gained in value and then stabilized from 1988-1997. In 1998 Jupiter returned to Pisces and the AUD was 159 to USD 100 and continued to deteriorate until 2001 when Jupiter returned to its natal position in Gemini.
Now we have a pattern for Jupiter in the chart of the Australian dollar. Jupiter trine its Pisces stellium or conjunct its natal Jupiter tends to produce too many Australian dollars and therefore they lose their value when used to purchase US dollars.
Does this help the Day trader? It gives the trader first the overall trend and then it tells him that an aspect of transiting Jupiter to the chart of the Australian dollar will tend to increase the number of AUD it takes to buy a USD.
Research using Jupiter Transits
Here is the page I used http://www.oanda.com/currency/historical-rates
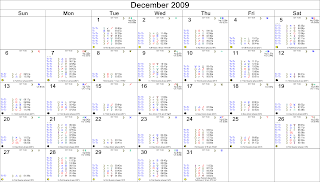
during November and December 2009. Here are the steps we need to consider.
1. Jupiter is applying by transit to the Sun of the AUD. Therefore trades could exceed fractions of a penny.
2. Jupiter made the following aspects on trading days when the moon was not void of course.
3. Now we need to know did the AUD go up from the day before or did it go down
AUD to USD
Nov 3 Moon square Jupiter .902 day before it was 900 therefore up
Nov 5 Moon trine Jupiter .905 up
Nov 9 Moon opposed Jupiter .919 up
Nov 10 Sun square Jupiter .926 up
Nov 13 Moon trine Jupiter .930 same
Nov 16 Moon square Jupiter .934 up
Nov 18 Moon sextile Jupiter .931 down
Nov 23 Moon conjunct Jupiter and Venus square Jupiter .915 same
Nov 30 Moon square Jupiter .907 up
Dec 2 Moon trine Jupiter .919 up
Dec 11 Moon trine Jupiter .914 up
Dec 14 Sun sextile Jupiter .913 same
Mars Dec 20 and Mercury rx Dec 26
Dec 28 Moon square Jupiter
Dec 30 Moon trine Jupiter
The overall trend is that it takes fewer AUD to buy USD right.?
But we know that Jupiter will leave the conjunction to the AUD Sun. Will this trend change?
The next outstanding problem for the AUD occurs in 2010. In January the AUD chart shows its Capricorn Venus will be hit by the Eclipse. The Central Bank's Capricorn Sun (January 14, 1960 at 10:00 am Canberra) will be hit. The January eclipse will be visible in Australia.
I discuss the power of eclipses to the charts of exchanges, nation's event charts and stocks in The Textbook for Financial Astrology.
Note the previous blog has a chart for the USD.


